Highlight
Lack of chloroplastic FBPase induces a dramatic reduction in plant development, while loss of the cytosolic enzyme increases the starch content without affecting the phenotype. Inactivation of both enzymes causes a wide range of metabolite changes.
Key words: Chloroplastic, cytosolic, fructose-1, 6-bisphosphatase, knockout mutants, metabolites, starch, sucrose.
Abstract
In this study, evidence is provided for the role of fructose-1,6-bisphosphatases (FBPases) in plant development and carbohydrate synthesis and distribution by analysing two Arabidopsis thaliana T-DNA knockout mutant lines, cyfbp and cfbp1, and one double mutant cyfbp cfbp1 which affect each FBPase isoform, cytosolic and chloroplastic, respectively. cyFBP is involved in sucrose synthesis, whilst cFBP1 is a key enzyme in the Calvin–Benson cycle. In addition to the smaller rosette size and lower rate of photosynthesis, the lack of cFBP1 in the mutants cfbp1 and cyfbp cfbp1 leads to a lower content of soluble sugars, less starch accumulation, and a greater superoxide dismutase (SOD) activity. The mutants also had some developmental alterations, including stomatal opening defects and increased numbers of root vascular layers. Complementation also confirmed that the mutant phenotypes were caused by disruption of the cFBP1 gene. cyfbp mutant plants without cyFBP showed a higher starch content in the chloroplasts, but this did not greatly affect the phenotype. Notably, the sucrose content in cyfbp was close to that found in the wild type. The cyfbp cfbp1 double mutant displayed features of both parental lines but had the cfbp1 phenotype. All the mutants accumulated fructose-1,6-bisphosphate and triose-phosphate during the light period. These results prove that while the lack of cFBP1 induces important changes in a wide range of metabolites such as amino acids, sugars, and organic acids, the lack of cyFBP activity in Arabidopsis essentially provokes a carbon metabolism imbalance which does not compromise the viability of the double mutant cyfbp cfbp1.
Introduction
Sucrose and starch are the major end-products in higher plants, and their functions are essential for plant development (Geigenberger, 2011). The rate of net CO2 fixation determines the rate of starch and sucrose synthesis. The photosynthetic carbon reduction cycle (the Calvin–Benson cycle) is responsible for the formation of these carbohydrates after the fixation and reduction of atmospheric CO2, the first important intermediate metabolites being the triose-phosphates (TPs). By condensation, TPs form fructose-1,6-bisphosphate (F1,6BP) which is used to synthesize starch in the chloroplast and sucrose in the cytosol. Fructose-1,6-bisphosphatase (FBPase) catalyses the breakdown of F1,6BP to fructose-6-phosphate (F6P) and Pi (Zimmermann et al., 1976). Three FBPases have been described so far in the plant cell, the cytosolic enzyme (cyFBP) which is involved in sucrose synthesis and gluconeogenesis (Cséke and Buchanan, 1986), and two other chloroplastidial isoforms (cFBP1 and cFBP2) (Serrato et al., 2009a, b). The chloroplastic FBPase (cFBP1; EC 3.1.3.11) is a key enzyme of the Calvin–Benson pathway and is involved in the regeneration of ribulose 1,5-bisphosphate (RuBP) and in the starch synthesis pathway.
cyFBP and cFBP1 display a similar tertiary structure, with the exception of an extra sequence of 20–30 amino acids in the regulatory domain of cFBP1 (called ‘loop 170’), which includes three cysteines, two of which can form disulphide bonds that can be reduced by plastidial thioredoxin f (TRX f) during light activation (Chiadmi et al., 1999). The novel isoform cFBP2 lacks loop 170 in its sequence, is not redox regulated by TRX f, and its affinity for the substrate FBP is 6.6-fold lower than that of cFBP1 (Serrato et al., 2009a, b). The activity of the cytosolic isoform is inhibited by an excess of substrate and shows allosteric inhibition by AMP and fructose-2,6-bisphosphate (F2,6BP). cyFBP and sucrose phosphate synthase (SPS) are considered major sites for controlling sucrose synthesis (MacRae and Lunn, 2006). Additionally, pyrophosphate:fructose-6-phosphate 1-phosphotransferase (PFP), which catalyses the reversible interconversion of F6P and F1,6BP, is also considered as an important regulatory point of primary carbon metabolism toward glycolysis or gluconeogenesis in the cytosol (Nielsen and Stitt, 2001).
Considerable effort has been made to investigate which steps control the biosynthesis and distribution of carbohydrates in plant cells. By using various transgenic approaches in different plant species, the roles of chloroplast and cytosolic FBPases have been analysed in this context (Koßman et al., 1994; Sahrawy et al., 2004). These results depended on the genetically manipulated plant species, the level of repression or overexpression of the gene selected (chloroplastic or cytosolic FBPase) (Sharkey et al., 1992; Zrenner et al., 1996; Strand et al., 2000), and the tissue (leaf) or organ analysed (fruit or tuber) (Obiadalla-Ali et al., 2004). Most of the data which have been reported concern the photosynthesis rate, starch and sucrose content, and general phenotypes. Nevertheless, these studies have not led to clear and consistent results on the specific role of FBPases. In general, the use of these transgenic strategies has given rise to some confusion on the function of FBPases in sucrose and starch levels in plants and their turnover, and the results to date remain imprecise, making it impossible to draw unambiguous conclusions.
To shed light on this confusing information, a comprehensive analysis of Arabidopsis cyFBP and cFBP1 loss-of-function mutants, as well as the corresponding double mutant has been performed for the first time. The main objective was to determine the contribution of each FBPase to photosynthesis, plant development, reactive oxygen species (ROS) metabolism, carbon partitioning, and metabolic profiles in leaves over a day/night period. Physiological, biochemical, and metabolic evidence is provided that cFBP1 activity is critical for normal plant development and important for a wide range of metabolic processes, while cyFBP appears essentially to affect starch levels.
Materials and methods
Plant material and growth conditions
Arabidopsis thaliana wild-type (ecotype Columbia) and mutant plants, cyfbp, line SALK_064456 (At1G43670) corresponding to the mutant line fins1 (Cho and Yoo, 2011), and cfbp1, line GK-472G06-019879 (At3g54050) (Serrato et al., 2009a), were grown in soil during 20 d in culture chambers under long-day conditions (16h light/8h darkness) at 22 °C during the light and 20 °C during darkness. The light intensity was set at 120 μmol m–2 s–1. The double mutant, called cyfbp cfbp1, was obtained by manual crossing of the single mutants cyfbp and cfbp1. The oligonucleotides used for the genotyping (Supplementary Table S1 available at JXB online) and the homozygous selections were: CYFBP F and R for cyfbp, and CFBP1 F and R for cfbp1, in conjunction with the oligonucleotides (LBSALK and GABI) hybridizing with the T-DNA sequence. Five plants were harvested at intervals of 5 d for 30 d, then the number of leaves per rosette was counted, and the fresh weight (FW) per plant and area were measured. For root length measurements, seedlings were grown in vertical plates. Arabidopsis cfbp1 and cyfbp mutants were complemented with pGWB4-derived constructions expressing the green fluorescent protein (GFP) translationally fused proteins cFBP1:GFP and cyFBP:GFP under the control of 1kb of their respective promoters (Supplementary Fig. S1A).
Gas exchange measurements and PSII photochemical efficiency
Photosynthetic gas exchange was measured using a portable LI-6400 infrared gas analyser (LI-COR Biosciences, Inc., Lincoln, NE, USA), which allows environmental conditions inside the chamber to be precisely controlled. The CO2 assimilation rate was determined in the upper leaf of the wild-type and mutant plants grown for 3 weeks by changing light intensities (light curve), with a range from 0 to 2000 μmol quanta m–2 s–1. To measure the CO2 response (CO2 curve), the CO2 concentration was changed with the range: 400 to 50 and 50 to 1500 μmol mol–1, and the irradiance was set at 1000 μmol quanta m–2 s–1. The photosynthetic parameters were calculated by using LI-6400 6.1 software. Photosyn Assistant, software developed by Dundee Scientific (Parsons and Ogston, 1999), was used to estimate the following parameters, dark respiration (R d), light compensation point (Г), and the maximum photosynthesis rate (A max), from the A to light (A/Q) curve as well as the maximum rate of Rubisco carboxylation (V cmax), maximum rate of electron transport (ETR) (J max), and TP use (TPU) from A to intercellular CO2 concentration (A/C i) curves, to help in the comparison between the mutants.
Parameters of chlorophyll fluorescence emission were measured at 22 ºC with a PAM 2000 chlorophyll fluorometer (Walz, Effeltrich, Germany). The maximum quantum yield of PSII (F v/F m) was calculated from the parameters using the following equation: F v/F m=(F m–F o)/F m, where F o is the initial minimal fluorescence emitted from leaves dark adapted for 15min and F m the maximal fluorescence elicited by saturating actinic light.
Determination of photosynthetic pigments
After pigment extraction in 80% acetone, the content of chlorophyll a (Chla) and b (Chlb), and carotenoids was spectrophotometrically quantified according to the method of Lichtenthaler and Wellburn (1983).
Characterization of stomata
The shape and number of the stomata and epidermal cells were observed and measured from a similar leaf to that used for gas exchange determinations. Digital photographs of a 427-fold magnification were taken using a Zeiss variable pressure scanning electron microscope (LEO 1430VP) from six different fields per leaf of the adaxial and abaxial epidermis of three individual genotypes. Adobe Photoshop software was used for counting cell numbers and quantification of stomatal density.
Oxidative metabolism assays
The H2O2 concentration in leaf extracts was measured by spectrofluorimetry using homovanillic acid (Ex=325nm and Em=425nm) and horseradish peroxidase as described elsewhere (Pazmiño et al., 2011). The content of carbonyl groups was measured by derivatization with 2,4-dinitrophenylhydrazine, according to Romero-Puertas et al. (2002). Glycolate oxidase (GOX; EC 1.1.3.1) activity was assayed spectrophotometrically according to Kerr and Groves (1975). The activity of catalase (CAT; EC 1.11.1.6) was determined as described by Aebi (1984). Superoxide dismutase (SOD) isoenzymes were separated by native-PAGE on 10% acrylamide gels and were localized by a photochemical method (Beauchamp and Fridovich, 1971). Ascorbate peroxidase (APX; EC 1.11.1.11) activity was assayed as described by Jiménez et al. (1997). Lipid peroxidation was determined by the thiobarbituric acid-reactive substances method (Buege and Aust, 1972). Specific antibodies were used to determine 2-Cys peroxiredoxin (2-Cys Prx) and 2-Cys Prx-SO2H (oxidized form of 2-Cys Prx) proteins by western blotting (Iglesias-Baena et al., 2010).
Determination of sugars
Carbohydrates were extracted from frozen 20-day-old Arabidopsis leaf rosettes with 80% ethanol (v/v) at 80 ºC, followed by further washing with 50% ethanol at 80 ºC (Stitt et al., 1978). After centrifugation, sucrose, glucose, and fructose were measured enzymatically in the extraction solution by determining the reduction of NADP at 340nm according to Sekin (1978). Starch was extracted with 50mM HEPES pH 7.6, 1% Triton X-100 buffer, and filtered through two layers of Miracloth (Millipore, MA, USA) and centrifuged. The pellet was resuspended in Percoll 90% (v/v), centrifuged and then the pellet was resuspended in ethanol and measured as glucose from the extract, following incubation with α-amylase and amyloglucosidase.
RT–PCR analysis
Total RNA was extracted and reverse transcription–PCR (RT–PCR) was carried out as described by de Dios Barajas-Lopez et al. (2007). Primers used are listed in Supplementary Table S1 at JXB online.
Light and electron microscopy
After sample processing (as described in de Dios Barajas-Lopez et al. (2007), semi-thin sections (1mm) of Arabidopsis leaves and roots were stained with toluidine blue for structure visualization in an OLYMPUS BX51 light microscope, and ultra-thin sections (70–90nm) were examined by high resolution transmission electron microscopy (TEM) (LIBRA 120-EDX-Carl Zeiss SMT).
Protein extraction, western blotting, and FBPase and PFP enzymatic activities
The protein concentration of extracts was determined with the Bradford assay (1976). Western blotting and FBPase assays were performed according to Serrato et al. (2009a). The modified method of Kombrink (1984) was used to measure PFP activity.
Measurement of hexose-phosphates, triose-phosphates, and 3-PGA
Leaf samples of the Arabidopsis wild type and mutants (six biological replicates) were snap-frozen in liquid nitrogen, ground to a fine powder using a liquid nitrogen-cooled Mixer Mill MM200 (Retsch; http://www.retsch.com), and extracted to measure hexose-phosphates (Glc6-P, Fru6-P, Glc1-P, and Fru1,6-BP), TPs [glyceraldehyde 3-phosphate (GAP) and dihydroxyacetone phosphate (DHAP)], and 3-phosphoglycerate (3-PGA) using enzymatic assays coupled to NAD(P)H fluorescence analysis, as previously described in Thormählen et al. (2013).
GC-MS analysis of polar primary compounds
A 50mg aliquot of leaf samples prepared as above was extracted and the relative metabolite contents were determined by gas chromatography–mass spectrometry (GC-MS), as previously described in Thormahlen et al. (2013). For the visualization and analysis of networks with related experimental data, Vanted version 2.1.0 (IPK Gatersleben, Germany) was applied as a tool.
Results
T-DNA insertions knock out the expression of both FBPase isoforms
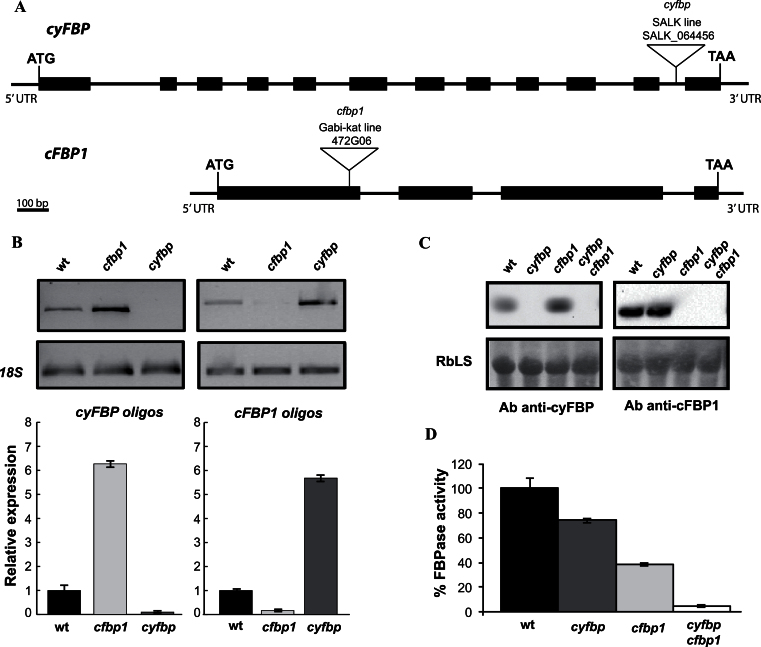
The T-DNA insertions are located in intron 11 and exon 1 (positions +1111 and +111 with respect to the start codon) for cyfbp and cfbp1, respectively (Fig. 1A). In Fig. 1B it can be seen that no cyFBP expression can be observed in the cyfbp mutant, corroborating previous results by Cho and Yoo (2011), and only a very faint cFBP1 signal was observed in cfbp1. Interestingly, cyFBP transcript and protein increased in cfbp1 whereas the amount of cFBP1 mRNA was increased in the cyfbp mutant rosette (Fig. 1B, C). The double mutant cyfbp cfbp1 was generated by crossing the respective single knockout mutants. In each case, the complete loss of the respective proteins (Fig. 1C) was confirmed by western blot analysis using specific antibodies (Serrato et al., 2009a). The negligible in vitro FBPase activity in the double mutant validated the FBPase assay conditions, corroborating that the 80% of FBPase activity measured in cyfbp and the 40% of FBPase activity obtained in cfbp1 were due to the cFBP1 and cyFBP activities, respectively (Fig. 1D). No compensation by PFP activity (using specific assay conditions of F1,6BP hydrolysis) was observed in any FBPase mutant, being similar in cyfbp and the wild type and surprisingly lower when cFBP1 was lacking (Supplementary Fig. S1C at JXB online).
Fig. 1.
Analysis of mutant lines. (A) Genomic structure of cyFBP and cFBP1. Exons and introns are indicated as thick and thin black bars, respectively. Insertion sites of T-DNA in mutant lines cyfbp and cfbp1 at intron 11 and exon 1, respectively, are indicated by triangles. (B) Expression profile of each FBPase using specific oligonucleotides in the cyfbp and cfbp1 mutants and the wild type (wt); 18S was used as the housekeeping gene. (C) Western blot analysis of crude leaf extracts of cyfbp, cpfbp1, and cyfbp cfbp1 mutants and the wt. Proteins (25 μg) were separated by SDS–PAGEs, transferred to nitrocellulose filters, and immunolabelled with rabbit antiserum raised against cyFBPase and cFBPase1 antibodies (see the Materials and methods). Bands are ~40kDa, and RbcLS was used as loading control. (D) FBPase activity was determined in extracts of wt and mutants plants.
Changes in the phenotypes of cyfbp, cfbp1, and cyfbp cfbp1 mutants
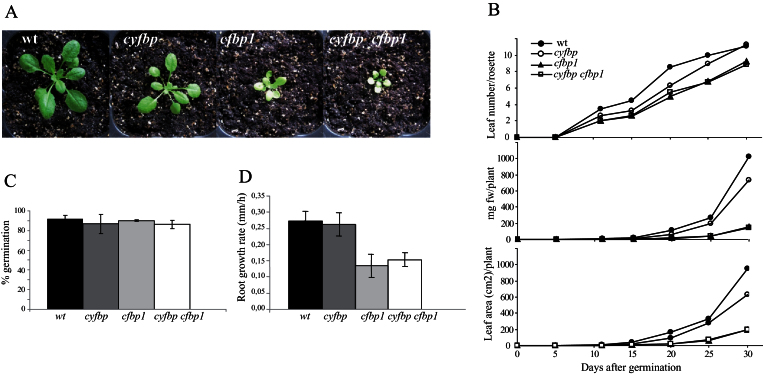
The cyfbp mutant is slightly smaller than the wild-type plants (Fig. 2A) and no major difference is observed for this mutant. However, the absence of cFBP1 has a dramatic effect on plant development, and the rosettes of both cfbp1 and the double mutant had fewer leaves, smaller size, and lower growth rates than the wild type (Fig. 2A, B). The fresh weight and leaf area decreased by 7-fold and 5-fold, in cfbp1 and cyfbp cfbp1 mutants, respectively, when compared with the wild type (Fig. 2B). Nevertheless, seed viability and germination were normal for all the mutants (Fig. 2C). Root growth analysis showed that cfbp1 and cyfbp cfbp1 roots were ~50% shorter and the root growth speed was 2-fold slower than that of wild-type and cyfbp roots (Fig. 2D).
Fig. 2.
Growth of cyfbp, cfbp1, and cyfbp cfbp1 mutants and the wild-type (wt) plants. Seeds of mutant and wt plants were sown in soil and cultured in a growth cabinet under 16h light/8h dark. Pictures were taken 21 d after sowing. (A) cyfbp, cfbp1, and cyfbp cfbp1 mutants and the wt. (B) Leaf number per rosette; fresh weight (FW) in mg per plant, and leaf area in cm2 of mutants and the wt during the experimental time course plotted against the number of days after germination of seeds. (C) Rate of seed germination. (D) Root growth rate in the first 24h after germination.
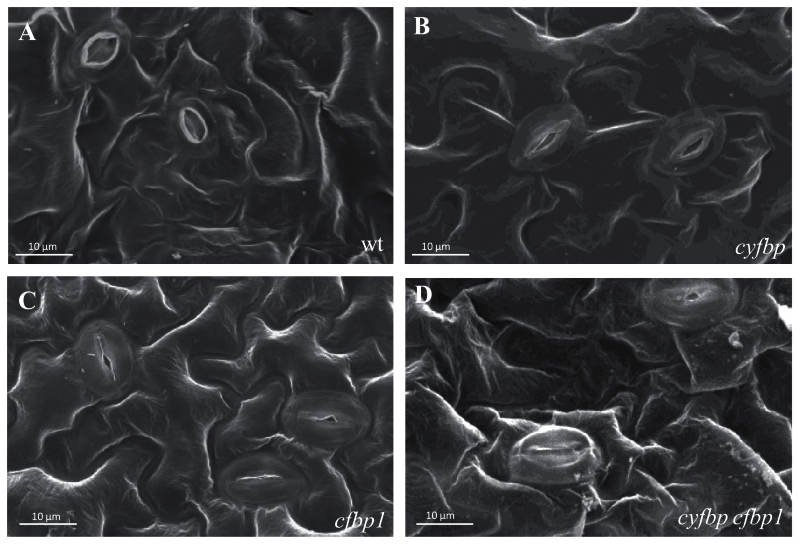
Scanning electron microscopy analysis of the stomatal morphology of the abaxial side of Arabidopsis leaves showed a higher stomatal closure in cfbp1 and double mutants compared with the full open stomata of wild-type plants under environmental conditions. As shown in Fig. 3B–D, and Supplementary Table S2 at JXB online, the stomatal density on the adaxial side of the cyfbp, cfbp1 and cyfbp cfbp1 mutants was 41, 23, and 29% lower, respectively, than that found on the adaxial surface of the wild-type leaves. However, the same mutants had 46%, 62%, and twice as many stomata per mm2 on the abaxial side than the wild type, respectively. With regard to leaf size, the stomatal index values of the rosette leaves of cyfbp, cfbp1, and cyfbp cfbp1 were all lower than those of the wild type (Supplementary Table S2).
Fig. 3.
Scanning electron micrographs illustrating morphological differencesof the stomata of ‘adaxial’ leaf surfaces from Arabidopsis wild-type (wt) (A), cyfbp (B), cfbp1 (C), and cyfbp cfbp1 (D) mutants. Scale bars=10 μm.
Cell structure alterations of cyfbp, cfbp1, and cyfbp cfbp1 mutants
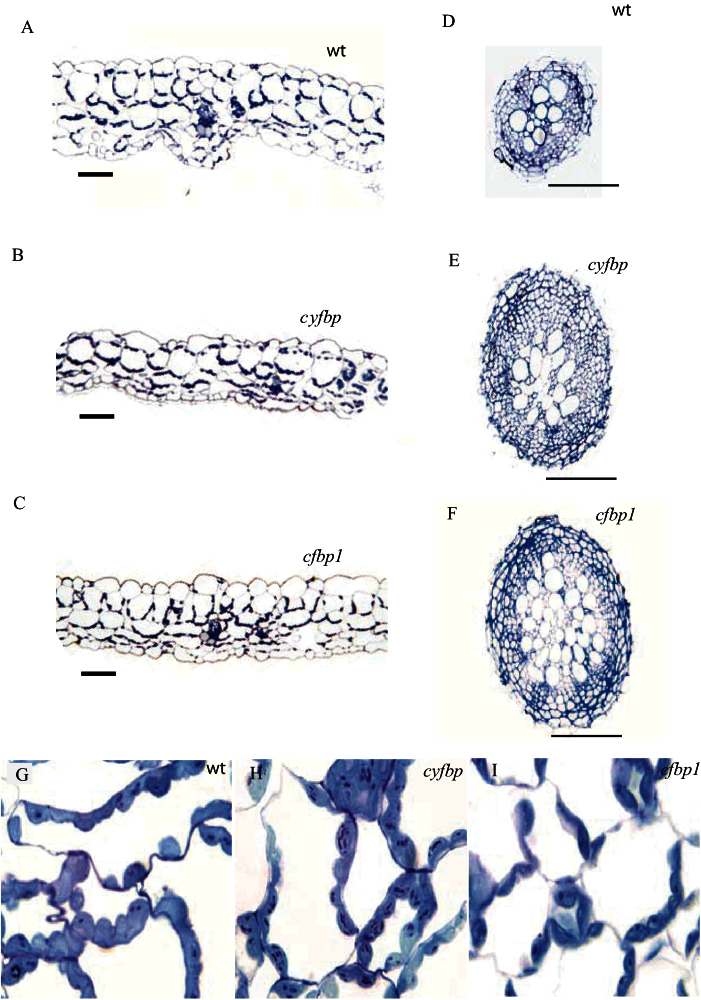
The structure of the non-flowering rosette leaf and root cross-sections analysed by light microscopy showed different cell types in leaves, epidermis, mesophyll (palisade and spongy), xylem, phloem, and stomata (Fig. 4A–C). The cell structure of the cyfbp mutant is similar to that of the control plant, but chloroplasts contained more starch granules when examined at a higher magnification (Fig. 4G–I). The cfbp1 mutant had a higher number of intercellular spaces, and few chloroplasts with fewer starch granules (only one in some cases) (Fig. 4I). Some of the chloroplasts displayed a centrifugal position only on opposite side to the light source (Fig. 4C). cyfbp cfbp1 showed similar cell structure to its cfbp1 parent (data not shown).
Fig. 4.
Light microscopy images of leaf cell types (A–C), the root vascular cylinders (D–F), and the cell structure (G–I) of the wild type (wt), and cyfbp and cfbp1 mutants of Arabidopsis plants grown for 21 d under a 16h light/8h dark regime. Semi-thin cross-section of leaves and roots from the wt (A, D, G), cyfbp mutant (B, E, H), and cfbp1 mutant (C, F, I) were stained with toluidine blue (which stains proteins). Scale bars=100 μm.
The cfbp1 mutation resulted in a greater number of cell layers in the root vascular cylinder, and there were twice as many vascular tissue cells per layer, in comparison with the wild-type root (Fig. 4D, F). However, no disorganization was detected and the shape and size of cells were normal. The roots of the cyfbp mutant had a slightly higher number of cells in the vascular cylinder than the control (Fig. 4D, E).
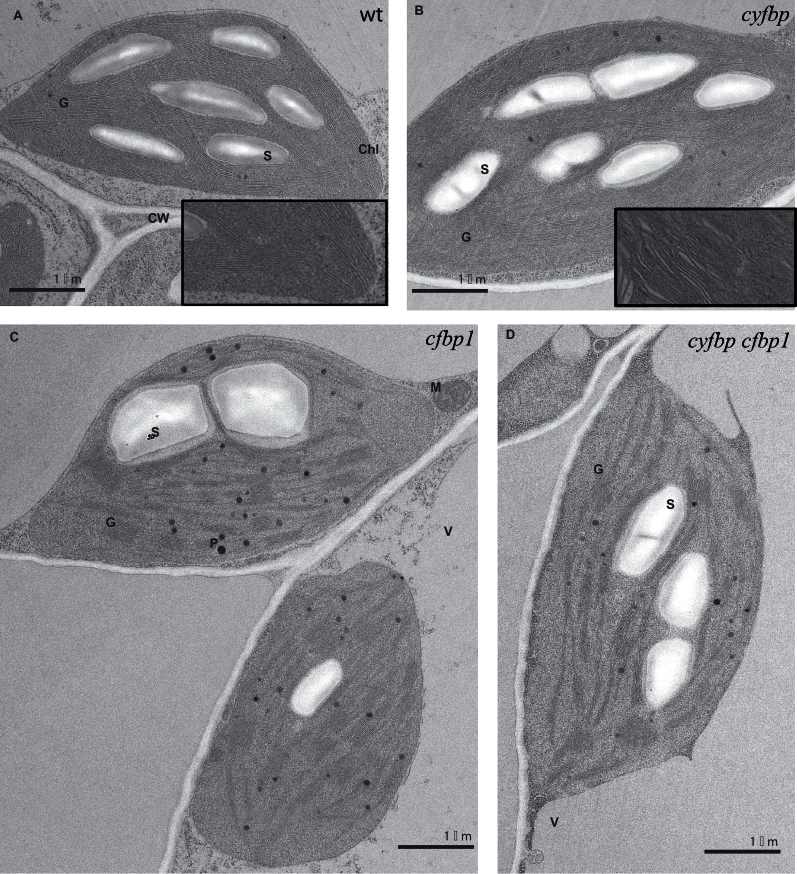
The observations by TEM showed disturbances in the cell structure of the cfbp1 and double mutant, characterized by a decreased number of thylakoids and grana lamellae but without disrupting the chloroplast ultrastructure (Fig. 5). A higher number of plastoglobuli was detected in cfbp1 and cyfbp cfbp1 chloroplast than in the wild type (Fig. 5C, D). A lower starch content was observed in cfbp1 and the double mutant than in cyfbp and the wild type (Fig. 5A, B).
Fig. 5.
Transmission electron microscopy analysis of leaf sections from wild- type (wt) (A), cyfbp1 (B), cfbp1 (C), and cyfbp cfbp1 (D) plants. Leaves were collected at 4h in a 16h light/8h dark photoperiod, fixed, embedded, and sectioned as described in the Materials and methods. G, grana; S, starch; V, vacuole; P, plastoglobule; Chl, chloroplast; CW, cell wall; M, mitochondrion.
Pigment content decreases drastically in cfbp1 and cyfbp cfbp1
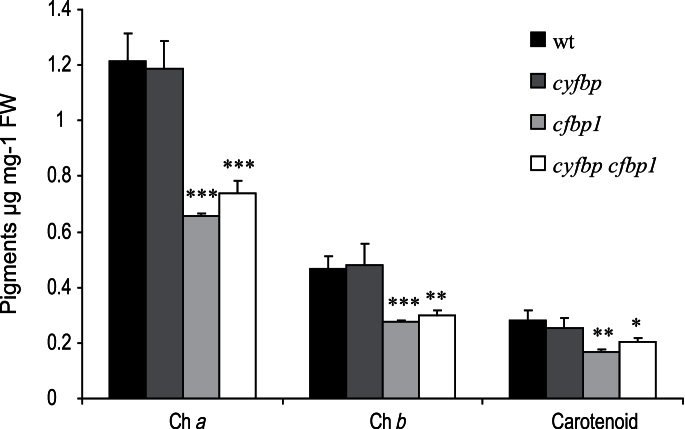
The Chla, Chlb, and carotenoid contents were considerably reduced (~40–50%) in the cfbp1 and cyfbp cfbp1 mutants compared with the wild type, while the cyfbp mutant displayed values similar to those of the wild type (Fig. 6).
Fig. 6.
Pigment content of chlorophyll a and b and carotenoids in wild-type (wt) and cyfbp, cfbp1, and cyfbp cfbp1 plants. Values are means ±SE of measurements on at least 5–7 leaves of three different plants. Error bars show the standard error of the squared mean. Significant differences between means within a time point are indicated with asterisks (*P<0.05, **P<0.01, ***P<0.001).
Effect of FBPase removal on CO2 assimilation and PSII photochemical efficiency
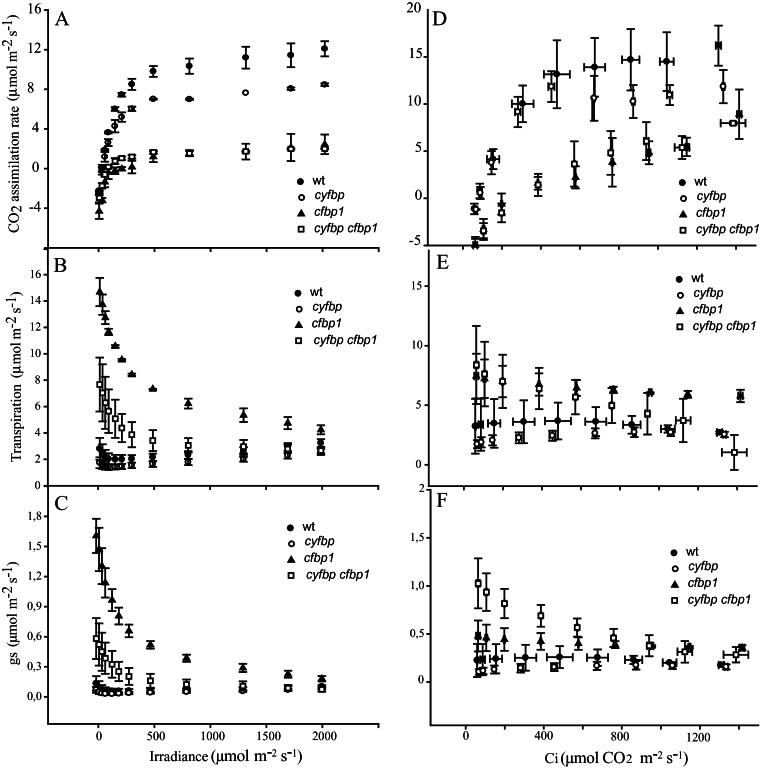
With an open gas exchange system, CO2 assimilation rates (A) were determined on attached leaves of plants grown under 120 μmol m–2 s–1 and ambient CO2. The light–response curves (A/Q) at ambient CO2 are shown in Fig. 7A. Under these conditions, the photosynthesis rate of the wild type had a maximum of 13.5 μmol m–2 s–1 at 2000 μmol m–2 s–1. At light intensities <250 μmol m–2 s–1, the cyfbp mutant assimilation rate was similar to that of wild-type plants, while at higher intensities the assimilation rate was ~33% lower. At light intensities between 100 μmol m–2 s–1 and 500 μmol m–2 s–1 (standard growth conditions), the A of the cfbp1 and cyfbp cfbp1 mutants showed superimposed curves with values near 1, indicating an impaired CO2 assimilation capacity and a poor photosynthesis/respiration ratio. At higher intensities, both cfbp1-containing mutants had lower CO2 fixation (~6-fold) than did the wild type, reaching a maximum of 3.4 μmol m–2 s–1 (Fig. 7A). Transpiration (E) and stomatal conductance (g s) values were higher at lower irradiance in cfbp1 and cyfbp cpfbp1 leaves in comparison with wild-type plants (Fig. 7B, C). However, when the light intensity was increased, E and g s converged to reach wild-type and cyfbp mutant values at 2000 μmol m–2 s–1 (Fig. 7B, C).
Fig. 7.
Photosynthetic capacity of the wild type (wt) and cyfbp, cpfbp1, and cyfbp cpfbp1 mutants. Plants were grown in a controlled growth cabinet under 100 μmol m–2 s–1 light regimes for 20 d. Photosynthetic carbon fixation rates were determined in the newest fully expanded leaf, as a function of increasing irradiance (A) at saturating CO2 (400 μmol mol–1; A/Q response curve) and as a function of increasing CO2 concentration (D) at saturating light levels (1000 μmol m–2 s–1; A/C i response curve). Transpiration (E) and stomatal conductance (g s) were determined in the same leaves (B, E and C, F). Values represent the mean of eight plants ±SE.
The response of net photosynthesis to increasing internal leaf CO2 concentration (C i) at 1000 μmol m–2 s–1 (A/C i curve) exhibited a similar behaviour (Fig. 7D). The photosynthesis rate of wild-type plants increased to a maximum of 16.2 at 1300 ppm of CO2. At the same concentration of CO2, the cyfbp mutant decreased by 25%, whereas cfbp1 and cyfbp cfbp1 Arabidopsis plants had a 2-fold lower photosynthetic rate. This suggests that cFBP1 deficiency exerts a stronger effect on CO2 fixation than cyFBP deficiency. Transpiration values of cfbp1 mutant were higher than those of the other mutant lines and control plants at all CO2 concentrations tested (Fig. 7E). Curiously, transpiration and conductance in the cyfbp cfbp1 mutant (Fig. 7E, F) displayed high values at lower CO2 concentrations but these declined slowly at higher concentrations, reaching levels similar to those of the wild-type plants. No significant differences were detected for the E and g s of the wild type and cyfbp mutant in relation to the intercellular CO2 concentration.
The Photosyn Assistant program, version 1.1.2, which is based on the von Caemmerer and Farquhar equations (von Caemmerer and Farquhar, 1981) (Table 1), was used to help in the interpretation, comparison, and modelling of photosynthesis of plants grown under different environmental conditions. Based on A/Q curves, it was found that respiration rates (R d) increased by 1.6- and 1.3-fold in cfbp1 and the double mutant, respectively, compared with wild-type plants, but the differences were not significant (Table 1). The light compensation point exhibited higher values in cfbp1 and the double mutant, but only cfbp1 data differed significantly. The A max of cfbp1 and cyfbp cfbp1 was 2- and 3-fold lower, respectively, than that of the wild type and cyfbp, as indicated in the A/Q curves (Fig. 7).
Table 1.
Photosynthetic parameters of wild-type, cyfbp, cfbp1, and cyfbp cfbp1 mutant plants
Values were obtained from the A/Q and A/C i curves using the Photosyn Assistant software as described in the Materials and methods.
| A max | Γ | R d | V cmax | J max | TPU | F v/F m | |
|---|---|---|---|---|---|---|---|
| Wild type | 9.5±0.5 | 14.6±1.5 | –1.1±0.3 | 30.6±4.9 | 154±33 | 11.1±1.4 | 0.83±0.01 |
| cyfbp | 9.3±0.5 | 16.7±5.4 | –1.25±0.0 | 31.1±4.2 | 143±25 | 10.1±1.4 | 0.83±0.01* |
| cfbp1 | 4.2±0.4** | 67.3±23* | –1.81±0.7 | 19.4±2.1* | 88±12* | 8.4±1.2* | 0.77±0.01*** |
| cyfbp cfbp1 | 3.2±0.7 ** | 50.4±31 | –1.41±0.5 | 20.1±4.0 | 92±23* | 8.4±1.2* | 0.77±0.03*** |
Values are the mean ±SE of 5–10 independent determinations.
F v/F m was determined in 10 leaves from different plants. Values are the mean ±SD.
Asterisks indicate that mean values are significantly different between wild-type and FBPase mutant plants (*P<0.05; **P<0.01; ***P<0.001).
The response of net CO2 uptake to increasing intercellular CO2 (C i), the A/C i curve, showed clear differences between cfbp1 and the double mutant compared with wild-type plants. A lack of plastidial FBPase and of both FBPases led to a decrease of 37% and 34% in V cmax, 42% and 40% in J max, and 25% and 25% in TPU, respectively, suggesting damage to the CO2 assimilation process (Table 2). In contrast, the values of both J max and V cmax of plants lacking only cyFBP were similar to control values.
Table 2.
Sucrose/starch ratio in leaves of the Arabidopsis wild type, and cyfbp, cfbp1, and cyfbp cfbp1 mutants
| Hours | Wild type | cyfbp | cfbp1 | cyfbp cfbp1 |
|---|---|---|---|---|
| 0 | 0.87 | 0.66 | 5.15 | 1.91 |
| 4 | 1.11 | 0.48 | 3.18 | 1.05 |
| 8 | 1.39 | 0.29 | 1.89 | 0.20 |
| 12 | 0.72 | 0.67 | 2.85 | 1.14 |
| 16 | 1.02 | 0.73 | 1.42 | 0.96 |
| 20 | 1.16 | 0.91 | 3.00 | 3.02 |
The chlorophyll fluorescence analysis of PSII (F v/F m) showed a significant decrease of the photochemical performance for the cfbp1 and cyfbp cfbp1 mutants (Table 1), indicating a lower quantum efficiency of linear electron transport through PSII in these two mutants, in agreement with the above J max data.
Oxidative metabolism in the mutants
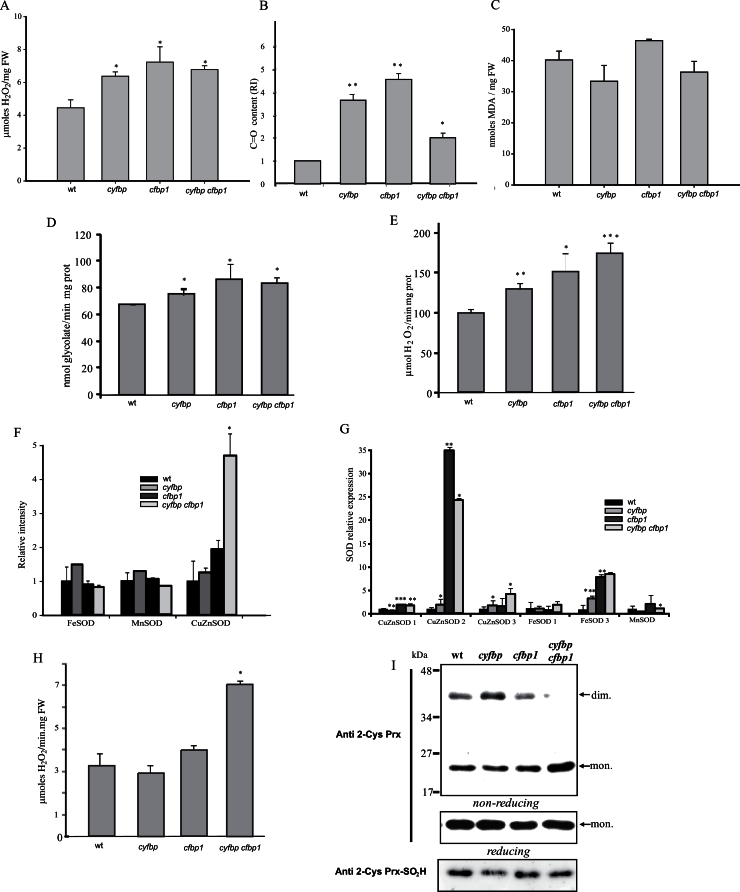
FBPase removal affects ROS metabolism in Arabidopsis mutants, and resulted in an increase in H2O2 accumulation by 42, 60, and 51%, in cyfbp, cfbp1, and double mutants, respectively (Fig. 8A). The level of protein carbonyl groups also increased by 4-, 9-, and 2-fold in cyfbp, cfbp1, and cyfbp cfbp1, respectively (Fig. 8B). However, lipid peroxidation did not change significantly in any of the mutants compared with the wild type (Fig. 8C). In order to establish possible sources of H2O2, two enzymes were studied, GOX, an enzyme from the photorespiratory pathway in peroxisomes, and SOD, which removes O2·− and at the same time produces H2O2. GOX activity increased in the three mutants, with the level in cfbp1 being the highest (1.3-fold; Fig. 8D). CAT, a peroxisomal protein involved in the detoxification of H2O2, showed a significant increase in all the lines, but mainly in cfbp1 (1.5-fold) and the double mutant (1.8-fold; Fig. 8E). However, the increase in CAT was insufficient to avoid protein oxidative damage, although in the double mutant this increase is lower. The analysis of SOD isoform activity showed a low increase in FeSOD and MnSOD in cyfbp, and a strong induction of CuZnSOD in cfbp1 and cyfbp cfbp1 (Fig. 8F). Expression analysis revealed a significant induction of the plastid isoforms CuZnSOD2 and FeSOD3 in all mutants, the highest changes being in the cfbp1 lines (Fig. 8G). APX, also involved in H2O2 removal and present in all chloroplasts and the cytosol, is induced in cyfbp cfbp1 (Fig 8H). Western blotting analysis using anti-2-Cys Prx showed a lower amount of dimer forms (Fig. 8I) and similar expression in reducing conditions of all the mutants compared with the control plant (Fig. 8I). In addition, 2-Cys Prx-SO2H was lower in all the mutants, as observed in western blotting (Fig. 8I). No differences in the non-enzymatic antioxidants ascorbate and dehydroascorbate were found after 8h light, although the ASC/DHA ratio increased in cfbp1 and the double mutant and decreased in cyfbp (Supplementary Tables S3, S4 at JXB online).
Fig. 8.
Reactive oxygen species metabolism in the Arabidopsis wild type (wt) and cyfbp, cfbp1, and cyfbp cfbp1 mutants. (A) Determination of H2O2 by fluorometry. (B) Protein oxidation measured as carbonyl group content. (C) Lipid peroxidation measured as malondialdehyde (MDA) content. (D) Glycolate oxidase (GOX) activity. (E) Catalase (CAT) activity. (F) Relative intensity of MnSOD, FeSOD, and CuZnSOD activities quantified by the Bio-Rad software Quantity one. (G) Analysis of mRNA SOD expression by qRT–PCR. (H) Ascorbate peroxidase (APX) activity. (I) Western blot analysis using anti-2-Cys Prx and anti 2-Cys Prx-SO2H antibodies. Each bar represents the mean ± SE of three independent experiments. Differences between mutant plants and the wt were significant at *P<0.05, **P<0.01, and ***P<0.001.
Day/night cycle of carbohydrate accumulation in cyfbp, cfbp1, and cyfbp cfbp1
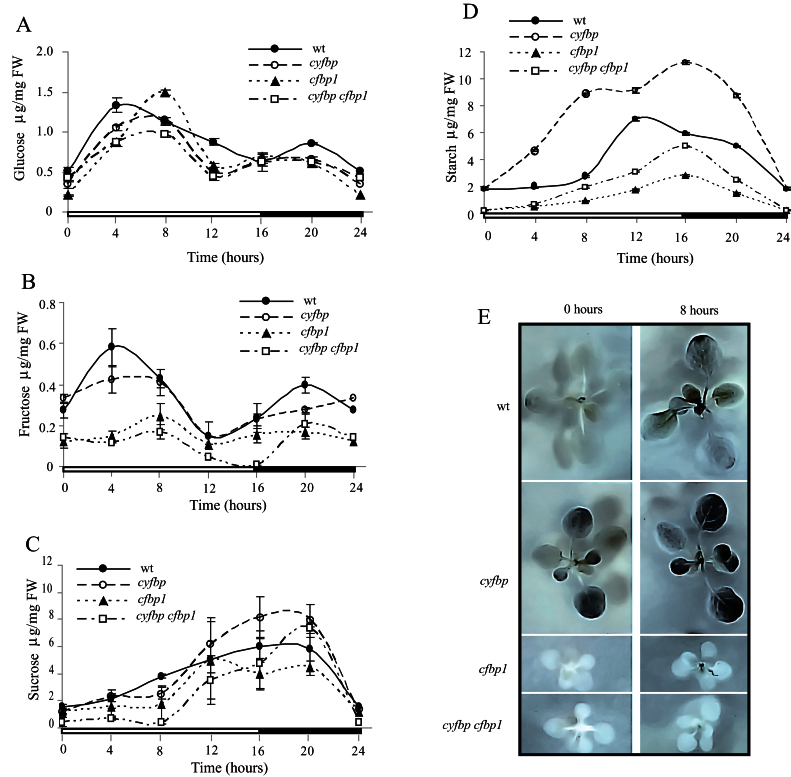
The level of soluble sugars, such as glucose, fructose, and sucrose, in wild-type and mutant plants was analysed every 4h over a 24h period (Fig. 9). Glucose accumulated during the central light period in all the lines and declined as darkness approached, but the concentrations were slightly lower than in the wild-type line (Fig. 9A). Compared with wild-type plants, all FBPase mutants showed a 4h delayed glucose accumulation peak at 8h and a dramatic drop 4h before the end of the day (the wild type displaying a constant and negative slope from 4h to 16h). cyfbp showed similar fructose amounts to the wild type, except at the points corresponding to the wild-type peak-like shape at 4h and 20h (Fig. 9B), whilst this amount decreased drastically in the cfbp1 background. The wild-type and cyfbp plants accumulated fructose at the beginning of the light period; this diminished after 8h illumination, while the cfbp1 fructose concentration was almost constant over the photoperiod (~0.2 μg mg–1 FW). The fructose level in the cyfbp cfbp1 leaves fell sharply (fructose depletion) at 16h, followed by a sharp rise during the period coinciding with starch degradation. In FBPase mutant lines, the inflexion point in sucrose accumulation occurs at 8h of the light period (slightly before that in the wild type), reaching maximum accumulation during the first half of the night period, and decreasing rapidly at the end of this period, with a similar profile in all plant lines (Fig. 9C). cfbp1 had a lower sucrose content over the photoperiod, and although cyfbp cfbp1 showed a similar profile to cfbp1 at the beginning of the light period, there was a gradual recovery ending with an accumulation peak close to that of the sucrose concentration in the wild type at night (20h).
Fig. 9.
Changes in the intracellular content of glucose (A), fructose (B), sucrose (C), and starch (D) in wild-type (wt), cyfbp, cfbp1, and cyfbp cfbp1 mutant plants. The rosette leaves were collected at 0, 4, 8, 12, 16, and 20h (4h dark) of the photoperiod. The results are the mean ±SE from three individual Arabidopsis rosettes of three different experiments. (E) Plantlets of wt and mutants plants were harvested after 8h illumination and at the end of the night, and stained in Lugol solution.
It was noteworthy that after 8h illumination, cyfbp mutant plants displayed a starch content that was ~4-fold higher than in the wild type (Fig. 9D). In contrast, the starch content was ~3-fold lower in cfbp1 compared with that found in control plants. The amount of starch detected for the double mutant plants was double that of the cfbp1 mutant, but lower than in the wild type and cyfbp, revealing that the low quantity of starch accumulated is not exclusively due to a limitation in the carbon fixation capacity of cfbp1. Staining plantlets with Lugol solution confirmed the higher starch accumulation in the cyfbp mutant (Fig. 9E). The foliar sucrose/starch ratio, an indicator of photoassimilate allocation (Table 2), was positive toward the starch content (<1) for the cyfbp line throughout the photoperiod, indicating an increased starch content in the chloroplasts when cyFBP is lacking. Conversely, this ratio was balanced towards sucrose synthesis in cfbp1 (>1), while in cyfbp cfbp1 the ratios were lower and even less than 1.
Effect of the loss of cyFBP, cFBP1, and of both FBPases on leaf metabolite levels
Supplementary Tables S3 and S4 at JXB online show the changes in leaf metabolite levels at the end of the night and after 8h of illumination (middle of the day). The lack of cyFBP activity induced a slight decrease in sugars during the night period, with the exception of maltose and trehalose, while most sugars increased in the light period, with the rise in isomaltose content being statistically significant. The cfbp1 and cyfbp cfbp1 mutant plants in the light and at the end of the night showed between 50% and 90% decreases in comparison with the wild-type in the levels of most of the sugars analysed, such as sucrose, glucose, fructose, isomaltose, and trehalose, suggesting a strong impairment of the Calvin–Benson cycle.
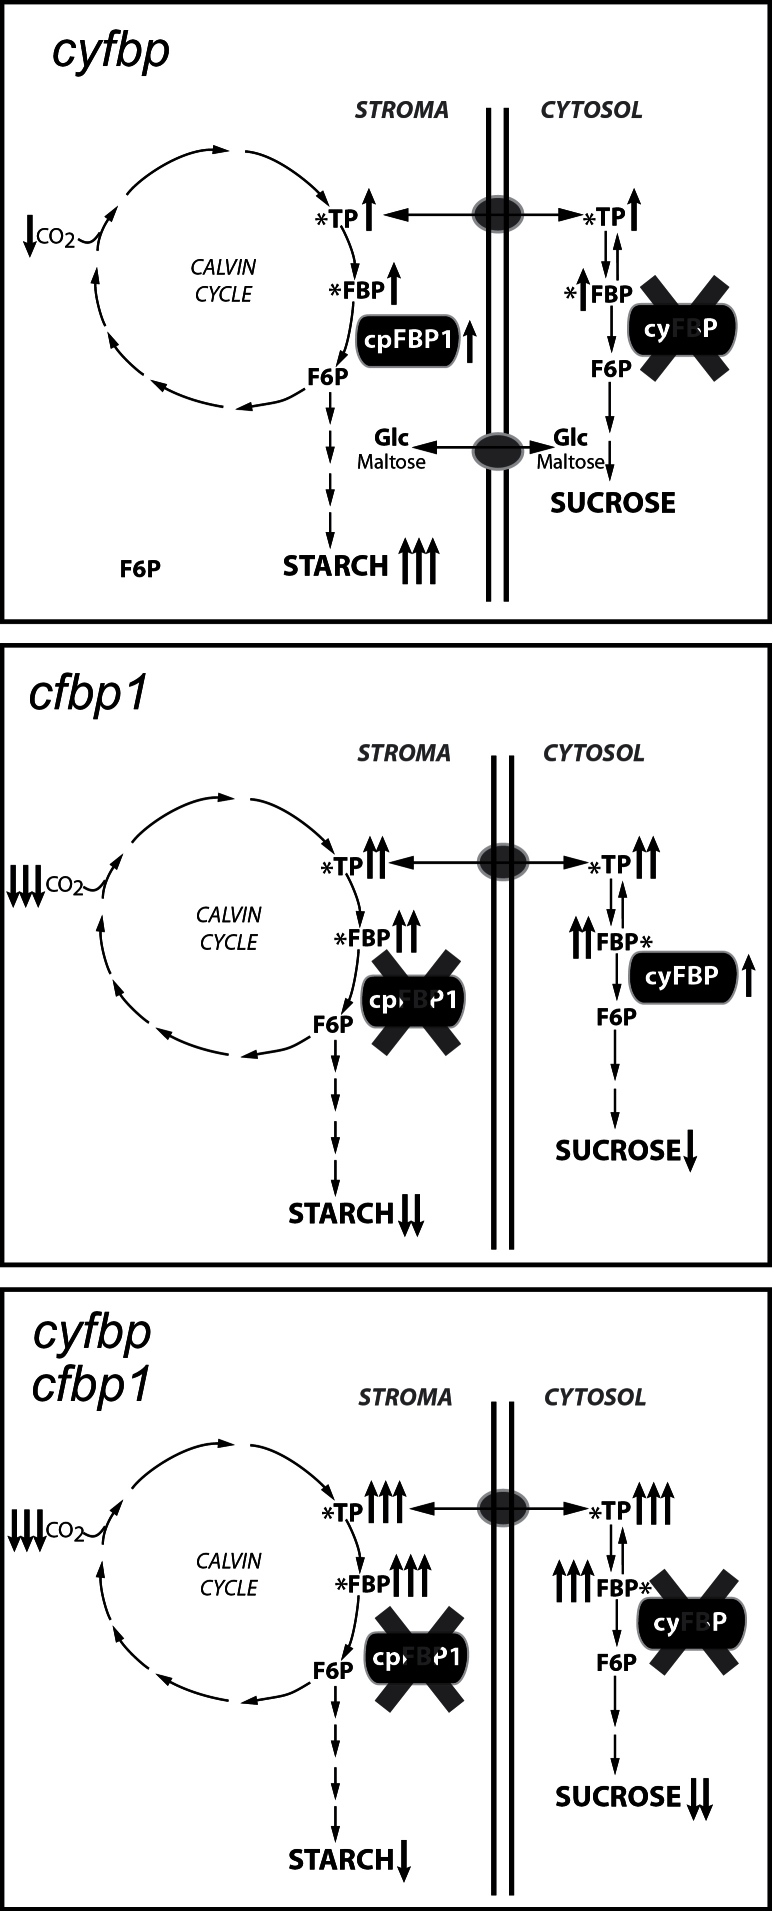
As expected, the lack of cytosolic or chloropastic FBPases during the day led to an accumulation of F1,6BP content, which was ~4-, 17-, and 60-fold higher in cfbp1, cyfbp, and cyfbp cfbp1, respectively (Fig. 11; Supplementary Table S4 at JXB online). A significant increase in TPs (DHAP and GAP) was observed, mainly in the double mutant, and in 3-PGA, the first carbon assimilates synthesized after CO2 fixation and reduction (Supplementary Table S4 at JXB online). At the end of the night, the hexose-phosphate and DHAP pools declined sharply in all the mutants. During the light period, the level of 3-PGA increased in all mutants, principally in the cyfbp mutant, and a marked decrease ocurred in cfbp1 and cyfbp cfbp1 in the night (Supplementary Table S3).
Fig. 11.
Simplified scheme of the major changes (in metabolism, photosynthesis, and gene regulation) occurring in FBPase mutants and their impact on accumulation of end-products (sucrose and starch). TP, trioses phosphate; F1,6BP, fructose-1,6-phosphate; F6P, fructose-6-phosphate.
Interestingly, the lack of cFBP1 led to marked changes in the levels of organic acids. As revealed in Supplementary Tables S3 and S4 at JXB online, the organic acid level decreased after 8h light and more intensely during the night period, especially in the cfbp1 and cyfbp cfbp1 mutants. It is worth mentioning the low content detected of glycerate, malate, fumarate, gluconate, succinate, and threonate in the metabolite group, indicating possible effects on the tricarboxylic acid (TCA) cycle in the mitochondria. During illumination, the cyfbp mutant displayed an increase in gluconate and gulonate content.
Lack of cFBP1 also led to changes in the levels of amino acids. Threonine increased by 16- and 8-fold during the night and by 9- and 5-fold at midday in the cfbp1 and cyfbp cfbp1 lines, respectively, compared with the wild-type leaf. After 8h of light, cfbp1 registered an increase in glycine and proline. Meanwhile, the amounts of serine and leucine in cfbp1 and double mutant plants reached half the values found in the wild type. The changes in the levels of glycine, serine, and glycerate suggest that photorespiration is strongly affected. In contrast, only the level of aspartate increased (3-fold) during the night in the cyfbp line.
During the light period, the group of sugar alcohol metabolites increased in the cyfbp line and generally decreased in cfbp1 and cyfbp cfbp1 (Supplementary Table S4 at JXB online). However, the erythritol, glycerol, myo-inositol, and maltitol contents were significantly different in the cfbp1 and double mutant lines. The higher content of ascorbate by 3- and 5-fold in cfbp1 and cyfbp cfbp1 mutant lines, respectively, is interesting when compared with the wild type during the night. The cyfbp mutant also displayed an increase in dehydroascorbate, a product of the ascorbic acid pathway. This suggests changes in the redox status and the possible activation of a detoxifying mechanism.
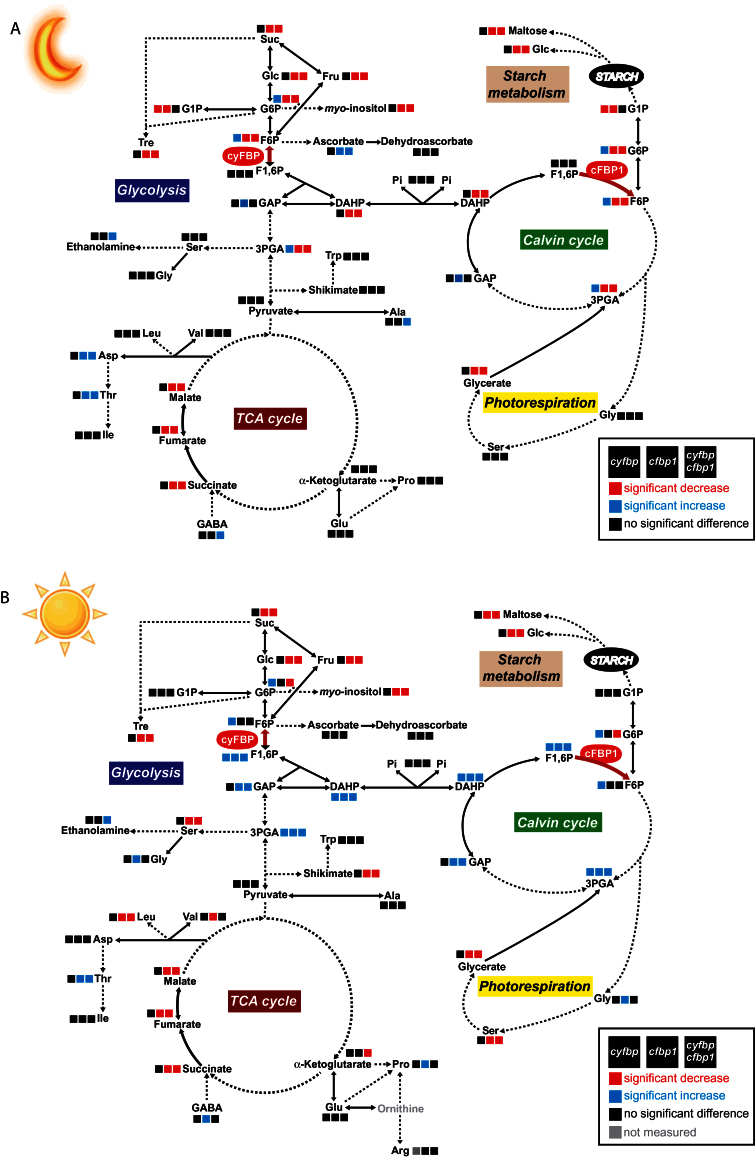
The Vanted diagrams provide an overview map of the clear metabolic changes in cyfbp, cfbp1, and cyfbp cfbp1 at the end of the night (Fig. 10A) and during the light period (Fig. 10B). These diagrams reveal that the lack of different FBPase isoforms disturbs various central metabolic processes, affecting the plant physiology and the development, as shown above.
Fig. 10.
Summary of metabolite profiling of leaves at the end of the night (A) and after 8h of light (B) as analysed by gas chromatography coupled with mass spectroscopy (GC-MS) and enzymatic assays coupled to fluorescence spectroscopy. Ratios are given between cyfbp, cfbp1, cyfbp cfbp1, and the wild-type in colour coding: red, significantly lower than the wt; blue, significantly higher than the wt (Student’s t-test, P<0.05, n=6). For the data set of metabolite profiling see Supplementary Tables S3 and S4 at JXB online.
Discussion
The existence of different FBPases in plants makes it difficult to predict the precise role or the specific metabolic contribution of each of the isoforms. In previous studies using the antisense strategy in A. thaliana and other plant species (potato, tomato, or rice), several authors reported that FBPases play an important role during the regulation of primary photosynthetic metabolism and carbohydrate synthesis in plants (Koßman et al., 1994; Obiadalla-Ali et al., 2004; Lee et al., 2008). However, most of the results were dissimilar and confusing, possibly due to specific plant metabolic adaptations in response to particular life cycles or environmental conditions.
The aim of this work is to understand the inter-relationship between the two main gluconeogenic pathways and the overall contribution of the FBPase isoforms cyFBP and cFBP1 through the study of three Arabidopsis mutants: cyfbp (affecting sucrose synthesis), cfbp1 (affecting the Calvin–Benson cycle/starch synthesis), and cyfbp cfbp1. While Cho and Yo (2011) reported the role of fins1 (cyfbp) in fructose signalling, in this study a comprehensive physiological and metabolic characterization of this mutant was carried out under normal growth conditions, together with analysis of the cfbp1 mutant and the line obtained by combining both FBPase mutations. The null cyfbp mutant showed a normal phenotype and plant growth was only slightly affected, indicating that, in Arabidopsis, sucrose synthesis may be possible with hexoses or hexose-phosphates exported from the chloroplasts (Fettke et al., 2011), probably due to an enhanced starch turnover. Several results obtained with this mutant support this hypothesis: there is (i) no compensation of FBPase activity by the cytosolic PFP (Supplementary Fig. S1C at JXB online); (ii) a starch overaccumulation (Fig. 9D, E) and a higher content of starch degradation products (Supplementary Tables S3, S4); and (iii) an up-regulated expression of the maltose transporter (MEX1), the plastidic glucose translocator (pGlcT), and the glucose 6-phosphate/phosphate translocator 1 (GPT1) and 2 (GPT2) (Supplementary Fig. S2A) (Cho et al., 2011). In a similar way, the lack of the TP translocator in the Arabidopsis tpt-2 mutant (blocking TP export into the cytosol) induces a higher starch accumulation compared with wild-type plants, but maintains a similar sucrose content. Interestingly, despite showing a non-altered sucrose level, cyFBP is down-regulated in tpt-2 (Supplementary Fig. S2B) (Cho et al., 2011). All these results suggest that A. thaliana could circumvent the cytosolic gluconeogenic pathway by accumulating and mobilizing more starch to export hexose/hexose-phosphates from the chloroplast to the cytosol with only a slight loss in photosynthetic efficiency. In contrast to cyFBP, the absence of cFBP1 leads to a dramatic phenotype, suggesting the impairment of many physiological processes, mainly photosynthesis and CO2 fixation, as has been shown in this work; with cyFBP up-regulation not being sufficient to compensate the cFBP1 loss (Fig. 1B, C). The original hypothesis of this study presumed that an additive/synergic negative effect of the two mutations on cell gluconeogenesis might have led to a lethal condition. However, surprisingly, cyfbp cfbp1 is viable, displaying a cfbp1 phenotype (Fig. 2). Expression experiments revealed only a slightly higher transcript accumulation of the plastidial isoform cFBP2 in cyfbp cfbp1 (Fig. S1B at JXB online). However, observing the negligible FBPase activity in this mutant, the contribution of cFBP2 and PFP seems to be very limited (Supplementary Fig. S1C). Moreover, the lack of cFBP2 induction in cfbp1 makes the substitution of the cFBP1 function in the chloroplast unlikely (Supplementary Fig. S1B).
The chlorotic aspect of cfbp1 and cyfbp cfbp1 leaves reflects the fact that the mutation directly determines the photosynthetic potential and primary production in these mutants. Therefore, the chlorophyll fluorescence results indicating that the lack of cFBP1 affected PSII and the photosynthetic electron transport rates are in line with the findings of a previous study in which the authors describe an Arabidopsis mutant with a loss-of-function allelic variant of cFBP1 (hcef1, from high cyclic electron flow 1), which constitutively induces cyclic electron flow (CEFI) to balance the chloroplast energy budget (Livingston et al., 2010). The decline of PSII efficiency and the rate of photosynthetic electron transport (J max, based on NADPH requirement) for cfbp1 and cyfbp cfbp1 indicates that CO2 assimilation was also limited by the rate of electron transport and RuBP regeneration. Furthermore, removal of chloroplastic FBPase activity led to a decrease in V cmax and TPU, and, consequently, as corroborated by the metabolite analysis, an increasing accumulation of TPs in all mutant lines (especially in cfbp1 and cyfbp cfbp1). It seems that the drastic changes in the organic acids malate, fumarate, and succinate may lead to the stomatal failure of the cfbp1 mutant epidermis at midday (Fig. 3), resulting in a limited CO2 gas exchange (Driscoll et al., 2006; Araujo et al., 2011; Zheng et al., 2013). No relevant difference in the rate of photosynthesis was detected in the case of the cyfbp line.
Surprisingly, a greater number of cell layers in the root vascular cylinder of cfbp1 root tissues in comparison with the wild type was observed, suggesting that root ontogenic factors are involved in order to counteract the metabolism imbalance, highlighting the co-ordination existing between green and non-green organs. It would be interesting to know what the physiological significance of this root remodelling is and the nature of the factors involved (i.e. hormones and/or transcription factors). To counteract the photosynthesis and carbohydrate metabolism deficiencies, cfbp1 root tissues might activate different metabolic pathways. Soto et al. (unpublished results) identified double the number of genes expressed in this tissue compared with the wild-type plant in a transcriptomic analysis of both FBPase knockout mutants.
In addition, photosynthetic light reactions providing the NADPH and ATP necessary for CO2 fixation and carbohydrate synthesis inevitably are linked to the production of harmful ROS (Mittler, 2002). Thus, alterations observed in PSII and the Calvin–Benson cycle in cfbp1 and cyfbp cfbp1 mutants led to ROS production. Under these circumstances oxygen can be the final acceptor of electrons from the photosynthetic electron transport chain giving rise to O2·– accumulation in chloroplasts. This situation was confirmed by the strong induction of CuZnSOD2 and FeSOD3 (Fig. 8G, H) (Kliebenstein et al., 1998). Another source of ROS is the GOX associated with photorespiration in peroxisomes which was induced in all mutant lines. The accumulation of H2O2 in these organelles induced CAT (Fig. 8E), although this did not prevent oxidative damage. It appears that H2O2 is mainly produced in the chloroplast and peroxisomes, although other sources of ROS such as NADPH oxidases or mitochondrial electron transport cannot be ruled out. Despite the fact that APX activity is induced in the double mutant, western blotting analysis (Fig. 8I) shows that the plastidial antioxidants 2-Cys Prxs are not overoxidized in the FBPase mutants, indicating that the chloroplasts may not be under a high oxidative stress (Iglesias-Baena et al., 2010). In addition, lack of both FBPases, mainly cFBP1, provokes changes in ROS metabolism and triggers an adjustment of the ASC/DHA ratio as a detoxifying mechanism. The protein targets of carbonyl production include those involved in photosynthetic CO2 assimilation and photorespiratory carbon oxidation (Rubisco large and small subunit and Rubisco activase); light-induced water oxidation at PSII (OEC3); and light harvesting and energy transfer at the photochemical reaction centre (Chl a/b-binding protein) (Johansson et al., 2004).
The comprehensive GC-TOF MS and fluorescence spectroscopy metabolite analysis provided an overview of visible metabolic alteration in the FBPase mutants, especially significant in cfbp1 and cyfbp cfbp1, underlying the dramatic change in their phenotypes. The inactivation of cyFBP leads to an overall accumulation of F1,6BP, hexose-phosphates, and thus of TPs during the light period, resulting in the increase in the starch level. However, subcellular metabolite analysis will be required to confirm this interpretation (Geigenberger et al., 2011). The amounts of most of the sugars increased, mainly maltose and isomaltose, the main products of starch mobilization in the chloroplast, while the sucrose level was similar to that of the wild type. Cho and co-workers (2011) also showed that Arabidopsis plants defective in the maltose transporter (MEX1) and the plastidic glucose translocator (pGlcT) resulted in severely reduced photosynthetic activities, a decrease of sucrose content and starch turnover, and growth retardation. A remarkable increase in trehalose content was detected in the cyfbp mutants. In fact, some authors have proposed that trehalose-6-phosphate (Tre6P), the intermediate of trehalose synthesis, is a component in a signalling pathway that mediates the regulation of the accumulation and/or turnover of transitory starch in Arabidopsis leaves, potentially linking the management of these reserves to the availability and demand for sucrose (Martins et al., 2013). The positive effects of trehalose include a decrease in photo-oxidative damage, as a potential protective element (Bae et al., 2005). As far as the cyfbp phenotype was concerned, no effect was detected in amino acid biosynthesis or other metabolic pathways when cyFBP was lacking.
In contrast, the inactivation of cFBP1 had a profound effect on photosynthetic carbon metabolism and photorespiration, leading in general to alterations in the redox status as revealed by changes in ascorbate levels. In addition, it also affected other pathways in the plants, such as amino acid and organic acid metabolism in mitochondria. As expected, the lack of cFBP1 in the light led to an accumulation of F1,6BP, TPs, and 3-PGA, and to a decline in the levels of hexose-phosphates and many sugars, including sucrose, glucose, fructose, and trehalose (signalling) and maltose (starch degradation), leading to a small rosette size. On the other hand, amino acid synthesis was also affected; the serine content diminished in cfbp1 and the double mutant, wheras the glycine level rose in cfbp1 during the light period. Both amino acids are involved in photorespiratory and non-photorespiratory pathways, and the opposite changes in serine and glycine content indicate that, during photorespiration, glycine decarboxylase activity is altered. Timm and colleagues suggest that serine, possibly together with glycine, acts as a metabolic signal for the transcriptional regulation of photorespiration, particularly in the glycine to serine interconversion reactions (Timm et al., 2013). Moreover, during an imbalance between sucrose/starch synthesis and the production of phosphorylated intermediates in the Calvin–Benson cycle, photorespiration might provide the cell with an alternative pathway for the synthesis of sink products, such as glycine and serine (Harley and Sharkey, 1991).
In addition, the inactivation of chloroplast FBPase in cfbp1 and cyfbp cfbp1 led to a fall in the levels of several organic acids involved in the TCA cycle in mitochondria, which may be a secondary consequence of the decrease in carbon fixation, including, l-tryptophan, l-phenylalanine, l-tyrosine, and shikimate, a precursor in aromatic amino acid biosynthesis. These aromatic amino acids can be precursors of numerous natural products in plants, such as pigments, alkaloids, hormones, and cell wall components.
Finally, an even sharper increase in F1,6BP and TP accumulation is observed in cyfbp cfbp1 as a consequence of both cFBP1 and cyFBP inactivation and thus a decline in sucrose content. Despite displaying a similar cfbp1 phenotype and metabolite profile, it is interesting to observe some cyfbp behaviours, such as the changes in starch levels, suggesting a combined inheritance in this mutant and raising the interesting question of how these plants can increase their starch content in the absence of cFBP1. Moreover, the survival of the double mutant lacking enzymes that regulate essential metabolic steps is remarkable. The slightly higher cFBP2 gene expression in the cyfbp cfbp1 mutant might suggest a possible compensation of the depleted carbohydrate metabolism. Thus, the redundant function of the plastidial FBPases could not be considered.
To sum up, taken together, the results of the analysis of individual and double knockout cFBP1 and cyFBP mutants lead to the suggestion that both FBPases play important roles in sucrose and starch synthesis and contribute significantly to regulating carbohydrate turnover in plants. In addition, the lack of cFBP1 induced cell structural deficiencies, and reduced plant growth. The cFBP2 isoform could not substitute the function of the other two isoforms. In addition, this study has uncovered a relationship between sugar turnover, biomass, protein content, and other important metabolic pathways, the most important being photorespiration, amino acid synthesis, and the TCA cycle.
Supplementary data
Supplementary data are available at JXB online.
Figure S1. (A) Phenotype reversion in cyfbp and cfbp1 mutants complemented with translationally GFP-fused FBPases cloned into the pGWB4 vector. (B) cFBP2 gene expression using semi-quantitative RT-PCR in rosette leaves of 20-day-old Arabidopsis plants. (C) PFP enzymatic activity.
Figure S2. (A) Maltose transporter, plastidic glucose translocator, and glucose 6-phosphate/phosphate translocator 1 and 2 gene expression using semi-quantitative RT–PCR in rosette leaves of 20-day-old Arabidopsis plants. (B, C) Western blot analysis using anti-cyFBP and anti-cFBP1 antibodies.
Table S1. Gene-specific oligonucleotides used for semi-quantitative PCR.
Table S2. Stomatal density and stomatal index in epidermis of leaves of the wild type and cyfbp, cfbp1, and cyfbp cfbp1 mutants at the adaxial and abaxial surfaces.
Tables S3. Changes in Arabidopsis leaf metabolite levels at the end of the night in cyfbp, cfbp1, and cyfbp cfbp1 knockout lines relative to the wild type.
Table S4. Changes in Arabidopsis leaf metabolite levels after 8h illumination in cyfbp, cfbp1, and cyfbp cfbp1 knockout lines relative to the wild type.
Acknowledgements
The authors thank Maria Trinidad Moreno for her technical support, and Angela Tate for helpful editorial feedback on the manuscript. The microscopy assays and observations were carried out at the Scientific Instrumentation Centre of the University of Granada (Spain). We would like to thank Dr Juan José Lázaro for the gift of anti 2-Cys Prx and anti 2-Cys Prx-SO2H antibodies. This work was funded by research project BIO2009-07297 from the Spanish Ministry of Science and Innovation and the European Fund for Regional Development, project BIO2012-33292 from the Spanish Ministry of Economy and Competitiveness, project P07-CVI-2795, and BIO 154 from the Andalucian Regional Government, Spain. MS-S was supported by a post-doctoral contract from the Andalucian Regional Government and the CSIC. JAR-G was supported by a contract from the Andalucian Regional Government. PG gratefully acknowledges support from the Deutsche Forschungsgemeinschaft.
References
- Aebi H. 1984. Catalase in vitro . Methods in Enzymology 105, 121–126. [DOI] [PubMed] [Google Scholar]
- Araujo WL, Nunes-Nesi A, Osorio S, et al. 2011. Antisense inhibition of the iron–sulphur subunit of succinate dehydrogenase enhances photosynthesis and growth in tomato via an organic acid-mediated effect on stomatal aperture. The Plant Cell 23, 600–627. [DOI] [PMC free article] [PubMed] [Google Scholar]
- Bae H, Herman E, Sicher R. 2005. Exogenous trehalose promotes non-structural carbohydrate accumulation and induces chemical detoxification and stress response proteins. Plant Science 168, 8. [Google Scholar]
- Beauchamp C, Fridovich I. 1971. Superoxide dismutase: improved assays and an assay applicable to acrylamide gels. Analytical Biochemistry 44, 276–287. [DOI] [PubMed] [Google Scholar]
- Bradford MM. 1976. A rapid and sensitive method for the quantitation of microgram quantities of protein utilizing the principle of protein–dye binding. Analytical Biochemistry 72, 248–254. [DOI] [PubMed] [Google Scholar]
- Buege J, Aust S. 1972. Microsomal lipid peroxidation. Methods in Enzymology 52, 302–310. [DOI] [PubMed] [Google Scholar]
- Chiadmi M, Navaza A, Miginiac-Maslow M, Jacquot JP, Cherfils J. 1999. Redox signalling in the chloroplast: structure of oxidized pea fructose-1,6-bisphosphate phosphatase. EMBO Journal 18, 6809–6815. [DOI] [PMC free article] [PubMed] [Google Scholar]
- Cho MH, Lim H, Shin DH, Jeon JS, Bhoo SH, Park YI, Hahn TR. 2011. Role of the plastidic glucose translocator in the export of starch degradation products from the chloroplasts in Arabidopsis thaliana. New Phytologist 190, 101–112. [DOI] [PubMed] [Google Scholar]
- Cho YH, Yoo SD. 2011. Signaling role of fructose mediated by FINS1/FBP in Arabidopsis thaliana. PLoS Genetics 7, e1001263. [DOI] [PMC free article] [PubMed] [Google Scholar]
- Cséke C, Buchanan B. 1986. Regulation of the formation and utilization of photosynthate in leaves. Biochimica et Biophysica Acta 853, 43–63. [Google Scholar]
- de Dios Barajas-Lopez J, Serrato AJ, Olmedilla A, Chueca A, Sahrawy M. 2007. Localization in roots and flowers of pea chloroplastic thioredoxin f and thioredoxin m proteins reveals new roles in nonphotosynthetic organs. Plant Physiology 145, 946–960. [DOI] [PMC free article] [PubMed] [Google Scholar]
- Driscoll SP, Prins A, Olmos E, Kunert KJ, Foyer CH. 2006. Specification of adaxial and abaxial stomata, epidermal structure and photosynthesis to CO2 enrichment in maize leaves. Journal of Experimental Botany 57, 381–390. [DOI] [PubMed] [Google Scholar]
- Fettke J, Malinova I, Albrecht T, Hejazi M, Steup M. 2011. Glucose-1-phosphate transport into protoplasts and chloroplasts from leaves of Arabidopsis. Plant Physiology 155, 1723–1734. [DOI] [PMC free article] [PubMed] [Google Scholar]
- Geigenberger P. 2011. Regulation of starch biosynthesis in response to a fluctuating environment. Plant Physiology 155, 1566–1577. [DOI] [PMC free article] [PubMed] [Google Scholar]
- Geigenberger P, Tiessen A, Meurer J. 2011. Use of non-aqueous fractionation and metabolomics to study chloroplast function in Arabidopsis. Methods in Molecular Biology 775, 135–160. [DOI] [PubMed] [Google Scholar]
- Harley P, Sharkey T. 1991. An improved model of C3 photosynthesis at high CO2: reversed O2 sensitivity explained by lack of glycerate reentry intro the chloroplast. Photosynthesis Research 27, 169–178. [DOI] [PubMed] [Google Scholar]
- Iglesias-Baena I, Barranco-Medina S, Lazaro-Payo A, Lopez-Jaramillo FJ, Sevilla F, Lazaro JJ. 2010. Characterization of plant sulfiredoxin and role of sulphinic form of 2-Cys peroxiredoxin. Journal of Experimental Botany 61, 1509–1521. [DOI] [PMC free article] [PubMed] [Google Scholar]
- Jimenez A, Hernandez JA, Del Rio LA, Sevilla F. 1997. Evidence for the presence of the ascorbate–glutathione cycle in mitochondria and peroxisomes of pea leaves. Plant Physiology 114, 275–284. [DOI] [PMC free article] [PubMed] [Google Scholar]
- Johansson E, Olsson O, Nystrom T. 2004. Progression and specificity of protein oxidation in the life cycle of Arabidopsis thaliana. Journal of Biological Chemistry 279, 22204–22208. [DOI] [PubMed] [Google Scholar]
- Kerr MW, Groves D. 1975. Purification and properties of glycolate oxidase from Pisum sativum leaves. Phytochemistry 14, 359–362. [Google Scholar]
- Kliebenstein DJ, Monde RA, Last RL. 1998. Superoxide dismutase in Arabidopsis: an eclectic enzyme family with disparate regulation and protein localization. Plant Physiology 118, 637–650. [DOI] [PMC free article] [PubMed] [Google Scholar]
- Kombrink E, Kruger NJ, Beevers H. 1984. Kinetic properties of pyrophosphate:fructose-6-phosphate phosphotransferase from germinating castor bean endosperm. Plant Physiology 74, 395–401. [DOI] [PMC free article] [PubMed] [Google Scholar]
- Koßman J, Sonnewald U, Willmitzer L. 1994. Reduction of thechloroplastic fructose-1,6-bisphosphatase in transgenic potato plants impairs photosynthesis and plant growth. The Plant Journal 6, 637–650. [Google Scholar]
- Lee SK, Jeon JS, Bornke F, et al. 2008. Loss of cytosolic fructose-1,6-bisphosphatase limits photosynthetic sucrose synthesis and causes severe growth retardations in rice (Oryza sativa). Plant, Cell and Environment 31, 1851–1863. [DOI] [PubMed] [Google Scholar]
- Lichtenthaler H, Wellburn A. 1983. Determinations of total carotenoids and chlorophylls a and b of leaf extracts in different solvents. Biochemical Society Transactions 11, 591–592. [Google Scholar]
- Livingston AK, Cruz JA, Kohzuma K, Dhingra A, Kramer DM. 2010. An Arabidopsis mutant with high cyclic electron flow around photosystem I (hcef) involving the NADPH dehydrogenase complex. The Plant Cell 22, 221–233. [DOI] [PMC free article] [PubMed] [Google Scholar]
- MacRae EA, Lunn JE. 2006. Control of sucrose biosynthesis. In: Plaxton WC, Mcmanus MT, eds, Advances in plant research: control of primary metabolism in plants , Vol. 22 Oxford: Blackwell, 234–257. [Google Scholar]
- Martins MC, Hejazi M, Fettke J, et al. 2013. Feedback inhibition of starch degradation in Arabidopsis leaves mediated by trehalose 6-phosphate. Plant Physiology 163, 1142–1163. [DOI] [PMC free article] [PubMed] [Google Scholar]
- Mittler R. 2002. Oxidative stress, antioxidants and stress tolerance. Trends in Plant Science 7, 405–410. [DOI] [PubMed] [Google Scholar]
- Nielsen TH, Stitt M. 2001. Tobacco transformants with strongly decreased expression of pyrophosphate:fructose-6-phosphate expression in the base of their young growing leaves contain much higher levels of fructose-2,6-bisphosphate but no major changes in fluxes. Planta 214, 106–116. [DOI] [PubMed] [Google Scholar]
- Obiadalla-Ali H, Fernie AR, Lytovchenko A, Kossmann J, Lloyd JR. 2004. Inhibition of chloroplastic fructose 1,6-bisphosphatase in tomato fruits leads to decreased fruit size, but only small changes in carbohydrate metabolism. Planta 219, 533–540. [DOI] [PubMed] [Google Scholar]
- Parsons R, Ogston S. 1999. Photosyn Assistant Ver. 1.1.2 . Dundee, UK: Dundee Scientific. [Google Scholar]
- Pazmiño DM, Rodriguez-Serrano M, Romero-Puertas MC, Archilla-Ruiz A, Del Rio LA, Sandalio LM. 2011. Differential response of young and adult leaves to herbicide 2,4-dichlorophenoxyacetic acid in pea plants: role of reactive oxygen species. Plant, Cell and Environment 34, 1874–1889. [DOI] [PubMed] [Google Scholar]
- Romero-Puertas M, Palma J, Gómez M, Río Ld, Sandalio L. 2002. Cadmium causes the oxidative modification of proteins in pea plants. Plant, Cell and Environment 25, 677–686. [Google Scholar]
- Sahrawy M, Avila C, Chueca A, Canovas FM, Lopez-Gorge J. 2004. Increased sucrose level and altered nitrogen metabolism in Arabidopsis thaliana transgenic plants expressing antisense chloroplastic fructose-1,6-bisphosphatase. Journal of Experimental Botany 55, 2495–2503. [DOI] [PubMed] [Google Scholar]
- Sekin S. 1978. Enzymatic determination of glucose, fructose and sucrose in tobacco. Tobacco Science 23, 75–77. [Google Scholar]
- Serrato AJ, de Dios Barajas-Lopez J, Chueca A, Sahrawy M. 2009. b . Changing sugar partitioning in FBPase-manipulated plants. Journal of Experimental Botany 60, 2923–2931. [DOI] [PubMed] [Google Scholar]
- Serrato AJ, Yubero-Serrano EM, Sandalio LM, Munoz-Blanco J, Chueca A, Caballero JL, Sahrawy M. 2009. a . cpFBPaseII, a novel redox-independent chloroplastic isoform of fructose-1,6-bisphosphatase. Plant, Cell and Environment 32, 811–827. [DOI] [PubMed] [Google Scholar]
- Sharkey T, Svitch L, Vanderveer P, Micallef B. 1992. Carbon partitioning in a Flaveria linearis mutant with reduced cytosolic fructose bisphosphatase. Plant Physiology 100, 210–215. [DOI] [PMC free article] [PubMed] [Google Scholar]
- Stitt M, Bulpin PV, ap Rees T. 1978. Pathway of starch breakdown in photosynthetic tissues of Pisum sativum. Biochimica et Biophysica Acta 544, 200–214. [DOI] [PubMed] [Google Scholar]
- Strand A, Zrenner R, Trevanion S, Stitt M, Gustafsson P, Gardestrom P. 2000. Decreased expression of two key enzymes in the sucrose biosynthesis pathway, cytosolic fructose-1,6-bisphosphatase and sucrose phosphate synthase, has remarkably different consequences for photosynthetic carbon metabolism in transgenic Arabidopsis thaliana. The Plant Journal 23, 759–770. [DOI] [PubMed] [Google Scholar]
- Thormählen I, Ruber J, von Roepenack-Lahaye E, Ehrlich SM, Massot V, Hummer C, Tezycka J, Issakidis-Bourguet E, Geigenberger P. 2013. Inactivation of thioredoxin f1 leads to decreased light activation of ADP-glucose pyrophosphorylase and altered diurnal starch turnover in leaves of Arabidopsis plants. Plant, Cell and Environment 36, 16–29. [DOI] [PubMed] [Google Scholar]
- Timm S, Florian A, Wittmiss M, Jahnke K, Hagemann M, Fernie AR, Bauwe H. 2013. Serine acts as a metabolic signal for the transcriptional control of photorespiration-related genes in Arabidopsis. Plant Physiology 162, 379–389. [DOI] [PMC free article] [PubMed] [Google Scholar]
- von Caemmerer S, Farquhar G. 1981. Some relationships between the biochemistry of photosynthesis and the gas exchange of leaves. Planta 153, 376–387. [DOI] [PubMed] [Google Scholar]
- Zheng Y, Xu M, Hou R, Shen R, Qiu S, Ouyang Z. 2013. Effects of experimental warming on stomatal traits in leaves of maize (Zea may L.). Ecology and Evolution 3, 3095–3111. [DOI] [PMC free article] [PubMed] [Google Scholar]
- Zimmermann G, Kelly GJ, Latzko E. 1976. Efficient purification and molecular properties of spinach chloroplast fructose 1,6-bisphosphatase. European Journal of Biochemistry 70, 361–367. [DOI] [PubMed] [Google Scholar]
- Zrenner R, Krause KP, Apel P, Sonnewald U. 1996. Reduction of the cytosolic fructose-1,6-bisphosphatase in transgenic potato plants limits photosynthetic sucrose biosynthesis with no impact on plant growth and tuber yield. The Plant Journal 9, 671–681. [DOI] [PubMed] [Google Scholar]
Associated Data
This section collects any data citations, data availability statements, or supplementary materials included in this article.


