

Abstract
The removal of the 5′ 7-methylguanosine mRNA cap structure (decapping) is a central step in the 5′–3′ mRNA degradation pathway and is performed by the Dcp1:Dcp2 decapping complex. The activity of this complex is tightly regulated to prevent premature degradation of the transcript. Here, we establish that the aromatic groove of the EVH1 domain of Schizosaccharomyces pombe Dcp1 can interact with proline-rich sequences in the exonuclease Xrn1, the scaffolding protein Pat1, the helicase Dhh1, and the C-terminal disordered region of Dcp2. We show that this region of Dcp1 can also recruit a previously unidentified enhancer of decapping protein (Edc1) and solved the crystal structure of the complex. NMR relaxation dispersion experiments reveal that the Dcp1 binding site can adopt multiple conformations, thus providing the plasticity that is required to accommodate different ligands. We show that the activator Edc1 makes additional contacts with the regulatory domain of Dcp2 and that an activation motif in Edc1 increases the RNA affinity of Dcp1:Dcp2. Our data support a model where Edc1 stabilizes the RNA in the active site, which results in enhanced decapping rates. In summary, we show that multiple decapping factors, including the Dcp2 C-terminal region, compete with Edc1 for Dcp1 binding. Our data thus reveal a network of interactions that can fine-tune the catalytic activity of the decapping complex.
Keywords: mRNA decapping, Dcp1:Dcp2, decapping activators, EVH1 domain, mRNA degradation, protein mobility
INTRODUCTION
Precise regulation of gene expression is essential for cellular homeostasis and depends, among other factors, directly on the levels of mRNA. These levels are determined by the rate of transcription and the rate of degradation, which must both be tightly regulated (Miller et al. 2011). mRNA degradation rates can vary by several orders of magnitude (Herrick et al. 1990) and thus have major implications on the levels of protein that are generated (Schoenberg and Maquat 2012). Two factors that provide stability to a eukaryotic mRNA are the 7-methylguanosine (m7G) cap structure at the 5′ end that protects the transcript from exonucleolytic degradation and the poly(A) tail at the 3′ end. In yeast and higher eukaryotes the bulk of the mRNA degradation is initiated by the removal of the 3′ poly(A) tail (Wilusz et al. 2001; Parker and Song 2004; Franks and Lykke-Andersen 2008). After deadenylation, the mRNA is unstable and can be degraded in one of two independent pathways. In the 3′–5′ degradation pathway, the mRNA body is processively degraded by the exosome complex (Mitchell et al. 1997; Makino et al. 2015), after which the scavenger decapping enzyme exploits a well-regulated mechanism to hydrolyze the remaining 5′ cap structure (Parker and Song 2004; Neu et al. 2015). In the 5′–3′ degradation pathway, the deadenylated 3′ end of the mRNA recruits the Lsm1-7:Pat1 complex (Tharun et al. 2000; Sharif and Conti 2013). Through intermolecular interactions this assembly then recruits the Dcp1:Dcp2 decapping complex to the 5′ end of the mRNA (Bouveret et al. 2000; Tharun et al. 2000) to hydrolyze the 5′ protecting cap structure. Subsequently, the body of the mRNA transcript is subjected to rapid degradation by the Xrn1 exonuclease. mRNA decapping by the Dcp1:Dcp2 enzyme complex is a fate determining step in the mRNA life cycle as this results in the irreversible degradation of the transcript and efficiently prevents eIF4E-mediated translation initiation (Franks and Lykke-Andersen 2008).
The Dcp1:Dcp2 decapping complex localizes to cellular foci that are referred to as processing bodies (Ingelfinger et al. 2002; van Dijk et al. 2002). These foci contain many proteins that are involved in the 5′–3′ mRNA degradation pathways, including the Lsm 1–7 complex, Pat1, the DEAD box helicase Dhh1 (Ste13 in S. pombe, DDX6 in human, Me31B in D. melanogaster) and the exonuclease Xrn1 (Exo2 in S. pombe) (Franks and Lykke-Andersen 2008). The clustering of these factors into processing bodies is a result of a cellular phase transition process (Mitrea and Kriwacki 2016) that is induced by a large and redundant network of intermolecular interactions that can be reconstituted in vitro from purified proteins (Fromm et al. 2014). Currently, only a part of the interaction network that is important for the formation of processing bodies has been revealed, and future studies are likely to identify many weak and transient interactions that modulate the cellular localization of proteins that are involved in 5′–3′ mRNA degradation.
The Dcp2 protein in the Dcp1:Dcp2 decapping complex contains the catalytic site that removes the 5′ cap structure from the mRNA (Fig. 1A; van Dijk et al. 2002; Wang et al. 2002). The Dcp1 protein is regarded as the prime decapping activator as it tightly interacts with Dcp2 and enhances its activity (Beelman et al. 1996). Due to the central nature of the mRNA decapping reaction, the activity of the Dcp1:Dcp2 decapping complex needs to be tightly regulated and multiple factors have been identified that influence turnover rates. These factors include Edc3 (enhancer of decapping 3) (Kshirsagar and Parker 2004) that binds to a conserved region in the C-terminal disordered region of Dcp2 (Harigaya et al. 2010; Fromm et al. 2012), the Lsm1-7:Pat1 complex (Bouveret et al. 2000; Tharun et al. 2000) and the RNA DEAD box helicase Dhh1 (Coller et al. 2001; Fischer and Weis 2002). In addition, in Saccharomyces cerevisiae the two intrinsically disordered decapping enhancers Edc1 and Edc2, which show limited sequence conservation with human PNRC2, have been identified (Dunckley et al. 2001; Lai et al. 2012). Importantly, for Edc3 (Harigaya et al. 2010; Nissan et al. 2010; Fromm et al. 2012), Pat1 (Nissan et al. 2010), Edc1 and Edc2 (Schwartz et al. 2003; Steiger et al. 2003; Borja et al. 2011), and PNRC2 (Lai et al. 2012), the activation of the decapping activity has been shown in in vitro, indicating that these proteins directly regulate catalytic activity.
FIGURE 1.

(A) Schematic representation of the proteins used in this study. (B) 1H-15N NMR spectrum of the S. pombe Dcp1:Dcp2RD in the absence (black) and presence (red) of Xrn1 (1201–1328). CSPs report on the interaction between Xrn1 and Dcp1:Dcp2. (C) CSPs that Xrn1 induces in the decapping complex mapped on the structure of the complex (2QKM). Affected residues are colored red, unaffected residues white, and unassigned residues gray. The black oval indicates the aromatic groove in Dcp1. (D) CSPs induced in the decapping complex upon interaction with Xrn1 (1224–1257), Pat1 (159–226), Dhh1 (401–419), and the C-terminal region of Dcp2 (269–312). The spectral region shown corresponds to the boxed area in B. (E) NMR titration experiments that quantify the interaction strength between the Dcp1:Dcp2RD decapping complex and Xrn1 (top, residues 1224–1257) or the Dcp2 C-terminal region (bottom, residues 269–312). The extracted affinity between the Xrn1 PRS and Dcp1 is based on 17 Dcp1 resonances that experience significant CSPs. The extracted affinity between the Dcp2 PRS and Dcp1 is based on nine Dcp1 resonances that experience significant CSPs. (F) 1H-15N NMR spectrum of the Dcp1:Dcp2RD in the absence (black) and presence (red) of S. pombe Edc1 (144–181). Note that the number of CSPs is larger than observed for the interaction between the decapping complex and Xrn1 (see B), indicating a larger binding interface. (G) CSPs induced by the Edc1 interaction with Dcp1:Dcp2 plotted on the structure of the decapping complex. Note the CSPs that we observed in the regulatory domain of Dcp2.
The Dcp2 protein contains two folded domains, an N-terminal all helical regulatory domain (RD) that is followed by the catalytic domain (CD) harboring a classical Nudix fold (Fig. 1A; She et al. 2006). The catalytic domain contains the active site and an interaction groove for the RNA body (Deshmukh et al. 2008). The N-terminal domain serves two purposes: First, it enhances the activity of the catalytic domain by recognizing part of the mRNA cap structure (Floor et al. 2010), and secondly, it directly interacts with the decapping activator Dcp1 (She et al. 2008). Structures of the Dcp1:Dcp2 decapping complex show that the enzyme can adopt open and closed conformations, where the angle between the regulatory and catalytic domains can vary significantly (She et al. 2008). These conformational changes have been implicated in the regulation of catalytic activity, where the closed conformation is thought to be catalytically more active (Floor et al. 2008, 2012; She et al. 2008).
The Dcp1 protein adopts an EVH1 fold that displays a conserved aromatic groove (She et al. 2004). In the Dcp1:Dcp2 complex (She et al. 2008), this groove faces away from the Dcp2 protein and is thus accessible for the interaction with decapping factors. In most EVH1 domains, this surface is involved in interactions with proline-rich sequences (PRS), as shown for the EVH1 domains of Mena, Homer, and N-WASP (Prehoda et al. 1999; Beneken et al. 2000; Volkman et al. 2002). The aromatic groove of Dcp1 is also able to recruit PRS, including those found in the nuclear receptor coactivator PRNC2 (Lai et al. 2012), the exonuclease Xrn1 (Braun et al. 2012), and the enhancers of decapping Edc1 and Edc2 (Borja et al. 2011). In vivo, mutations in the PRS binding region of Dcp1 result in a strong loss of function, whereas these mutations have no effect on the efficiency of the isolated decapping in vitro (Tharun and Parker 1999). This suggests that the PRS binding site in Dcp1 is a prime site for the interaction of the decapping complex with additional factors that regulate catalytic activity or that target the decapping complex to the correct cellular locus. Because PRS are located in intrinsically disordered regions (IDRs) that are not highly conserved, it is challenging to predict additional Dcp1 binding partners.
Here, we set out to identify proteins that directly interact with the aromatic groove of the Dcp1 decapping activator. To that end, we search for proline-rich IDRs in proteins that are known to be involved in mRNA turnover and that have been shown to localize to processing bodies. In our analysis, we focus on proteins from S. pombe, as we are able to record high-resolution NMR spectra of the Dcp1:Dcp2 decapping complex from this organism, which allows us to identify and localize intermolecular interactions with very high sensitivity.
In brief, we find that the proteins Pat1, Dhh1, and Xrn1 all contain PRS that directly interact with Dcp1 in the mRNA decapping complex. Interestingly, also multiple PRS in the C-terminal disordered region of Dcp2 are able to fold back onto Dcp1, thereby inducing a loop in the Dcp1:Dcp2 complex. Based on limited sequence data that is available for decapping activators, we identified a previously unannotated ORF in S. pombe as an enhancer of decapping (that we termed Edc1). We show that this protein binds directly to Dcp1, which results in an increase of the catalytic activity. Based on a crystal structure, NMR titration studies, RNA decapping assays, and binding experiments we propose a mechanism by which Edc1 functions in decapping. In sum, our data show that multiple proteins are able to interact with a single site in Dcp1, which allows for fine-tuning of the activity of the mRNA decapping complex.
RESULTS
Multiple proteins interact with the Dcp1 aromatic groove
Dcp1 contains an EVH1 domain that is known to interact with proline-rich sequences (PRS) through an aromatic groove. To identify potential binding partners for the S. pombe Dcp1 protein, we used the MPI Bioinformatics Toolkit (Biegert et al. 2006) and searched for PRS in proteins that are known to be present in processing bodies. We identified these in intrinsically disordered regions (IDRs) in the C-terminal part of Xrn1 (residues 1201–1328; Exo2 in S. pombe), the N-terminal part of Pat1 (residues 1–280), in the C-terminal part of Dhh1 (residues 401–480), and in the C-terminal part of Dcp2 (residues 265–350) (Fig. 1A).
We then used NMR spectroscopy to probe for direct interactions between these IDRs and the aromatic groove of Dcp1. NMR spectroscopy is unique as it is able to identify intermolecular interactions with exquisite sensitivity. Based on an almost complete backbone assignment that we obtained for the Dcp1:Dcp2RD decapping complex (that only contains the regulatory domain [RD] of Dcp2), we are able to detect binding on a per residue basis.
First, we probed for the interaction between the C-terminal residues of the exonuclease Xrn1 and Dcp1. To that end, we used NMR titration experiments where we added the Xrn1 C-terminal region to the 15N-labeled decapping complex (Fig. 1B). We observed a large number of chemical shift perturbations (CSPs) in resonances from Dcp1, which unambiguously shows that S. pombe Xrn1 and mRNA decapping complex interact directly. To identify which residues in the Xrn1 C-terminal region are responsible for this interaction, we systematically truncated the IDR from both the N- and C-terminal end (Supplemental Fig. S1). In total we tested nine different versions of Xrn1 and identified a 33 amino acid fragment that interacts with Dcp1 to a similar extent as the complete C-terminal region does. Interestingly, this fragment is highly enriched in proline residues and reasonably well conserved among Schizosaccharomyces species (Supplemental Fig. S1). Importantly, a mapping of the CSP on the Dcp1:Dcp2RD structure shows that Xrn1 binds to the aromatic groove of Dcp1 (Fig. 1C). A similar interaction between a peptide derived from Xrn1 and the aromatic groove of Dcp1 was previously observed in D. melanogaster (Braun et al. 2012). There, the PRS in Xrn1 binds in an extended conformation, whereas the region that immediately follows the PRS adopts an α-helical fold (Supplemental Fig. S1). Interestingly, the region that follows the PRS in S. pombe Xrn1 has a high helical propensity, which strongly suggests that the Dcp1:Xrn1 interaction is structurally similar in S. pombe and D. melanogaster. Thus, the interaction between Xrn1 and Dcp1 is conserved, which was previously thought not to be the case as the Xrn1 C-terminal region is not well conserved (Braun et al. 2012). In light of our NMR data the Dcp1 interacting residues from D. melanogaster and S. pombe can, however, be aligned reasonably well (Supplemental Fig. S1).
Secondly, we probed for the interaction between the mRNA decapping complex and Pat1 (Fig. 1A). In those experiments we establish that the N-terminal 280 residues of Pat1 interact with the same region in Dcp1 as Xrn1 does (Fig. 1D; Supplemental Fig. S2). To identify the Pat1 residues that interact with Dcp1, we used nine different Pat1 fragments and probed for their ability to interact with Dcp1. We find that the region between residues 159 and 226 is sufficient for binding to Dcp1 (Supplemental Fig. S2). As for Xrn1, this part of Pat1 contains a PRS followed by a sequence that is predicted to be α-helical. Based on that, we conclude that Pat1 and Xrn1 bind Dcp1 in a highly similar fashion.
Thirdly, we tested the interaction between the DEAD box helicase Dhh1 (Ste13) (Fig. 1A; Supplemental Fig. S3) and the decapping complex. The IDR in the C-terminal part of Dhh1 displays significant sequence conservation, even between yeast and higher eukaryotes. In NMR titration experiments, we observed clear CPSs in the aromatic groove of Dcp1 (Fig. 1; Supplemental Fig. S3). We conclude that Dhh1 interacts with Dcp1 similar to Xrn1 and Pat1.
Finally, we assessed whether the C-terminal region of Dcp2, that contains multiple PRS (Fig. 1A; Supplemental Fig. S4) is able to interact with Dcp1. To that end, we titrated this Dcp2 IDR to the decapping complex and found that the Dcp2 C-terminal region interacts with the Dcp1 aromatic groove in trans (Fig. 1D). To narrow down which residues in the Dcp2 C-terminal region are responsible for this interaction, we probed the binding of shorter fragments. In these experiments, we detected a gradual decrease in the interaction strength. This suggests that the C-terminal region of Dcp2 contains multiple independent Dcp1 binding sites. To confirm this observation, we titrated Dcp1 to the NMR active C-terminal region of Dcp2 and indeed found multiple Dcp1 docking sites (Supplemental Fig. S5). In solution, these sites compete with each other for Dcp1 binding, which is visible as significant line broadening of Dcp1 resonances in the titration experiments with the longest Dcp2 fragments (Supplemental Fig. S4). Importantly, the interaction between the Dcp2 C-terminal region and Dcp1 can also take place in cis in solution (Supplemental Fig. S6), which results in the formation of a closed loop conformation within the decapping complex.
PRS interact with Dcp1 with µM affinity
Next, we determined the interaction strength between the decapping complex and the PRS that we identified in Xrn1 and the Dcp2 C terminus. To that end, we performed NMR titration experiments, where we added the ligands in a stepwise manner to the NMR active decapping complex. In brief, we found that Xrn1 and the Dcp2 C-terminal region interact with the aromatic groove in Dcp1 in fast exchange with affinities of 640 (±170) µM and 310 (±110) µM, respectively (Fig. 1E). These affinities are close to the 1–500 µM range that is expected for the interaction between EVH1 domains and PRS (Ball et al. 2002).
In summary, we conclude that Dcp1 is a platform for the interaction with multiple proteins, including Xrn1, Pat1, Dhh1, and Dcp2. These proteins use PRS to interact in a similar and thus competitive manner with the Dcp1 aromatic groove.
Identification of the enhancer of decapping protein in S. pombe
The S. cerevisiae proteins Edc1 and Edc2 (Borja et al. 2011) and the human protein PRNC2 (Lai et al. 2012) interact with the aromatic groove of Dcp1 and thereby enhance the catalytic activity of the decapping enzyme. These proteins have no global sequence conservation and similar decapping activators have not been found in other organisms so far. Edc1, Edc2, and PRNC2 contain a PRS and we used the sequence information of this region, together with the PRS information we obtained for Xrn1, Pat1, Dhh1, and Dcp2 (see above) to search for an activator of the mRNA decapping complex in the S. pombe genome. Based on multiple rounds of pattern and BLAST (Altschul et al. 1990) searches, we found that the S. pombe protein SPAC18G6.09c locally aligns well with the three known decapping activators (Fig. 2A). Interestingly, this region is highly conserved among different Schizosaccharomyces species (Supplemental Fig. S7), suggesting functional importance. We therefore termed this previously unannotated ORF in S. pombe Edc1 (see below). Edc1 lacks structural domains; however, in addition to the conserved region that we identified above, it displays a highly positive N-terminal region and a conserved HLM-like region (Fromm et al. 2012, 2014) in the C terminus that could interact with the Edc3 LSm domain. This feature highlights the complexity and redundancy of the interaction network between mRNA decapping factors.
FIGURE 2.

(A) Sequence alignment of the known activators of decapping Edc1, Edc2, and PRNC2 with Edc1 from S. pombe that we identified here. (B) Crystal structure of the Dcp1:Edc1 complex. Important interactions between Edc1 and Dcp1 are indicated. Dcp1 is colored blue and Edc1 is colored yellow. (C) Residues in Dcp1 that sample multiple conformations in the absence of binding partners are indicated with red spheres. Note that the exchange process is restricted to the Dcp1 aromatic groove that is the binding site for Xrn1, Pat1, Dhh1, the Dcp2 C terminus, and Edc1. (D) Exemplary CPMG dispersion profiles in Dcp1 in the absence (red) and in the presence (blue) of Xrn1. The interaction between Xrn1 and Dcp1 results in a quenching of the observed motions.
Based on NMR titration experiments, the Edc homolog interacts strongly with the Dcp1:Dcp2 mRNA decapping complex (Fig. 1F) and we observe that the Dcp1 aromatic groove experiences significant CSPs (Fig. 1G). Like for the PRS in Xrn1, Pat1, Dhh1, and Dcp2, this surface thus plays an important role in the intermolecular interaction. Interestingly, we observe additional CSPs in Dcp2 (Fig. 1G), which shows that Edc1 uses a larger binding interface to interact with the decapping complex than the other ligands we identified here. In line with this finding, binding of Edc1 takes place in slow exchange on the NMR-timescale, indicative of the formation of a stable complex.
Structure of the complex of Edc1 and Dcp1
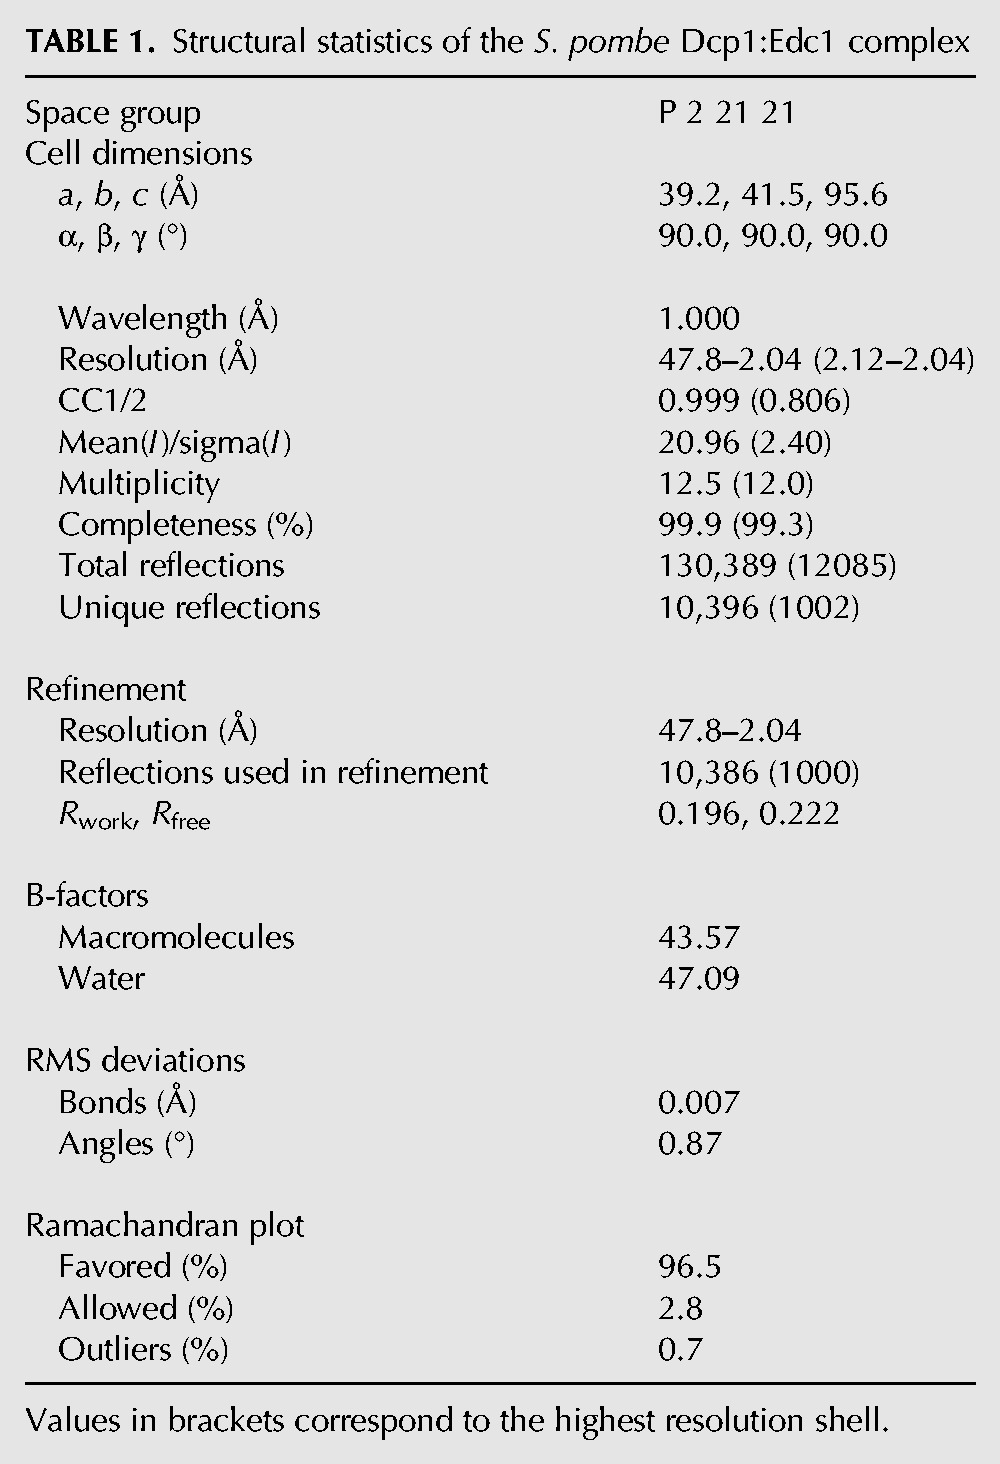
In the next step, we solved the crystal structure of the Dcp1:Edc1 (Edc1 residues 144–181) complex to a resolution of 2.0 Å (Table 1; Fig. 2B; Supplemental Fig. S8), where only residues 165–179 of Edc1 are visible in the electron density. The interaction between Edc1 and the Dcp1 aromatic groove is mainly mediated through hydrophobic interactions and hydrogen bonds. In the N-terminal end of the Edc1 PRS, S166Edc1 and P167Edc1 form three hydrogen bonds to K47Dcp1. P167Edc1 also interacts via hydrophobic contacts with W107Dcp1 and the carbonyl group of P167Edc1 forms a hydrogen bond with the hydroxyl group of Y36Dcp1. The highly conserved L172Edc1 is deeply inserted into the Dcp1 aromatic cage formed by W45, Y36, and Y93. P173Edc1 makes van der Waals contacts with V90Dcp1 and uses the carbonyl group to form a hydrogen bond with the side chain of W45Dcp1. P175Edc1 stacks onto F38, W45 and V103 of Dcp1. Finally, in the C-terminal part of Edc1, F177Edc1 stacks on the side chain of Q101Dcp1. In addition, the conformation of the peptide is stabilized by backbone hydrogen bonds that result in the formation of a 310 helix between residues 168 and 172. Within the Edc1 protein the residues 167–168, 172–173, and 175 adopt a polyproline II conformation according to PROSS (Srinivasan and Rose 1999). It should be noted that we observe density of four residues from the N terminus of the Edc1 construct (including two residues that were introduced into Edc1 by the cloning procedure) close to C-terminal residues of Edc1. This part of Edc1 belongs to an Edc1:Dcp1 complex in a symmetry related molecule and is likely a crystallization artifact (Supplemental Fig. S8).
TABLE 1.
Structural statistics of the S. pombe Dcp1:Edc1 complex
In general, the interaction between Edc1 and Dcp1 is highly reminiscent of the interaction between PRNC2 and Dcp1 (Supplemental Fig. S9A, top), despite significant differences in the exact intermolecular contacts. Especially the backbone between residues 166 and 175 (Edc1) superimposes remarkably well onto PNRC2 bound to Dcp1. The recognition of Edc1 by the Dcp1 EVH1 domain is reminiscent of the interactions that are observed between PRS and, e.g., WW, SH3, and GYF domains. In all cases, the central motif in the PRS contacts a surface exposed cluster of aromatic residues in the protein domain. Additional contacts between residues that flank this PRS then provide the required specificity (Ball et al. 2005).
Edc1 and Xrn1 adopt different conformations in complex with Dcp1
Above we showed that PRNC2 and Edc1 are structured very similarly when in complex with Dcp1. Xrn1, on the other hand, adopts a significantly different conformation when bound to Dcp1 (Supplemental Fig. S9A, bottom). These differences correlate with the rather diverse Dcp1 interacting sequences of Edc1 and Xrn1. The fact that both proteins are able to specifically interact with Dcp1 requires a high degree of plasticity in the Dcp1 aromatic groove.
The Dcp1 aromatic groove is mobile
To assess if the Dcp1 aromatic groove is flexible and thereby able to interact with different proteins in a divergent manner, we conducted NMR CPMG relaxation dispersion experiments. These experiments are sensitive to protein motions on the millisecond timescale and allow the determination of the underlying kinetic parameters. Interestingly, residues in the aromatic groove of Dcp1 sample at least two structurally different states (Fig. 2C) with interconversion rates between 1100 and 1450 Hz (Fig. 2D). This shows that the interaction site for Xrn1, Pat1, Dhh1, the Dcp2 C-terminal PRS and Edc1 is highly plastic in solution. To assess if these motions are directly related to the recognition of the binding partners, we measured the same NMR relaxation dispersion experiments in the presence of the Xrn1 fragment (Fig. 2D). Interestingly, the motions are suppressed upon formation of the Dcp1:Xrn1 complex (Fig. 2D), which provides a link between the Dcp1 conformational exchange and the interaction with ligands. Our data thus support a model where the binding of a protein in the Dcp1 aromatic groove results in the selection of a single structural state from a dynamic ensemble of Dcp1 conformations.
Edc1 activates the decapping complex
To assess whether the Edc1 homolog that we identified acts as an enhancer of decapping, we performed RNA decapping assays. In these experiments we mixed a 21mer RNA that harbors a 5′ m7G cap structure with the Dcp1:Dcp2 decapping complex. Samples from the reaction were taken at different time-points and analyzed using an anion exchange HPLC method that allows the separation and accurate quantification of capped and uncapped 21mer RNA (Supplemental Fig. S10). It is important to note that our degradation experiments are performed under conditions where the RNA is in excess of the enzyme (multiple turnover) and that the enzyme is fully saturated with substrate at all times. To ensure that we extract accurate turnover rates, we only sampled the linear regime, where the reaction is not slowed down by the accumulating product or by the reduction in the substrate concentrations (Fig. 3A). Based on this method, the kcat of the apo Dcp1:Dcp2 decapping complex is 7.6 (±0.6) min−1 (Fig. 3A).
FIGURE 3.

(A) RNA decapping experiments using a different version of S. pombe Edc1. The extracted turnover rates are indicated. (B) Relative decapping rates (see also A and D) indicate that Edc1 increases the decapping rates by a factor of 3.7. (C) Relative decapping rates for the S. cerevisiae decapping complex in the presence of increasing amounts of ScEdc1. Addition of saturating amounts of Edc1 results in a 3.4-fold increase in the turnover rates. (D) Decapping experiments using the S. pombe enzyme in the presence of Xrn1 or the Dcp2 C-terminal region show that these proteins have no effect on the in vitro decapping activity (see also B).
To assess the effect of Edc1 on the decapping rate, we added saturating amounts of Edc1 (residues 1–221) to the enzyme and observed an increased turnover rate of 27.8 (±3.3) min−1, which corresponds to an enhancement by a factor of 3.7 (Fig. 3B). Interestingly, a shorter version of Edc1 that only encompasses residues 144–215 had exactly the same effect on the decapping activity. This shows that the “active” region of Edc1 is restricted to a relatively short sequence that is included in the structure of the Dcp1:Edc1 complex that we solved (Fig. 2A,B). A similar observation has been made for Edc1 and Edc2 from S. cerevisiae, where 30 residues are sufficient to enhance decapping (Borja et al. 2011).
The activation of the S. cerevisiae decapping complex by Edc1 requires the activation motif (HSYAG) (Fig. 2A) that is located N-terminal of the Dcp1 binding site (Borja et al. 2011). To assess the importance of the YAG motif in the S. pombe Edc1 protein, we mutated these amino acids to serine residues (we refer to this triple mutant as ΔYAG). We observed that this mutant lost the ability to activate the decapping complex, which underscores similarities to Edc1 and Edc2 from S. cerevisiae (Fig. 3A,B). The conservation of the mechanism of Edc1 is further highlighted by the very similar levels of activation that we observed for S. pombe (3.7-fold; Fig. 3B) and S. cerevisiae (3.4-fold; Fig. 3C). Interestingly, the YAG activation motif is also present in the human decapping activator PNRC2 (Lai et al. 2012), which hints at a general mechanism by which the Dcp1:Dcp2 decapping complex can be activated.
Xrn1 and the Dcp2 PRS have no influence on decapping activity
As opposed to Edc1, the PRS of Xrn1, Pat1, Dhh1 and those of the Dcp2 C-terminal region are not preceded by a YAG motif (Supplemental Figs. S1–S4). This suggests that these proteins are not able to enhance the activity of the decapping enzyme. To test that hypothesis, we performed decapping assays in the presence of high molar excess of either the Xrn1 or Dcp2 C-terminal peptide. In these in vitro experiments we found that the turnover rates are not affected by the interaction of these proteins with the Dcp1 aromatic groove (Fig. 3B,D).
Edc1 interacts with Dcp1 and the regulatory domain of Dcp2
In our NMR Edc1 titration experiments (Fig. 1F,G) we noticed that a number of resonances of the Dcp2 regulatory domain experience CSPs. This indicates that residues in Edc1 that are N-terminal of H165 (Fig. 2B) interact with the Dcp2 regulatory domain. To confirm that, we performed fluorescence anisotropy experiments to quantify the binding between Edc1 and the decapping complex. For the Dcp1 protein alone, we determined a dissociation constant (KD) of 840 (±280) nM (Fig. 4A). For the Dcp1:Dcp2RD decapping the affinity improved significantly (KD = 143 [±9] nM) (Fig. 4B), confirming the involvement of the Dcp2 regulatory domain in the interaction with Edc1. Interestingly, the interaction between Edc1 and the decapping complex did not improve further upon inclusion of the Dcp2 catalytic domain (KD = 250 [±43] nM) (Fig. 4C). This suggests that Edc1 makes no extensive contacts with the catalytic domain in the absence of RNA.
FIGURE 4.

Fluorescence anisotropy measurements to extract the KD for the interaction between Dcp1 and Edc1 (A), Dcp1:Dcp2RD and Edc1 (B), and Dcp1:Dcp2RD+CD and Edc1 (C). The interaction between Edc1 and the decapping complex appears to be mediated through contacts with Dcp1 and the regulatory domain of Dcp2. (D) Fluorescence anisotropy competition experiments. The truncation of Edc1 and the removal of the YAG motif have no influence on the interaction between the activator and the enzyme. (E) Fluorescence anisotropy measurements to extract the affinity between capped RNA and different version of the Edc1:Dcp1:Dcp2RD + CD. The YAG motif in Edc1 appears to play an important role in the recognition of the capped RNA.
To shed light on the importance of the YAG activation motif for the interaction between Edc1 and the decapping complex, we performed competition experiments. In those experiments, we titrated labeled Edc1 (1–221) with Dcp1:Dcp2RD + CD in the presence of unlabeled Edc1 (144–215) or unlabeled Edc1 (144–215) ΔYAG. From the binding curves we extracted similar KDs for the two shortened Edc1 constructs (KD = 415 [±62] nM and KD = 430 [±61] nM, respectively) which bind with only slightly reduced affinity compared to the longer Edc1 (1–221) construct (KD = 250 [±43] nM) (Fig. 4D). These data show that the YAG motif is not involved in direct interactions between the Edc1 activator and the decapping complex.
Edc1 YAG motif increases the RNA affinity of the Dcp1:Dcp2 complex
To address if Edc1 makes extensive contacts with the RNA, we performed RNA binding experiments. To that end, we used a capped and fluorescently labeled RNA (Fuchs et al. 2016), to which we added increasing amounts of Dcp1:Dcp2RD + CD. We performed those experiments in the absence of Edc1 and in the presence of saturating amounts of Edc1 or Edc1 ΔYAG (Fig. 4E). From that, we determined that the capped RNA interacts with the Dcp1:Dcp2 decapping complex with a dissociation constant of 78 (±12) nM. Inclusion of Edc1 ΔYAG only had a minor effect (KD = 51 [±9] nM) on this interaction; however, inclusion of Edc1 that contains the YAG motif improved the interaction significantly (KD = 14 [±2] nM) (Fig. 4E). Our data thus suggest that the YAG activation motif in Edc1 contacts the capped RNA directly, although an allosteric effect cannot be ruled out at this point.
DISCUSSION
The Dcp1:Dcp2 decapping complex plays a central role in the turnover of mRNA. Here, we show that Dcp1 is a versatile binding platform for multiple proteins that play a role in mRNA metabolism, including Xrn1, Pat1, Dhh1, the C-terminal region of Dcp2 and an enhancer of decapping protein (Edc1) that we identified in S. pombe (Figs. 1, 2A,B, 5). Using NMR relaxation dispersion experiments (Fig. 2C,D) we show that the aromatic groove of Dcp1 is highly dynamic. These motions likely provide the flexibility required to facilitate interactions with the different binding partners.
FIGURE 5.

Cartoon representation of the Dcp1:Dcp2 decapping complex and the interactions with Xrn1, Pat1, or Dhh1 (A), the Dcp2 C-terminal region (B), and Edc1 and substrate RNA (C). The EVH1 fold in the Dcp1 protein is colored yellow, the Dcp2 regulatory domain light green, and the Dcp2 catalytic domain dark green. (A) The adapter proteins Xrn1, Pat1, and Dhh1 can be recruited by Dcp1. (B) The C-terminal region of Dcp2 contains multiple PRS that interact with Dcp1 in a structurally similar manner as the adapter proteins do. (C) The activator protein Edc1 interacts with Dcp1 and the regulatory domain of Dcp2. Edc1 increases the binding affinity for capped RNA, suggesting that Edc1 contacts the substrate. The interactions displayed in A and B compete with the recruitment of the activator Edc1 or PNRC2 to the decapping complex.
Based on our current structural knowledge (Fig. 2B), the proteins that interact with the Dcp1 aromatic groove can be divided into two groups. The first group contains the proteins Xrn1, Pat1, Dhh1 and the C-terminal proline-rich region of Dcp2 (Fig. 5A,B; Supplemental Figs. S1–S4). These proteins share PRS that are followed by a region that has helical propensity (Supplemental Fig. S9B) and their interaction with the decapping complex has no direct effect on the catalytic activity of the enzyme (Fig. 3D). The second group of proteins that interacts with Dcp1 comprises the S. cerevisiae proteins Edc1 and Edc2, the S. pombe Edc1 protein and the nuclear receptor coactivator PNRC2 (Figs. 2A, 5C). These proteins act using a YAG activation motif that is 11–13 residues N-terminal of a conserved LPxP Dcp1 interaction motif (Fig. 2A; Supplemental Fig. S7).
Based on our binding data, Edc1 not only interacts with Dcp1 but also makes contacts with the Dcp2 regulatory domain (Figs. 1G, 4B, 5C) and likely with the RNA substrate (Fig. 4E, 5C). The Edc1 YAG motif enhances the affinity between the decapping complex and the RNA significantly, whereas this motif does not play a role in the interaction between the Edc1 and the enzyme itself (Fig. 4D). This provides the first insight into a structural model by which the Dcp1:Dcp2 decapping complex, Edc1 and RNA substrate come together (Fig. 5C).
Future studies will need to address the exact mechanism that results in the stimulation of the decapping activity by Edc1. Here, we show that Edc1 improves the affinity between the RNA substrate and the enzyme complex (Fig. 4E). However, this extra affinity cannot explain the observed enhancement of the catalytic activity (Fig. 3A,B), because in our assays the capped RNA concentration (20 µM) is such that Dcp1:Dcp2 (100 nM) is always fully saturated with substrate (RNA:enzyme KD ≤ 75 nM; Fig. 4E), independent of the presence of Edc1. The Edc1 induced enhancement of the catalytic activity of the decapping complex must thus have another origin. For S. cerevisiae complex it was suggested that the Edc1 induced enhancement of the catalytic activity is due to Dcp2 domain closure or due to changes in the chemical steps (Borja et al. 2011). An Edc1 induced closing of the decapping complex through direct interactions between Edc1 and the catalytic domain of Dcp2 seems unlikely as, based on our binding data, the Dcp2 catalytic domain does not directly participate in the interaction with Edc1 (Fig. 4B,C). As Edc1 contacts the RNA substrate (Fig. 4E), it suggests that the YAG motif in Edc1 stabilizes the mRNA substrate in an orientation that favors catalytic turnover (Fig. 5C).
We show that the PRS of Xrn1 and the Dcp2 C-terminal region have no direct effect on the catalytic activity of the decapping complex (Fig. 3D). Nevertheless, Xrn1, Pat1, Dhh1, and the PRS in Dcp2 can modulate the activity of the enzyme indirectly as these proteins compete with the recruitment of Edc1 (Fig. 5), which results in a down-regulation of decapping activity (Fig. 3A,D). It should be noted that the affinity between the individual PRS and the Dcp1 EVH1 domain is low compared to the affinity between Edc1 and Dcp1. Competition is nevertheless possible as the local concentrations of Xrn1, Pat1, and Dhh1 are very high in processing bodies and as the EVH1:PRS affinity will be enhanced by avidity effects that arise due to the presence of multiple PRS within the IDRs and due to additional interactions between the decapping factors and the decapping machinery. In line with that, it was recently shown that the in vivo activity of the S. cerevisiae Dcp1:Dcp2 decapping enzyme increases in a gradual manner upon a stepwise shortening of the C-terminal tail of Dcp2 (He and Jacobson 2015). Here, we show that the Dcp2 C-terminal tail contains a number of PRS that can interact in cis with the Dcp1 aromatic groove. This Dcp2:Dcp1 interaction can interfere with the recruitment of Edc1 and removal of the PRS from Dcp2 could thus result in a more efficient recruitment of Edc1 and thereby an increase in catalytic activity.
In summary, our data reveal a complex network of intermolecular interactions that is able to regulate the Dcp1:Dcp2 mRNA decapping complex. Future studies are required to shed light on how these interactions regulate decapping activity in a cellular setting and how they are affected by the recruitment of the decapping complex to processing bodies.
MATERIALS AND METHODS
Protein expression and purification
Genes coding for S. pombe Dcp1:2 (Dcp2 residues 1–95, 1–243, or 1–312) and S. cerevisiae Dcp1:2 (Dcp2 residues 1–430) were cloned into a modified pET vector for coexpression of the complex with a N-terminal TEV-cleavable 6-His-Tag on Dcp1. Genes coding for the respective Pat1, Exo2, Ste13, Dcp2, and Edc1 fragments from S. pombe were cloned into a modified pET vector that contains a N-terminal TEV-cleavable 6-His-GB1-tag or an N-terminal 6-His-tag. The plasmids coding for the S. cerevisiae Edc1 protein was a generous gift from J. Gross (UCSF) (Borja et al. 2011). Plasmids were transformed into E. coli BL21(DE) codon plus cells, which were grown at 37°C in LB medium until an OD600 of 0.8. Protein expression was induced by addition of 1 mM IPTG and cells were shifted to 22°C and harvested 10–20 h later. Cell pellets were resuspended in 400 mM NaCl, 10 mM imidazole, 50 mM NaHPO4, pH 7.4, 0.1% Triton X-100, 1 mg/mL lysozyme, 0.2 U/mL DNase I and cells were lysed by sonification. The cell lysate was cleared by centrifugation and applied to NiNTA resin equilibrated in buffer A (400 mM NaCl, 10 mM imidazole, 50 mM NaHPO4, pH 7.4). The resin was washed with buffer A (containing 20 mM Imidazole for the Dcp1:2 constructs, an additional washing step with 1 M NaCl, 25 mM NaHPO4, pH 7.4 was used for S. pombe Edc1 1–221 and S. cerevisiae Edc1 to remove bound nucleic acids) and proteins were eluted with buffer B (150 mM NaCl, 300 mM imidazole, 50 mM NaHPO4, pH 7.4). To remove the affinity tag, proteins were digested with TEV protease overnight at 4°C during dialysis against 150 mM NaCl, 25 mM NaHPO4, pH 7.4, 1 mM DTT. The solution was passed over a second NiNTA column, flow through and wash (with buffer A) were combined and the proteins were further purified by gel filtration using a 16/600 Superdex 75 column (GF-buffer: 125 mM NaCl, 25 mM HEPES, pH 7.3, 1 mM DTT). TEV-cleavage and second NiNTA column were omitted for most GB1 fusion constructs, as the peptides were not stable in the absence of GB1.
For fluorescent labeling of S. pombe Edc1 1–221, a S183C mutation was introduced and the protein was purified as described above (including the TEV-cleavage step). After gel filtration the protein was exchanged into GF-buffer without DTT using a PD10 Minitrap G25 desalting column, and a 25-fold excess of 5-(iodoacetamido)-fluorescein was added to a 20 µM protein solution. After 1 h incubation at room temperature in the dark, a second desalting column in DTT free GF-buffer was used to remove excess label. Labeling efficiency was estimated to be ∼50% using the absorption ratio at 280/490 nm. A correction factor of 0.3 for the fluorescein absorption at 280 nm was used for the calculation.
An exemplary SDS PAGE analysis of the purified proteins used in this study is shown in Supplemental Figure S11.
RNA preparation
For decapping assays a 21mer RNA with the sequence 5′-GGAAGGAGAGGAAGGAAAGGA-3′ was produced by T7 in vitro transcription from linearized plasmid DNA using standard protocols and was followed by a self-cleaving HDV ribozyme to ensure 3′ end homogeneity. A 30mer RNA with the sequence 5′-GGAGGAGAGGAAGGUAAGGGAAGAAAGAAG-3′ was transcribed from a synthetic DNA primer with double stranded T7 promoter sequence in the absence of CTP and in the presence of 4-thiouridine triphosphate instead of UTP. Both RNAs were purified by denaturing anion exchange chromatography using a DNAPac PA100 column (22 × 250 mm, Dionex) at 80°C (Buffer A: 20 mM, Tris pH 8, 5 M Urea, Buffer B: as A plus 2 M NaCl). Afterward, the N7-methylguanosine cap was added to the 5′ end of the RNAs using vaccinia virus capping enzyme according to a recently published protocol (Fuchs et al. 2016). The 30mer RNA was fluorescently labeled after capping using 5-(iodoacetamido)-fluorescein (Ramos and Varani 1998). Free label was removed by repeated EtOH precipitation of the RNA (3×). Labeling efficiency was estimated to 84% as judged from the 260/490 nm absorption ratio.
Decapping assays
Decapping assays were performed at 30°C in GF-buffer supplemented with 5 mM MgCl2 and 0.005% Triton X-100 using 20 µM capped 21mer, 100 nM enzyme and 3 µM Edc constructs or 350 µM Xrn1 (1224–1257) or Dcp2 (267–350) peptide. Samples were taken at the indicated times, diluted one-eighth in 10 mM EDTA to stop the decapping reaction and chloroform/phenol extracted to remove the protein. Ten microliters of the RNA solution were analyzed by anion exchange HPLC chromatography at 50°C using a DNAPac PA200 RS column (Dionex; 4.6 × 250 mm) equipped with a guard column (Buffer A: 20 mM Tris, pH 8.0, Buffer B: 20 mM Tris, pH 8.0, 1.5 M NaCl, gradient 41%–50% B over 16 min, flow rate 0.45 mL/min). Elution of capped and decapped RNA was monitored at 260 nm, peak areas were integrated and corrected for different absorption coefficients of capped and decapped RNA to calculate the fractions of capped and decapped RNA species in the sample.
Crystallography
The S. pombe Dcp:Edc1 144–181 complex for crystallization trials was prepared by combining the Dcp1 and GB1-Edc1 144–181 elution fractions of the first NiNTA column, followed by TEV-cleavage, second NiNTA column and gel filtration as described above. Removal of the GB1-tag is possible in this case as the peptide is stable in complex with Dcp1. Crystals used for structure determination were grown using the sitting drop vapor diffusion method by mixing 0.3 µL of the complex (6 mg/mL in 125 mM NaCl, 10 mM HEPES, pH 7.3, 1 mM DTT) with an equal volume of precipitant solution (1 M NaCl, 33 mM sodium citrate pH 5, 66 mM sodium citrate pH 6). Crystals appeared after 2 d at room temperature. Cryo protection was performed by addition of 30% glycerol to the precipitant solution. Diffraction data were collected at the PXII beamline at the Swiss Light Source (temperature 100 K, wavelength 1 Å) and processed using XDS (Kabsch 2010). Molecular replacement was performed using Phaser (McCoy et al. 2007) using the S. pombe Dcp1 structure as found in PDB entry 2QKL (She et al. 2008). Several rounds of iterative model building and refinement were performed with Coot (Emsley et al. 2010) and Phenix (Adams et al. 2010) to finalize the structure.
NMR spectroscopy
Proteins for NMR measurements were isotopically labeled using M9 minimal medium supplemented with 15NH4Cl (0.5 g/L). 2H,15N,13C labeling of Dcp1:DcpRD was achieved in 100% D2O-based M9 medium supplemented with 15NH4Cl (0.5 g/L) and 2H,13C glucose (2 g/L). Relaxation dispersion measurements were carried out with 2H,15N-labeled protein. The assignment of the Dcp2 C-terminal tail (residues 267–350) was performed on a 15N/13C labeled sample. Protein purification was performed as for the unlabeled proteins.
All NMR experiments were recorded at 30°C on Bruker AVIII 600 and 800 MHz spectrometers equipped with triple resonance TXI room temperature probes. Samples were prepared in GF-buffer in 95%/5% H2O/D2O. Backbone resonance assignments were carried out using standard triple resonance pulse sequences (Sattler et al. 1999). In NMR binding experiments, the unlabeled protein was added to the labeled protein in threefold molar excess. Control experiments with GB1 only indicated that this domain did not interact with the decapping complex. 15N CPMG relaxation dispersion profiles were recorded at 14.1 and 18.8 T using a constant-time CPMG relaxation delay of 60 ms and CPMG frequencies ranging from 33.3 to 1600 Hz (Loria et al. 1999). CPMG experiments were fitted using the program RDNMR that was kindly provided by Martin Tollinger (University of Innsbruck). In the fitting procedure, we assume a simple two-state exchange model as the current NMR data do not allow the use of a more complex model. More than two conformations might be present in the Dcp1 protein such that it can adapt to the numerous different ligands. The simplified model might introduce small inaccuracies in the extracted populations and rates. NMR data were processed using the NMRPipe/NMRDraw software suite (Delaglio et al. 1995). CSPs were calculated in ppm as (ΔωH2 + 0.1 × ΔωN2)1/2 and affinities were extracted based on Johnson et al. (1996).
Fluorescence anisotropy
Fluorescence anisotropy measurements were performed at RT in GF-buffer supplemented with 0.002% Triton X-100 and 2 mM EDTA to prevent decapping of the RNA. Fluorescently labeled S. pombe Edc1 1-221 and capped 30mer RNA were used at 20 nM concentration and solutions with increasing S. pombe Dcp1:2 concentrations were prepared independently. An Edc1 (144–215, WT, or ΔYAG) concentration of 3 µM was used when indicated. Fluorescence anisotropy was measured using a Tecan Infinite F200 plate reader, excitation and emission wavelength were 485 and 535 nm. Binding curves were fitted to the standard equation for a one-site binding model (Johnson et al. 1996) using in house written scripts. For competition experiments 20 nM of fluorescently labeled Edc1 1–221 in the presence of 1 µM unlabeled Edc1 144–215 or Edc1 144–215 ΔYAG was titrated with Dcp1:Dcp2RD+CD. During the titration, the labeled (1–221) and unlabeled Edc1 (144–215) thus compete for binding with the decapping complex. This approach is similar to the one described by Kuzmic et al. (1992). Binding curves were analyzed with Dynafit (Kuzmic 1996) to extract the KDs of the unlabeled Edc1 constructs. Errors were extracted from at least three independent measurements (Supplemental Fig. S12).
Sequence alignments were performed using T-coffee (Di Tommaso et al. 2011). Pictures displaying molecular structures were prepared using the UCSF Chimera package (Pettersen et al. 2004), whereas pictures displaying NMR spectra were prepared using NMRView (www.onemoonscientific.com).
DATA DEPOSITION
Structure coordinates for the Dcp1:Edc1 complex have been deposited to the Protein Data Bank (PDB) with the accession code 5JP4.
SUPPLEMENTAL MATERIAL
Supplemental material is available for this article.
Supplementary Material
ACKNOWLEDGMENTS
We thank all laboratory members for discussions and support. We are grateful to Fulvia Bono for critical comments on the manuscript. We thank Simon Fromm for initial experiments, Ancilla Neu for recording diffraction data, Iris Holdermann for excellent technical support and help with the crystallography, Martin Tollinger (University of Innsbruck) for the program RDNMR that we used to fit CPMG data, and John Gross (UCSF) for the kind gift of the plasmids that we used to express S. cerevisiae Edc1. This work was supported by the Max Planck Society and the European Research Council under the European Union's Seventh Framework Programme (FP7/2007–2013), ERC grant agreement no. 616052.
Footnotes
Article published online ahead of print. Article and publication date are at http://www.rnajournal.org/cgi/doi/10.1261/rna.057315.116.
Freely available online through the RNA Open Access option.
REFERENCES
- Adams PD, Afonine PV, Bunkoczi G, Chen VB, Davis IW, Echols N, Headd JJ, Hung LW, Kapral GJ, Grosse-Kunstleve RW, et al. 2010. PHENIX: a comprehensive Python-based system for macromolecular structure solution. Acta Crystallogr D Biol Crystallogr 66: 213–221. [DOI] [PMC free article] [PubMed] [Google Scholar]
- Altschul SF, Gish W, Miller W, Myers EW, Lipman DJ. 1990. Basic local alignment search tool. J Mol Biol 215: 403–410. [DOI] [PubMed] [Google Scholar]
- Ball LJ, Jarchau T, Oschkinat H, Walter U. 2002. EVH1 domains: structure, function and interactions. FEBS Lett 513: 45–52. [DOI] [PubMed] [Google Scholar]
- Ball LJ, Kuhne R, Schneider-Mergener J, Oschkinat H. 2005. Recognition of proline-rich motifs by protein–protein-interaction domains. Angew Chem 44: 2852–2869. [DOI] [PubMed] [Google Scholar]
- Beelman CA, Stevens A, Caponigro G, LaGrandeur TE, Hatfield L, Fortner DM, Parker R. 1996. An essential component of the decapping enzyme required for normal rates of mRNA turnover. Nature 382: 642–646. [DOI] [PubMed] [Google Scholar]
- Beneken J, Tu JC, Xiao B, Nuriya M, Yuan JP, Worley PF, Leahy DJ. 2000. Structure of the Homer EVH1 domain-peptide complex reveals a new twist in polyproline recognition. Neuron 26: 143–154. [DOI] [PubMed] [Google Scholar]
- Biegert A, Mayer C, Remmert M, Soding J, Lupas AN. 2006. The MPI Bioinformatics Toolkit for protein sequence analysis. Nucleic Acids Res 34: W335–W339. [DOI] [PMC free article] [PubMed] [Google Scholar]
- Borja MS, Piotukh K, Freund C, Gross JD. 2011. Dcp1 links coactivators of mRNA decapping to Dcp2 by proline recognition. RNA 17: 278–290. [DOI] [PMC free article] [PubMed] [Google Scholar]
- Bouveret E, Rigaut G, Shevchenko A, Wilm M, Seraphin B. 2000. A Sm-like protein complex that participates in mRNA degradation. EMBO J 19: 1661–1671. [DOI] [PMC free article] [PubMed] [Google Scholar]
- Braun JE, Truffault V, Boland A, Huntzinger E, Chang CT, Haas G, Weichenrieder O, Coles M, Izaurralde E. 2012. A direct interaction between DCP1 and XRN1 couples mRNA decapping to 5′ exonucleolytic degradation. Nat Struct Mol Biol 19: 1324–1331. [DOI] [PubMed] [Google Scholar]
- Coller JM, Tucker M, Sheth U, Valencia-Sanchez MA, Parker R. 2001. The DEAD box helicase, Dhh1p, functions in mRNA decapping and interacts with both the decapping and deadenylase complexes. RNA 7: 1717–1727. [DOI] [PMC free article] [PubMed] [Google Scholar]
- Delaglio F, Grzesiek S, Vuister GW, Zhu G, Pfeifer J, Bax A. 1995. NMRPipe: a multidimensional spectral processing system based on UNIX pipes. J Biomol NMR 6: 277–293. [DOI] [PubMed] [Google Scholar]
- Deshmukh MV, Jones BN, Quang-Dang DU, Flinders J, Floor SN, Kim C, Jemielity J, Kalek M, Darzynkiewicz E, Gross JD. 2008. mRNA decapping is promoted by an RNA-binding channel in Dcp2. Mol Cell 29: 324–336. [DOI] [PubMed] [Google Scholar]
- Di Tommaso P, Moretti S, Xenarios I, Orobitg M, Montanyola A, Chang JM, Taly JF, Notredame C. 2011. T-Coffee: a web server for the multiple sequence alignment of protein and RNA sequences using structural information and homology extension. Nucleic Acids Res 39: W13–W17. [DOI] [PMC free article] [PubMed] [Google Scholar]
- Dunckley T, Tucker M, Parker R. 2001. Two related proteins, Edc1p and Edc2p, stimulate mRNA decapping in Saccharomyces cerevisiae. Genetics 157: 27–37. [DOI] [PMC free article] [PubMed] [Google Scholar]
- Emsley P, Lohkamp B, Scott WG, Cowtan K. 2010. Features and development of Coot. Acta Crystallogr D Biol Crystallogr 66: 486–501. [DOI] [PMC free article] [PubMed] [Google Scholar]
- Fischer N, Weis K. 2002. The DEAD box protein Dhh1 stimulates the decapping enzyme Dcp1. EMBO J 21: 2788–2797. [DOI] [PMC free article] [PubMed] [Google Scholar]
- Floor SN, Jones BN, Gross JD. 2008. Control of mRNA decapping by Dcp2: An open and shut case? RNA Biol 5: 189–192. [DOI] [PMC free article] [PubMed] [Google Scholar]
- Floor SN, Jones BN, Hernandez GA, Gross JD. 2010. A split active site couples cap recognition by Dcp2 to activation. Nat Struct Mol Biol 17: 1096–1101. [DOI] [PMC free article] [PubMed] [Google Scholar]
- Floor SN, Borja MS, Gross JD. 2012. Interdomain dynamics and coactivation of the mRNA decapping enzyme Dcp2 are mediated by a gatekeeper tryptophan. Proc Natl Acad Sci 109: 2872–2877. [DOI] [PMC free article] [PubMed] [Google Scholar]
- Franks TM, Lykke-Andersen J. 2008. The control of mRNA decapping and P-body formation. Mol Cell 32: 605–615. [DOI] [PMC free article] [PubMed] [Google Scholar]
- Fromm SA, Truffault V, Kamenz J, Braun JE, Hoffmann NA, Izaurralde E, Sprangers R. 2012. The structural basis of Edc3- and Scd6-mediated activation of the Dcp1:Dcp2 mRNA decapping complex. EMBO J 31: 279–290. [DOI] [PMC free article] [PubMed] [Google Scholar]
- Fromm SA, Kamenz J, Noldeke ER, Neu A, Zocher G, Sprangers R. 2014. In vitro reconstitution of a cellular phase-transition process that involves the mRNA decapping machinery. Angew Chem 53: 7354–7359. [DOI] [PMC free article] [PubMed] [Google Scholar]
- Fuchs AL, Neu A, Sprangers R. 2016. A general method for rapid and cost-efficient large-scale production of 5′ capped RNA. RNA (this issue) 22: 1454–1466. [DOI] [PMC free article] [PubMed] [Google Scholar]
- Harigaya Y, Jones BN, Muhlrad D, Gross JD, Parker R. 2010. Identification and analysis of the interaction between Edc3 and Dcp2 in Saccharomyces cerevisiae. Mol Cell Biol 30: 1446–1456. [DOI] [PMC free article] [PubMed] [Google Scholar]
- He F, Jacobson A. 2015. Control of mRNA decapping by positive and negative regulatory elements in the Dcp2 C-terminal domain. RNA 21: 1633–1647. [DOI] [PMC free article] [PubMed] [Google Scholar]
- Herrick D, Parker R, Jacobson A. 1990. Identification and comparison of stable and unstable mRNAs in Saccharomyces cerevisiae. Mol Cell Biol 10: 2269–2284. [DOI] [PMC free article] [PubMed] [Google Scholar]
- Ingelfinger D, Arndt-Jovin DJ, Luhrmann R, Achsel T. 2002. The human LSm1–7 proteins colocalize with the mRNA-degrading enzymes Dcp1/2 and Xrnl in distinct cytoplasmic foci. RNA 8: 1489–1501. [PMC free article] [PubMed] [Google Scholar]
- Johnson PE, Tomme P, Joshi MD, McIntosh LP. 1996. Interaction of soluble cellooligosaccharides with the N-terminal cellulose-binding domain of Cellulomonas fimi CenC 2. NMR and ultraviolet absorption spectroscopy. Biochemistry 35: 13895–13906. [DOI] [PubMed] [Google Scholar]
- Kabsch W. 2010. Xds. Acta Crystallogr D Biol Crystallogr 66: 125–132. [DOI] [PMC free article] [PubMed] [Google Scholar]
- Kshirsagar M, Parker R. 2004. Identification of Edc3p as an enhancer of mRNA decapping in Saccharomyces cerevisiae. Genetics 166: 729–739. [DOI] [PMC free article] [PubMed] [Google Scholar]
- Kuzmic P. 1996. Program DYNAFIT for the analysis of enzyme kinetic data: application to HIV proteinase. Anal Biochem 237: 260–273. [DOI] [PubMed] [Google Scholar]
- Kuzmic P, Moss ML, Kofron JL, Rich DH. 1992. Fluorescence displacement method for the determination of receptor-ligand binding constants. Anal Biochem 205: 65–69. [DOI] [PubMed] [Google Scholar]
- Lai T, Cho H, Liu Z, Bowler MW, Piao S, Parker R, Kim YK, Song H. 2012. Structural basis of the PNRC2-mediated link between mRNA surveillance and decapping. Structure 20: 2025–2037. [DOI] [PubMed] [Google Scholar]
- Loria JP, Rance M, Palmer AG III. 1999. A TROSY CPMG sequence for characterizing chemical exchange in large proteins. J Biomol NMR 15: 151–155. [DOI] [PubMed] [Google Scholar]
- Makino DL, Schuch B, Stegmann E, Baumgartner M, Basquin C, Conti E. 2015. RNA degradation paths in a 12-subunit nuclear exosome complex. Nature 524: 54–58. [DOI] [PubMed] [Google Scholar]
- McCoy AJ, Grosse-Kunstleve RW, Adams PD, Winn MD, Storoni LC, Read RJ. 2007. Phaser crystallographic software. J Appl Crystallogr 40: 658–674. [DOI] [PMC free article] [PubMed] [Google Scholar]
- Miller C, Schwalb B, Maier K, Schulz D, Dumcke S, Zacher B, Mayer A, Sydow J, Marcinowski L, Dolken L, et al. 2011. Dynamic transcriptome analysis measures rates of mRNA synthesis and decay in yeast. Mol Syst Biol 7: 458. [DOI] [PMC free article] [PubMed] [Google Scholar]
- Mitchell P, Petfalski E, Shevchenko A, Mann M, Tollervey D. 1997. The exosome: a conserved eukaryotic RNA processing complex containing multiple 3′-->5′ exoribonucleases. Cell 91: 457–466. [DOI] [PubMed] [Google Scholar]
- Mitrea DM, Kriwacki RW. 2016. Phase separation in biology; functional organization of a higher order. Cell Commun Signal 14: 1. [DOI] [PMC free article] [PubMed] [Google Scholar]
- Neu A, Neu U, Fuchs AL, Schlager B, Sprangers R. 2015. An excess of catalytically required motions inhibits the scavenger decapping enzyme. Nat Chem Biol 11: 697–704. [DOI] [PMC free article] [PubMed] [Google Scholar]
- Nissan T, Rajyaguru P, She M, Song H, Parker R. 2010. Decapping activators in Saccharomyces cerevisiae act by multiple mechanisms. Mol Cell 39: 773–783. [DOI] [PMC free article] [PubMed] [Google Scholar]
- Parker R, Song H. 2004. The enzymes and control of eukaryotic mRNA turnover. Nat Struct Mol Biol 11: 121–127. [DOI] [PubMed] [Google Scholar]
- Pettersen EF, Goddard TD, Huang CC, Couch GS, Greenblatt DM, Meng EC, Ferrin TE. 2004. UCSF Chimera—a visualization system for exploratory research and analysis. J Comput Chem 25: 1605–1612. [DOI] [PubMed] [Google Scholar]
- Prehoda KE, Lee DJ, Lim WA. 1999. Structure of the enabled/VASP homology 1 domain-peptide complex: a key component in the spatial control of actin assembly. Cell 97: 471–480. [DOI] [PubMed] [Google Scholar]
- Ramos A, Varani G. 1998. A new method to detect long-range protein-RNA contacts: NMR detection of electron-proton relaxation induced by nitroxide spin-labeled RNA. J Am Chem Soc 120: 10992–10993. [Google Scholar]
- Sattler M, Schleucher J, Griesinger C. 1999. Heteronuclear multidimensional NMR experiments for the structure determination of proteins in solution employing pulsed field gradients. Prog Nucl Mag Res Sp 34: 93–158. [Google Scholar]
- Schoenberg DR, Maquat LE. 2012. Regulation of cytoplasmic mRNA decay. Nat Rev Genet 13: 246–259. [DOI] [PMC free article] [PubMed] [Google Scholar]
- Schwartz D, Decker CJ, Parker R. 2003. The enhancer of decapping proteins, Edc1p and Edc2p, bind RNA and stimulate the activity of the decapping enzyme. RNA 9: 239–251. [DOI] [PMC free article] [PubMed] [Google Scholar]
- Sharif H, Conti E. 2013. Architecture of the Lsm1–7-Pat1 complex: a conserved assembly in eukaryotic mRNA turnover. Cell Rep 5: 283–291. [DOI] [PubMed] [Google Scholar]
- She M, Decker CJ, Sundramurthy K, Liu Y, Chen N, Parker R, Song H. 2004. Crystal structure of Dcp1p and its functional implications in mRNA decapping. Nat Struct Mol Biol 11: 249–256. [DOI] [PMC free article] [PubMed] [Google Scholar]
- She M, Decker CJ, Chen N, Tumati S, Parker R, Song H. 2006. Crystal structure and functional analysis of Dcp2p from Schizosaccharomyces pombe. Nat Struct Mol Biol 13: 63–70. [DOI] [PMC free article] [PubMed] [Google Scholar]
- She M, Decker CJ, Svergun DI, Round A, Chen N, Muhlrad D, Parker R, Song H. 2008. Structural basis of dcp2 recognition and activation by dcp1. Mol Cell 29: 337–349. [DOI] [PMC free article] [PubMed] [Google Scholar]
- Srinivasan R, Rose GD. 1999. A physical basis for protein secondary structure. Proc Natl Acad Sci 96: 14258–14263. [DOI] [PMC free article] [PubMed] [Google Scholar]
- Steiger M, Carr-Schmid A, Schwartz DC, Kiledjian M, Parker R. 2003. Analysis of recombinant yeast decapping enzyme. RNA 9: 231–238. [DOI] [PMC free article] [PubMed] [Google Scholar]
- Tharun S, Parker R. 1999. Analysis of mutations in the yeast mRNA decapping enzyme. Genetics 151: 1273–1285. [DOI] [PMC free article] [PubMed] [Google Scholar]
- Tharun S, He W, Mayes AE, Lennertz P, Beggs JD, Parker R. 2000. Yeast Sm-like proteins function in mRNA decapping and decay. Nature 404: 515–518. [DOI] [PubMed] [Google Scholar]
- van Dijk E, Cougot N, Meyer S, Babajko S, Wahle E, Seraphin B. 2002. Human Dcp2: a catalytically active mRNA decapping enzyme located in specific cytoplasmic structures. EMBO J 21: 6915–6924. [DOI] [PMC free article] [PubMed] [Google Scholar]
- Volkman BF, Prehoda KE, Scott JA, Peterson FC, Lim WA. 2002. Structure of the N-WASP EVH1 domain-WIP complex: insight into the molecular basis of Wiskott-Aldrich Syndrome. Cell 111: 565–576. [DOI] [PubMed] [Google Scholar]
- Wang Z, Jiao X, Carr-Schmid A, Kiledjian M. 2002. The hDcp2 protein is a mammalian mRNA decapping enzyme. Proc Natl Acad Sci 99: 12663–12668. [DOI] [PMC free article] [PubMed] [Google Scholar]
- Wilusz CJ, Wormington M, Peltz SW. 2001. The cap-to-tail guide to mRNA turnover. Nat Rev Mol Cell Biol 2: 237–246. [DOI] [PubMed] [Google Scholar]
Associated Data
This section collects any data citations, data availability statements, or supplementary materials included in this article.