

Abstract
We have developed a method to measure strong transmembrane (TM) helix interaction affinities in lipid bilayers that are difficult to measure by traditional dilution methods. The method, called steric trapping, couples dissociation of biotinylated TM helices to a competitive binding by monovalent streptavidin (mSA), so that dissociation is driven by the affinity of mSA for biotin and mSA concentration. By adjusting the binding affinity of mSA through mutation, the method can obtain dissociation constants of TM helix dimers (Kd,dimer) over a range of six orders of magnitudes. The Kd,dimer limit of measurable target interaction is extended 3–4 orders of magnitude lower than possible by dilution methods. Thus, steric trapping opens up new opportunities to study the folding and assembly of α-helical membrane proteins in lipid bilayer environments. Here we provide detailed methods for applying steric trapping to a TM helix dimer.
Keywords: Membrane protein folding, Steric trap, Glycophorin A dimer, Transmembrane helix interaction, Monovalent streptavidin, Biotinylation
1 Introduction
Lateral interactions between transmembrane (TM) helices mediate the folding of α-helical membrane proteins, receptor assembly, and signaling in cell membranes [1–3]. To understand the physicochemical principles of these processes, significant efforts have been made to develop the methods for measuring thermodynamic stability of TM helix interactions in lipid environments [4–9]. The methods developed so far such as analytical centrifugation, reversible thiol-disulfide exchange, and Förster energy transfer (FRET), primarily rely on dilution of model TM peptides in detergents or lipids to a concentration range in which associated and dissociated populations become comparable. However, these methods cannot be applied to strongly interacting TM helices because there are practical limitations on how far the interacting helices can be diluted in lipid bilayers.
To overcome limitations on dilution, we developed a new method called steric trapping that involves coupling TM helix dissociation to a competitive binding event [10, 11]. In general, the basic tool kit includes an affinity tag which is covalently attached to the target TM helix; a bulky tag-binding protein which competes with the association, sterically trapping the dissociated monomers; and a method to sensitively monitor the dissociation of the target TM helix interaction or the binding of the tag-binding protein.
So far we have used a biotin affinity tag and monovalent streptavidin (mSA) as the tag binder. The highly specific biotin-monovalent streptavidin [12] binding pair is a versatile tool that can be conveniently embedded into the steric trapping strategy. The biotin tag can be efficiently attached to the target protein by enzymatic or chemical reactions. The tag-binding protein mSA can be produced in large quantities, and the exceptionally strong biotin affinity (Kd,biotin ~ 10−14 M) can be adjusted to a desirable range by mutations to achieve reversible conditions for thermodynamic measurements [11, 13]. We used the glycophorin A transmembrane domain (GpATM) that forms a stable dimer in lipid environments as well-characterized model system [14, 15]. Here, we describe the practical steps for measuring the thermodynamic stability of strong TM helix interactions in lipid bilayers using the steric trap method.
2 Principle and Strategy
A biotin acceptor peptide [16] (BAP) is inserted N-terminal to the GpATM domain fused to staphylococcal nuclease [14] (SN-GpATM) (Fig. 1a). We attach a biotin tag on each BAP using biotin ligase BirA. The two biotin tags must be located sufficiently close to each other and also to the target interaction site (GpATM) so that steric overlap would occur if two mSA molecules were bound in the dimer. Thus, the first biotin can be bound in the dimer with the intrinsic affinity of the biotin–mSA pair, but a second mSA can only bind if the dimer dissociates to monomers. Thus, the affinity of the second mSA binding is coupled to dissociation and therefore reflects dimer affinity (Fig. 1b). We therefore observe biphasic binding. At low concentrations, we observe an mSA-binding phase reflecting the intrinsic biotin affinity, but at higher concentrations we observe a second phase reflecting the weaker binding that is coupled to dissociation. Binding is detected by monitoring the increase of fluorescence of a pyrene label on SN-BAP-GpATM. As the reasonable concentration range of SN-BAP-GpATM is limited, it is necessary to tune the affinity of the mSA to a practical level. For example, if the affinity of mSA is too high relative to the free energy of dissociation, we can’t detect a second phase. If the affinity of mSA is too low, we have to raise the mSA concentrations to impractically high levels to see the second binding phase. We therefore generated a series of mSA mutants whose biotin affinity (Kd,biotin) ranges from ~ 10−9 to ~ 10−6 M (Fig. 2) [11]. The biotin affinity of mSA must be tuned to the stability of the dimer interaction of interest. The method can measure strong TM helix interactions because dissociation can be thermodynamically driven by using the high affinity of mSA and by the concentration of mSA.
Fig. 1.

Principles of the steric trap method. (a) Design of the DNA construct used for steric trapping. The lysine residue in the biotin acceptor peptide (BAP, bold) can be biotinylated by biotin ligase BirA. A unique cysteine residue (bold) at the position 72 was introduced for pyrene labeling. (b) (Changed to grey scale) Reaction scheme of the steric trap method. The second monovalent streptavidin (mSA)-binding affinity is modulated by the stability of the dimer due to the coupling of dimer dissociation and mSA binding: ΔGdissociation + ΔGbind. Reprinted with permission from Hong and Bowie [26]. Copyright 2011 American Chemical Society
Fig. 2.

Library of mSA mutants with various intrinsic biotin-binding affinities (top, Kd,biotin). If the affinity of mSA is too high, binding is insensitive to the contribution from dissociation. If the affinity is too low, impractically high concentrations of mSA are required to drive dissociation. Therefore, depending on the stability of the dimer (Kd,dimer), a mutant mSA with an optimal intrinsic biotin affinity should be selected (bottom). The dissociation constants shown reflect binding to monomeric SN-BAP-GpATM and must be determined for each system. mSA-S27R (asterisk) has a stronger biotin-binding affinity in the negatively charged membranes than in neutral lipid environments. Modified and reprinted with permission from Hong and Bowie [26]. Copyright 2011 American Chemical Society
3 Materials
3.1 Description of DNA Vector Encoding SN-BAP-GpATM
The SN-GpATM gene was inserted into a kanamycin-resistant pET30a vector using NdeI and XhoI restriction sites to fuse the His6-tag to the C-terminus of SN-GpATM (Fig. 1a). The intrinsic XmaI site in the pET30a vector was eliminated by site-directed mutagenesis to generate pET30aΔXmaI. A DNA cassette encoding the biotin acceptor peptide (BAP; amino acid sequence: GGLNDIFEAQKIEWHEDGSP; DNA sequence: 5′-phospho-CC GGG GGC CTG AAC GAC ATC TTC GAG GCT CAG AAA ATC GAA TGG CAC GAG GAC GGC TGT C, underlined nucleotides designates the complementary sequence ligated to the XmaI cut-site) was then inserted into the single XmaI restriction site, which was located right before the 5′-end of GpATM [14]. A unique Cys residue was introduced at Gly72 by site-directed mutagenesis for thiol-specific labeling with a fluorophore.
3.2 Expression and Purification of SN-BAP-GpATM
The procedure is modified from the reported protocol [14, 17]. SN-BAP-GpATM with the C-terminal His6-tag is expressed into inclusion bodies, extracted by decylmaltoside (DM) detergents, and purified by affinity chromatography using Ni-NTA resin.
Transform E. coli BL21(DE3)RP cells (Agilent) with pET30aΔXmaI/SN-BAP-GpATM. Pick a colony and grow in 5 ml Luria-Bertani media (LB: 10 g tryptone, 5 g yeast extract, 10 g NaCl per liter) containing 0.05 g/l kanamycin for 6 h. Then inoculate 1 l terrific broth (TB: 12 g tryptone, 24 g yeast extract, 4 ml glycerol, 23.12 g KH2PO4, 125.41 g K2HPO4 per liter) containing 0.05 g/l kanamycin at a 1–400 dilution.
Grow at 30 °C overnight (~16 h). The next day, increase the temperature to 37 °C and when the OD600nm reaches 1.5–2.0, induce the expression of SN-BAP-GpATM with 1 mM IPTG. Incubate for additional 3 h.
Harvest and resuspend the cells in 30 ml of 50 mM Tris–HCl, 5 mM EDTA buffer solution (pH 8.0) containing 1 mM PMSF (Thermo Scientific) and 1 mg/ml hen egg lysozyme (Sigma). Freeze and thaw the resuspended cells three times in dry ice/ethanol and a 42 °C water bath, respectively. Add CaCl2 to a final concentration of 10 mM to activate the nuclease domain of SN-BAP-GpATM. Digest the chromosomal DNAs for 20 min at 4 °C.
Centrifuge the lysate at 31,000 × g for 15 min in 45Ti rotor. Resuspend the pellets in 40 ml of 50 mM Tris–HCl, 1 M NaCl buffer (pH 8.5) containing 2 % (w/v) decyl maltoside (DM) (Anatrace, Sol-grade), using a tissue homogenizer to solubilize SN-BAP-GpATM.
Centrifuge the resuspension at 57,000 × g for 1 h in a 45Ti rotor. Collect the supernatant (approximately 40 ml) and add imidazole stock solution (4 M, pH 8.0) to a final concentration of 10 mM. Mix with 4 ml of Ni-NTA resin.
After stirring gently for 2 h at 4 °C, pack the slurry into to a column (Econo-Pac chromatography column, Bio-rad). Wash the protein-bound resin with 10 resin volumes of 0.5 % DM, 50 mM Tris–HCl, 200 mM NaCl, 10 mM imidazole buffer solution (pH 8.5) and elute with 10-resin volumes of the same buffer containing 200 mM imidazole.
3.3 In Vitro Biotinylation of SN-BAP-GpA
Biotinylate 40 ml of 50–100 μM SN-BAP-GpATM in 50 mM Tris–HCl, 200 mM NaCl, 200 mM imidazole buffer (pH 8.5) containing 5 mM ATP (Sigma), 1 mM D-biotin (Sigma), 5 mM magnesium acetate, 2 mM TCEP (Tris(2-carboxyethyl) phosphine hydrochloride, Pierce), and 2 μM BirA overnight at room temperature with gentle stirring [18].
After the removal of aggregates by centrifugation, concentrate the sample to less than 3 ml using Amicon Ultra centrifugal filters (MWCO = 30 kDa, Millipore).
Equilibrate an Econo-Pac 10DG desalting column (Bio-rad) with 0.5 % DM, 50 mM Tris–HCl, and 200 mM NaCl buffer solution (pH 8.5).
Remove excess biotin and imidazole using the desalting column. Estimate the SN-BAP-GpATM concentration using UV absorbance at 280 nm (ɛmolar = 22,920 M−1 cm−1). The typical yield of biotinylated SN-BAP-GpATM is 500–1,000 μM in 4 ml total volume from 1 l of TB culture.
Biotinylation efficiency can be quickly tested using SDS-PAGE by looking for the disappearance of the SN-BAP-GpA band after mixing with an excess of wild-type mSA. The mSA–biotin interaction remains intact in the 2 % SDS sample buffer (Fig. 3).
Store the sample frozen at −20 °C.
Fig. 3.

SDS-PAGE showing the binding of mSA to the biotinylated SN-BAP-GpATM-G72C. The unique Cys is blocked by a thiol-reactive pyrene label (see Subheading 3.4) to prevent the formation of an intermolecular disulfide bond. Lane 1: 10 μM of SN-BAP-GpATM in 20 mM DM; lane 2: 40 μM of WT mSA was added; lane 3: 40 μM of WT mSA was added first and incubated for 1 day with excess biotin; lane 4: 40 μM of WT mSA was added first and incubated for 7 days with excess biotin; lane 5: 40 μM of wild-type mSA pre-incubated with 2 mM biotin was added to 10 μM of SN-BAP-GpATM. All samples were not heated. Reproduced from Hong et al. [11]
3.4 Thiol-Specific Pyrene Labeling of SN-BAP-GpA
Reduce 5 ml of 100 μM of SN-BAP-GpATM-G72C in 2 % DM, 50 mM Tris–HCl, 200 mM NaCl (pH 8.5) with ten times molar excess of TCEP for 90 min at room temperature.
Add 20 times molar excess of thiol-reactive N-(1-pyrenemethyl) iodoacetamide (Invitrogen) from a 20 mg/ml stock solution dissolved in DMSO to the SN-BAP-GpATM solution. Incubate the reaction in the dark with gentle stirring at room temperature for ~16 h.
To remove unreacted pyrene label, immobilize the SN-BAP-GpATM on Ni-NTA resin and extensively wash with 1 % DM, 5 mM imidazole, 50 mM Tris–HCl, 200 mM NaCl buffer (pH 8.5). Elute with the same buffer containing 200 mM imidazole. Concentrate the eluate to less than 3 ml using Amicon Ultra centrifugal filters (MWCO = 30 kDa, Millipore).
Remove the excess imidazole using a Bio-rad 10DG desalting column and concentrate the eluate to less than 1 ml. Determine the pyrene-labeling efficiency from the total protein concentration obtained by Bio-rad Dc assay and the absorbance of pyrene at 345 nm (ɛmolar (280 nm) = 22,920 M−1 cm−1, ProtParam tool from ExPASy Proteomics Server). The efficiency typically ranges from 70 to 90 %. The total yield of the fluorescently labeled SN-BAP-GpATM is 200–600 μM in 500–1,000 μl.
3.5 Expression of Active and Inactive Streptavidin
The expression and purification procedure of streptavidin is modified from the reported protocols [12, 19]. The inclusion bodies of active subunit with the C-terminus His6-tag and inactive subunit (triple mutant N23A/S27D/S45A) without a tag are separately expressed, multiply washed with Triton X100, and solubilized by GdnHCl.
Transform E. coli BL21(DE3)RP cells with the pET21a vector encoding streptavidin (active or inactive) [12]. Grow a colony in LB media containing 0.1 g/l ampicillin at 37 °C overnight.
Inoculate the culture in a larger volume of LB media at 1–20 dilution in the presence of 0.1 g/l ampicillin. Induce the expression of streptavidin at OD600nm = 0.7 by adding 1 mM IPTG and continue incubating for 3 h.
Resuspend the harvested cells in 1/100 culture volume of 50 mM Tris–HCl, 0.75 M sucrose, 1 mg/ml hen egg lysozyme (pH 8.0) followed by 3 cycles of freeze/thaw in a dry ice/ethanol and a 42 °C water bath, respectively.
Treat the lysate with 1 mg/ml bovine pancreas DNase (Sigma) and 10 mM CaCl2 for 1 h at 4 °C and centrifuge at 31,000 × g for 15 min at 4 °C using a 45Ti rotor.
Wash the pellet by resuspension in 1/150 culture volume of 50 mM Tris–HCl (pH 8.0), 1.5 M NaCl, 0.5 % TritonX100 (Sigma) using a tissue homogenizer. Centrifuge the resuspension at 45,000 × g for 15 min at 4 °C using a 45Ti rotor.
Repeat the washing step two more times.
Further wash the resulting pellet with the same buffer without TritonX100 and centrifuge again. Solubilize the precipitated inclusion body by 1/250 culture volume of 6 M GdnHCl (pH 2.0) with the aid of a tissue homogenizer. Centrifuge the sample at 27,000 rpm for 45 min using a 45Ti rotor.
Measure the OD280nm of the supernatant. Typical OD280nm’s for the final solutions were 20–40 (from 2 to 4 l culture) for active and 60–80 for inactive variant (from 8 to 12 l culture).
3.6 Refolding and Purification of Monovalent Streptavidin (mSA)
The original protocol of Howarth et al. [12] is employed with minor modifications. It involves the reassembly of tetrameric streptavidin from an unfolded mixture of His6-tagged active subunits and untagged inactive subunits. The singly tagged mSA is then isolated by the selective elution from a Ni-NTA resin at low imidazole concentrations (Fig. 4).
Fig. 4.

Purification of mSA by Ni-NTA affinity chromatography. The major fraction of mSA is selectively eluted at 50 and 60 mM imidazole (lanes 4–7). Lane 1: FT (fow-through), lane 2: wash, lane 3: molecular weight standard for the mixture of inactive (I4), monovalent (A1I3), divalent (A2I2), trivalent (A3I1), and tetravalent (A4) streptavidin prepared by refolding of 1:1 mixture of unfolded active and inactive subunits
Mix the GdnHCl-solubilized stocks of His6-tagged active streptavidin and the untagged inactive streptavidin in a 1:4 molar ratio.
Add this mixture quickly drop by drop to a chilled and vigorously stirred 20 mM sodium phosphate, 200 mM NaCl buffer solution (pH 7.5) in Erlenmeyer flask to 1–40 final dilution.
Incubate the solution at 4 °C for 15 min and centrifuge at 9,000 × g for 30 min at 4 °C in a GS-3 rotor. Mix the supernatant with 1/100 volume of washed/equilibrated Ni-NTA resin and stir gently for 1 h at 4 °C.
Collect the protein-bound Ni-NTA resin by centrifugation in a bench-top centrifuge and then pack into a Bio-rad disposable chromatography column (4 ml resin/column).
Wash the column with 10 resin volumes of wash buffer (10 mM imidazole, 20 mM sodium phosphate, 200 mM NaCl, pH 7.5). Elute the mSA with 20 resin volume of 50 mM imidazole buffer and then by 10 resin volume of 60 mM imidazole buffer.
Confirm the presence of mSA by Tris-Gly 12 % SDS-PAGE without sample heating (Fig. 4). During the run, cool the gel box in ice to minimize heat-induced subunit rearrangements.
Concentrate the collected 50 mM and 60 mM imidazole eluates to less than 40 ml using 30 kDa cutoff Amicon ultrafiltration filters and dialyze against 20 mM sodium phosphate, 200 mM NaCl, pH 7.5 to remove the excess imidazole (Spectra/Por 10 kDa cutoff membranes).
To maximize the purity of mSA, mix the dialyzed protein solution again with 3 ml of washed/equilibrated Ni-NTA resin after centrifugation. Repeat the purification in the Ni-NTA column. Concentrate the resulting eluted proteins and dialyze into the same buffer without imidazole as above.
The final yield of mSA varied significantly depending on the mutations on the active subunit. For 1 l of a total refolding solution, we typically obtained 0.5–2 ml of a 150–250 μM mSA tetramer using ɛmolar(280 nm) =167,760 M−1 cm−1 (ProtParam tool, ExPASy Proteomics Server).
4 Methods
4.1 Determination of Intrinsic Biotin Affinity of mSA to SN-BAP-GpA
Measurements of the intrinsic biotin affinities of the mSA mutants are essential for obtaining the thermodynamic dissociation constant of the SN-BAP-GpATM dimer (see Eq. 3). To measure the intrinsic affinity, we employed the mutant G83I of GpATM, which exists predominantly in a monomeric form when highly diluted, so that the monomer–dimer equilibrium does not contribute to mSA binding [20]. The intrinsic biotin affinities (Kd,biotin) of weaker biotin binding mSA mutants (S27R, N23A/S45A, and W79A [19]) were determined by direct binding measurements between pyrene-labeled G83I SN-BAP-GpATM mutant and mSA (see step 1 below, Figs. 2 and 5a). The biotin affinities of the stronger binding mutants were obtained by competition for binding between a mutant with known biotin affinity and a mutant with unknown affinity. We developed a FRET-based competition assay for this purpose (see steps 2–5 below and Fig. 5b).
Fig. 5.

Measurements of intrinsic binding affinities of mSA mutants. (a) Determination of Kd,biotin of the weaker biotin binding mutant mSAs by direct binding measurement with the highly diluted pyrene-labeled G83I SN-BAP-GpATM mutant in DM micellar solution. (b) Determination of Kd,biotin of the stronger biotin binding mutant mSA using FRET-based competition assays. Reproduced from Hong et al. [11]
Titrate 300 nM pyrene-labeled G83I in 100 mM DM with mSA-S27R and -N23A/S45A mutants, respectively. Monitor the pyrene-fluorescence changes at 390 nm upon excitation at 330 nm and fit the data to the Eq. 1, which yielded Kd,biotin = 6.5 ± 2.0 μM and Kd,biotin = 870 ± 210 nM, respectively. For mSA-W79A, perform a binding measurement with 30 nM pyrene-labeled G83I SN-BAP-GpATM in 100 mM DM, from which Kd,biotin = 130 ± 30 nM was obtained. Prepare for all samples in 20 mM phosphate, 200 mM NaCl, pH 7.5 buffer solution (Fig. 5a).
Measure Kd,biotin’s of stronger biotin binding mSA’s (S45A [21], E44Q/S45A, W79M, W79Q) by a FRET-based competition assay because we cannot readily detect the labeled SN-BAP-GpATM mutant fluorescence at the dilutions required for straightforward binding assays (Fig. 5b). Label the G83I SN-BAP-GpATM mutant with Oregon Green488 iodoacetamide (Invitrogen) at Cys72 using the same protocol as the pyrene-labeling described above. Label mSA-S45A and -W79A mutants with amine-reactive Qsy7 succinimidyl ester (Invitrogen). Typically, 4–6 Lys residues were labeled per tetrameric mSA. In this experimental design, Oregon Green488 acts as a fluorescent donor and Qsy7 as a nonfluorescent acceptor (dark quencher).
First, pre-incubate 400 nM Oregon Green488-labeled G83I SN-BAP-GpATM mutant with Qsy7-labeled mSA-W79A in 100 mM DM (20 mM sodium phosphate, 200 mM NaCl, pH 7.5). Titrate this complex with unlabeled mSA-S27R with a known Kd,biotin = 6.5 μM and incubated overnight at room temperature. Monitor the dequenched fluorescence from Oregon Green488 at 530 nm with an excitation wavelength of 485 nm and fit the data to Eq. 2 [21], which yielded Kd,biotin = 130 ±15 nM (Fig. 5b, upper left). This Kd,biotin agreed well with the result obtained from the direct binding assay, which confirmed the validity of this method.
Determine Kd,biotin of mSA-S45A by titrating the pre-incubated 1 μM Qsy7-labeled mSA/400 nM of Oregon Green488-labeled G83I SN-BAP-GpATM complex with unlabeled mSA-W79A (Kd,biotin = 130 ± 15 nM), which yielded Kd,biotin(mSA-S45A) = 2.1 ± 0.1 nM (Fig. 5b, upper right).
-
For mSA-E44Q/S45A (Fig. 5b, lower left), -W79M, and -W79Q mutants (Fig. 5b, lower right), pre-incubate 400 nM of G83I SN-BAP-GpATM with an appropriate concentration of mSA-S45A (Kd,biotin = 2.1 ± 0.1 nM; 4 μM for mSA-E44Q/S45A titrations, 1 μM for mSA-W79M and -W79Q titrations), mix with increasing concentrations of the corresponding mutant mSA, and incubate overnight at room temperature. The fitting of the dequenching curves yielded Kd,biotin = 9.1 ± 0.5 nM (mSA-E44Q/S45A), 40.0 ± 1.4 nM (mSA-W79M), and 280 ± 14 nM (mSA-W79Q), respectively.
(1) Po: Total SN-BAP-GpATM concentration (fixed); A1,A2: Amplitude of binding phase and initial fluorescence level, respectively (fitted); [mSA]: Total mSA concentration (variable); Kd,biotin: Dissociation constant for intrinsic biotin-binding affinity of mSA (fitted).(2) Pt: Total concentration of Qsy7-labeled mSA (fixed); Lt: Total concentration of Oregon Green488-labeled SN-BAP-GpATM (fixed); A1,A2: Amplitude of binding phase and initial fluorescence level, respectively (fitted); [mSA]: Total concentration of unlabeled monovalent streptavidin (variable); Kc: Intrinsic biotin-binding affinity of unlabeled mSA (only fitted when Kp is known and fixed); Kp: Intrinsic biotin-binding affinity of Qsy7-labeled mSA (only fitted when Kc is known and fixed).
4.2 Preparation of Proteoliposomes
Add 15.2–60.8 mg of palmitoyloleoylphosphatidylcholine (C16:0C18:1c9PC, Avanti polar lipids) dissolved in chloroform (25 mg/ml) to glass tubes and dry under a stream of nitrogen gas. Remove residual solvent in a vacuum desiccator for 2 h.
Hydrate and solubilize the dried lipid films in 2 ml of 2–6 % β-octyl glucoside (Anatrace, Anagrade), 20 mM MOPS, 200 mM NaCl (pH 7.5). Add the DM solubilized SN-BAP-GpATM stock solution to the solubilized C16:0C18:1c9PC at a final concentration of 10 μM and incubate at room temperature for 1 h.
Reconstitute the SN-BAP-GpATM into C16:0C18:1c9PC vesicles by dialyzing against 250 sample volumes of 20 mM MOPS, 200 mM NaCl buffer solution (pH 7.5), with three equivalent buffer exchanges over the course of 48 h at 5 °C (Spectra/Por 25 kDa cutoff dialysis membrane, 7.5 mm diameter).
Extrude the resulting proteoliposomes through Nucleo track etch membrane with 200 nm pore size (Whatman) using a mini-extruder (Avanti polar lipids) 15 times. The typical average diameter of proteoliposomes is 110 ± 60 nm as measured by dynamic light scattering (DynaPro light-scattering systems, Protein Solutions). Store the liposomal solutions at 4 °C.
4.3 Determination of Lipid-to-Protein Molar Ratio
4.3.1 Determination of Total Protein and Lipid Concentration After Reconstitution
Solubilize the proteoliposomes prepared above with an equal volume of 200 mM C8E5 solution (20 mM MOPS, 200 mM NaCl, pH 7.5).
To determine SN-BAP-GpATM concentration, titrate the solubilized sample with wild-type mSA and incubate overnight.
Determine the total concentration of pyrene-labeled biotinylated SN-BAP-GpATM by fitting the stoichiometric binding data to Eq. 1 with a fixed parameter, Kd,biotin = 10−14 M (Fig. 6a).
Measure the total lipid concentration in the proteoliposome samples by an organic-phosphate assay [22] (Fig. 6b).
Fig. 6.
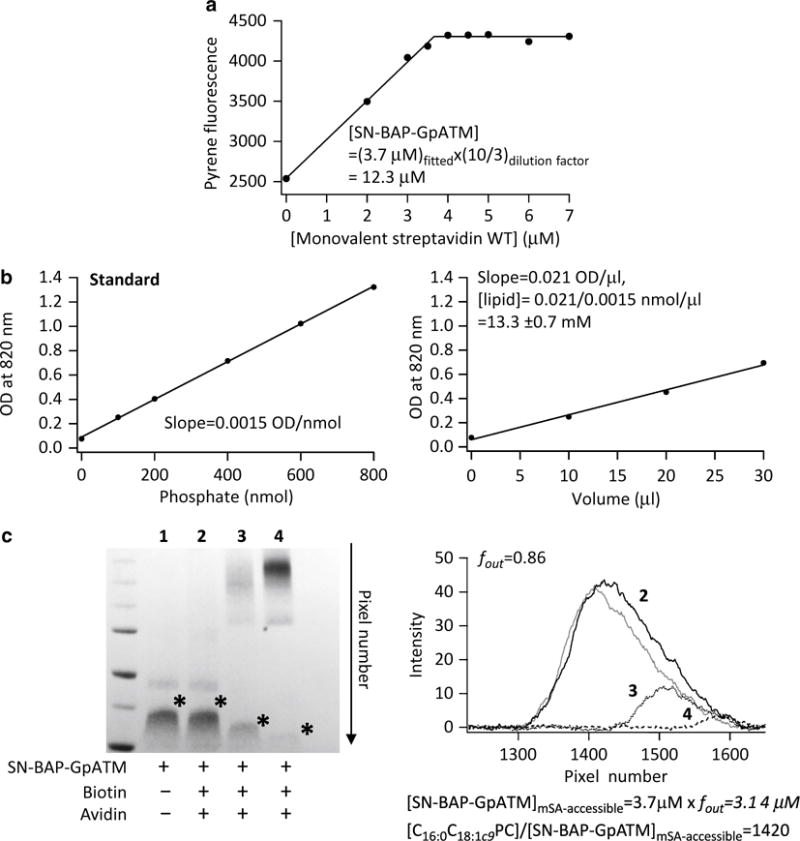
Method and representative data for determining the lipid-to-protein molar ratio and the fraction of mSA-accessible SN-BAP-GpATM in lipid bilayers. Reproduced from Hong et al. [11]. (a) Measuring the total concentration of the biotinylated SN-BAP-GpATM by stoichiometric titration with wild-type mSA. (b) Organic-phosphate assay to measure the concentration of C16:0C18:1c9PC. (c) Determining the orientation distribution of the biotinylated SN-BAP-GpATM in C16:0C18:1c9PC bilayers by avidin-binding assay (see Subheading 3.4, step 2)
4.3.2 Determination of the Orientation Distribution of SN-BAP-GpATM in Lipid Vesicles
The purpose of this procedure is to determine the effective protein concentration whose biotin tag is accessible to mSA from the outside of the vesicles. The orientation distribution of biotinylated SN-BAP-GpATM in C16:0C18:1c9PC bilayers is determined by an avidin-binding assay [11] (Fig. 6c).
Incubate the proteoliposome samples (~10 μM SN-BAP-GpATM) with a molar excess of avidin (Pierce) (20 μM in tetramer) overnight.
Add excess free biotin (1 mM) to saturate the rest of biotin-binding sites, thereby freezing the amount of avidin–SN-BAP-GpATM complex because the off-rate of biotin binding is extremely slow (see Fig. 3). Add SDS sample buffer and separate by SDS-PAGE without sample heating.
As a positive control for full binding, first solubilize the proteoliposomes in SDS sample buffer and then add excess avidin and free biotin sequentially as in step 2 (Fig. 6c, lane 4). Avidin-accessible SN-BAP-GpATM is separated from the SN-BAP-GpATM band.
As a negative control, pre-incubate avidin with an excess free biotin prior to addition to the proteoliposomes. Add SDS sample buffer and separate by SDS-PAGE without sample heating (Fig. 6c, lane 2).
Process the digitized gel images using the LabView program (National Instruments) developed by Dr. Volker Kiessling in Professor Lukas Tamm lab at University of Virginia.
Digitized band intensities are background-subtracted and integrated using the Igor-Pro program (WaveMetrics) (Fig. 6c, right).
Determine the mol fraction of SN-BAP-GpATM with accessible biotin residues using the equation fout = [I(Negative control) − I(Experiment)]/[I(Negative control) − I(Positive control)]. Each term represents the integrated intensity of each SN-BAP-GpATM band, which is not bound to avidin.
Calculate the lipid-to-protein molar ratio (L/P) based on the equation, L/P = CC16:0C18:1c9PC,total/(CGpA,totalfout), in which CC16:0C18:1c9PC,total, CGpA,total, and fout represent the total C16:0C18:1c9PC concentration, total SN-BAP-GpATM concentration, and fraction of avidin-accessible SN-BAP-GpATM in a proteoliposome preparation, respectively. The mol fraction of avidin-accessible SN-BAP-GpATM is defined simply by 1/(L/P) since the protein contribution is negligible.
4.3.3 Measurement of mSA Binding
Binding of mSA with pyrene-labeled SN-BAP-GpATM is monitored by the increase in the fluorescence intensity at increasing concentrations of mSA (Fig. 7, left). The raw fluorescence changes are subtracted by the data obtained after the addition of excess free biotin, which leads to a complete dissociation of the mSA-dissociated SN-BAP-GpATM complex (Fig. 7, middle). To obtain the thermodynamic stability of the GpATM dimer, an mSA mutant must be chosen from the mSA library that yields a characteristic biphasic curve (Figs. 1b, 2, and 7, left). Practically, the optimal mSA is determined based on the criteria that the weaker second mSA-binding phase can be fully observed at concentrations below 100 μM mSA. The corrected binding curve is fitted to the appropriate equations to extract the dissociation constant of the dimer (Kd,dimer) (Fig. 7, right; Eqs. 3 and 4).
Fig. 7.

Strategy to measure the stability of the SN-BAP-GpATM dimer in lipid bilayers. (a) Left: selection of a mutant mSA with an optimal intrinsic biotin affinity (Kd,biotin) to measure the high stability of the GpATM dimer in neutral C16:0C18:1c9PC bilayers. The affinities of wild-type mSA (Kd,biotin ~ 10−14 M) and mSA-S45A (Kd,biotin = 2.1 × 10⁻⁹ M) were so strong that the second binding phase could not be discriminated. mSA-E44Q/S45A (Kd,biotin = 9.1 × 10⁻⁹ M) yielded the desired biphasic curve with strong first binding followed by an attenuated second binding. Middle: Addition of excess free biotin induced the suppression of the fluorescence changes implying the reversibility of the GpATM dimerization. The raw fluorescence changes (filled circle) were background subtracted by the free biotin-added data (open circle). Right: The corrected curve was fitted to the Eq. 3, which yielded the apparent dissociation constant (Kd,GpA) of the GpATM dimer of 1.2 ± 0.3 × 10⁻¹² M. Modified from Hong et al. [11]. (b) GpATM forms a weaker dimer in lipid bilayers composed of E. coli lipids. mSA-N23A/S45A with a weaker biotin affinity (Kd,biotin = 8.7 × 10⁻⁷ M) yielded the biphasic binding curve (right). The raw fluorescence changes were background subtracted by the data after the addition of free biotin (middle). Equation 4, which selectively fits the second binding phase, was used to obtain the Kd,GpA of 4.8 ± 2.0 × 10⁻⁸ M. Modified and reprinted with permission from Hong and Bowie [26]. Copyright 2011 American Chemical Society
For binding measurements in C16:0C18:1c9PC proteoliposomal solution, mix 30 μl of proteoliposomes with various compositions of buffer/BSA (bovine serum albumin, Sigma)/mSA mixtures. Add BSA to match the total protein concentrations of the sample solutions as changes in protein concentration can affect osmolarity and viscosity and alter the observed fluorescence. Perform all measurements in 20 mM MOPS, 200 mM NaCl buffer solution (pH 7.5) at room temperature.
Adjust the total molar concentration of BSA and mSA to 100 μM in all sample solutions. Transfer a total volume of 100 μl of each sample to a microplate, sealed with a polyolefin tape, and incubated overnight at room temperature (see Note 1).
Carefully stir the sample solutions in the wells to resuspend settled proteoliposomes before measurements. Measure fluorescence in microtiter plate reader (Molecular Devices M5 model) using an excitation wavelength of 330 nm and an emission wavelength 390 nm. Measure and average the mSA-induced changes in the pyrene-fluorescence intensity at least five times.
At the end of the measurements, add excess free biotin to a final concentration of 2 mM and incubate more than 6 h at room temperature to dissociate bound mSA from the biotinylated SN-BAP-GpATM. The fluorescence data from the biotin-blocked samples serve as a background (see Note 1).
-
Fit the background-subtracted data to Eq. 3 to extract Kd,dimer of the GpATM dimer.
(3) Po: Total SN-BAP-GpATM concentration (fixed); A1,A2,A3: Amplitude of the first binding phase, amplitude of the second binding phase, and initial fluorescence level, respectively (fitted); [mSA]: Total mSA concentration (variable); Kd,biotin: Dissociation constant for intrinsic biotin-binding affinity of mSA (fixed); Kd,dimer: Dissociation constant for GpATM dimers (fitted).(4) Po: Total SN-BAP-GpATM concentration (fixed); A1,A2: Amplitude of binding phase and initial fluorescence level, respectively (fitted); [mSA]: Total mSA concentration (variable); Kd,biotin: Dissociation constant for intrinsic biotin-binding affinity of mSA (fixed); Kd,dimer: Dissociation constant for GpATM dimers (fitted).
4.4 Conversion to Mol-Fraction Scale
The stability of TM helix dimers directly depends on the number of TM helices relative to the available hydrophobic volume (VL) of lipid environments rather than on the number of the TM helices in the total solution volume (VL + Vwater) [23]. Consequently, the dimer dissociation constants should be expressed on a mol-fraction scale [23, 24].
| (5) |
| (6) |
[L]: total molar concentration of lipid or detergent molecules; Kd,dimer(X): dissociation constant in mol-fraction scale; Kd,dimer: apparent dissociation constant in molar scale; : standard free energy change of dimer dissociation in mol-fraction scale; ΔGo: standard free energy change of dimer dissociation in molar scale.
To directly compare the free energy changes of dimer dissociation measured in different lipid environments, it is useful to plot the as a function of natural log of mol fraction of TM helices [11] (Fig. 8). If TM helices solubilized in the hydrophobic phase behave like ideal solute-solvent or if the dilution effect of the TM helix is purely entropic, the should be independent of the mol fraction of TM helix. This is the case for the dimerization of GpATM in C8E5 detergent micelles [23]. However, in decyl maltoside micelles and C16:0C18:1c9PC lipid bilayers, shows a significant deviation from the ideal behavior, which indicates a complex enthalpic and entropic contribution from the GpATM-detergent (or lipid) interactions in the monomer-dimer equilibrium or the involvement of higher order oligomers [23, 25]. Consequently, changes in dimerization free energy upon mutation or lipid composition changes can depend on the total protein concentration. To compare changes at a common concentration, the plot can be used to obtain the difference free energy changes between wild-type and mutant by comparing and the linearly interpolated values at a given mol fraction of the TM helix [11] (see Fig. 8).
Fig. 8.

Comparison of in detergent micelles (DM [11, 25] and C8E5 [23]) and C16:0C18:1c9PC bilayers as a function of mol fraction of SN-BAP-GpATM [11]. The mutational effect of the dimerization of GpATM can be evaluated by obtaining the difference in free energy changes ( ) between wild-type and GpATM mutant. The was estimated from the difference between the experimentally determined at a given mol fraction and the linearly interpolated to the same mol fraction. Modified from Hong et al. [11]
5 Conclusion and Outlook
The steric trap method described here has been successfully applied to study the stability of the GpATM dimer in lipid bilayers. Notably, the method could be used to measure dimer interaction at the subpicomolar range in neutral fluid C16:0C18:1c9PC bilayers, which represents the strongest TM helix interaction ever measured. The method further revealed that the GpATM dimer is more tightly packed in lipid bilayers than in detergent micelles [11], and the lipid and protein composition of natural cell membranes dramatically destabilize the TM helix interaction [26]. The ultimate goal of this method is to tackle the folding and stability of larger α-helical membrane proteins in native bilayer environment. The tools established from the simple TM helix model system will provide a foundation for these more complex systems.
Acknowledgments
We thank the Karen Fleming lab (Johns Hopkins University) and the Alice Ting lab (MIT) for providing plasmids. This work was supported by National Institutes of Health (NIH) Grants R01GM063919 and R01GM081783 (to J.U.B.) and start-up funds from Michigan State University (to H.H.). H.H. was supported by the Leukemia and Lymphoma Society Career Development Program (Fellow).
Appendix: Derivation of the Equation for the Second mSA Binding Coupled to the Dissociation of the TM Helix Dimer
Equation 4 was derived as follows according to the reaction scheme,
| (7) |
| (8) |
By using Eq. 8
which gives
Then,
[P]: SN-BAP-GpATM monomer concentration; [P2]: SN-BAP-GpATM dimer concentration; [P]o: Total SN-BAP-GpATM concentration; [mSA]: Total mSA concentration; Kd,biotin: Dissociation constant for intrinsic biotin-binding affinity of mSA; Kd,dimer: Dissociation constant for GpATM dimers.
Footnotes
We found that prolonged incubation for the weaker binding mutants led to aggregation, so it is important to try and minimize incubation times while still achieving equilibrium. The intrinsic rates of the dimer dissociation as well as the off-rates of the bound mSA mutants after the addition of excess free biotin are important factors to determine the incubation times in the thermodynamic binding and the background measurements, respectively. Practically, for the strong GpATM helix interactions, which are probed by strong biotin binding mSA mutants (mSA-S45A, mSA-E44Q/S45A, and mSA-W79M), it takes overnight for the system to reach equilibrium in mSA-binding measurements. To completely dissociate the SN-BAP-GpATM/mSA complex by addition of excess free biotin, it also takes at least 6 h of incubation. For the weaker interactions that can be probed by mSA mutants with weaker biotin affinities (mSA-W79Q, mSA-N23A/S45A, and mSA-S27R), the equilibrium for mSA binding is reached within 3 h, and the background fluorescence intensities are stabilized within 1 h after the free biotin addition (Fig. 7b).
References
- 1.Moore DT, Berger BW, DeGrado WF. Protein-protein interactions in the membrane: sequence, structural, and biological motifs. Structure. 2008;16:991–1001. doi: 10.1016/j.str.2008.05.007. [DOI] [PMC free article] [PubMed] [Google Scholar]
- 2.MacKenzie KR, Fleming KG. Association energetics of membrane spanning alpha-helices. Curr Opin Struct Biol. 2008;18:412–419. doi: 10.1016/j.sbi.2008.04.007. [DOI] [PMC free article] [PubMed] [Google Scholar]
- 3.Senes A. Computational design of membrane proteins. Curr Opin Struct Biol. 2011;21:460–466. doi: 10.1016/j.sbi.2011.06.004. [DOI] [PubMed] [Google Scholar]
- 4.Fisher LE, Engelman DM, Sturgis JN. Detergents modulate dimerization, but not helicity, of the glycophorin A transmembrane domain. J Mol Biol. 1999;293:639–651. doi: 10.1006/jmbi.1999.3126. [DOI] [PubMed] [Google Scholar]
- 5.You M, Li E, Wimley WC, Hristova K. Forster resonance energy transfer in liposomes: measurements of transmembrane helix dimerization in the native bilayer environment. Anal Biochem. 2005;340:154–164. doi: 10.1016/j.ab.2005.01.035. [DOI] [PMC free article] [PubMed] [Google Scholar]
- 6.Cristian L, Lear JD, DeGrado WF. Use of thiol-disulfide equilibria to measure the energetics of assembly of transmembrane helices in phospholipid bilayers. Proc Natl Acad Sci USA. 2003;100:14772–14777. doi: 10.1073/pnas.2536751100. [DOI] [PMC free article] [PubMed] [Google Scholar]
- 7.Fleming KG, Ackerman AL, Engelman DM. The effect of point mutations on the free energy of transmembrane alpha-helix dimerization. J Mol Biol. 1997;272:266–275. doi: 10.1006/jmbi.1997.1236. [DOI] [PubMed] [Google Scholar]
- 8.Hong H, Joh NH, Bowie JU, Tamm LK. Methods for measuring the thermodynamic stability of membrane proteins. Methods Enzymol. 2009;455:213–236. doi: 10.1016/S0076-6879(08)04208-0. [DOI] [PubMed] [Google Scholar]
- 9.Chen L, Novicky L, Merzlyakov M, Hristov T, Hristova K. Measuring the energetics of membrane protein dimerization in mammalian membranes. J Am Chem Soc. 2010;132:3628–3635. doi: 10.1021/ja910692u. [DOI] [PMC free article] [PubMed] [Google Scholar]
- 10.Blois TM, Hong H, Kim TH, Bowie JU. Protein unfolding with a steric trap. J Am Chem Soc. 2009;131:13914–13915. doi: 10.1021/ja905725n. [DOI] [PMC free article] [PubMed] [Google Scholar]
- 11.Hong H, Blois TM, Cao Z, Bowie JU. Method to measure strong protein-protein interactions in lipid bilayers using a steric trap. Proc Natl Acad Sci USA. 2010;107:19802–19807. doi: 10.1073/pnas.1010348107. [DOI] [PMC free article] [PubMed] [Google Scholar]
- 12.Howarth M, Chinnapen DJ, Gerrow K, Dorrestein PC, Grandy MR, Kelleher NL, El-Husseini A, Ting AY. A monovalent streptavidin with a single femtomolar biotin binding site. Nat Methods. 2006;3:267–273. doi: 10.1038/NMETHXXX. [DOI] [PMC free article] [PubMed] [Google Scholar]
- 13.Laitinen OH, Hytonen VP, Nordlund HR, Kulomaa MS. Genetically engineered avidins and streptavidins. Cell Mol Life Sci. 2006;63:2992–3017. doi: 10.1007/s00018-006-6288-z. [DOI] [PMC free article] [PubMed] [Google Scholar]
- 14.Lemmon MA, Flanagan JM, Hunt JF, Adair BD, Bormann BJ, Dempsey CE, Engelman DM. Glycophorin A dimerization is driven by specific interactions between transmembrane alpha-helices. J Biol Chem. 1992;267:7683–7689. [PubMed] [Google Scholar]
- 15.Fleming KG, Engelman DM. Specificity in transmembrane helix-helix interactions can define a hierarchy of stability for sequence variants. Proc Natl Acad Sci USA. 2001;98:14340–14344. doi: 10.1073/pnas.251367498. [DOI] [PMC free article] [PubMed] [Google Scholar]
- 16.Beckett D, Kovaleva E, Schatz PJ. A minimal peptide substrate in biotin holoenzyme synthetase-catalyzed biotinylation. Protein Sci. 1999;8:921–929. doi: 10.1110/ps.8.4.921. [DOI] [PMC free article] [PubMed] [Google Scholar]
- 17.Orzaez M, Perez-Paya E, Mingarro I. Influence of the C-terminus of the glycophorin A transmembrane fragment on the dimerization process. Protein Sci. 2000;9:1246–1253. doi: 10.1110/ps.9.6.1246. [DOI] [PMC free article] [PubMed] [Google Scholar]
- 18.Wu SC, Wong SL. Development of an enzymatic method for site-specific incorporation of desthiobiotin to recombinant proteins in vitro. Anal Biochem. 2004;331:340–348. doi: 10.1016/j.ab.2004.03.056. [DOI] [PubMed] [Google Scholar]
- 19.Chilkoti A, Tan PH, Stayton PS. Site-directed mutagenesis studies of the high-affinity streptavidin-biotin complex: contributions of tryptophan residues 79, 108, and 120. Proc Natl Acad Sci USA. 1995;92:1754–1758. doi: 10.1073/pnas.92.5.1754. [DOI] [PMC free article] [PubMed] [Google Scholar]
- 20.Doura AK, Kobus FJ, Dubrovsky L, Hibbard E, Fleming KG. Sequence context modulates the stability of a GxxxG-mediated transmembrane helix-helix dimer. J Mol Biol. 2004;341:991–998. doi: 10.1016/j.jmb.2004.06.042. [DOI] [PubMed] [Google Scholar]
- 21.Hyre DE, Le Trong I, Freitag S, Stenkamp RE, Stayton PS. Ser45 plays an important role in managing both the equilibrium and transition state energetics of the streptavidin-biotin system. Protein Sci. 2000;9:878–885. doi: 10.1110/ps.9.5.878. [DOI] [PMC free article] [PubMed] [Google Scholar]
- 22.Ames BN, Dubin DT. The role of polyamines in the neutralization of bacteriophage deoxyribonucleic acid. J Biol Chem. 1960;235:769–775. [PubMed] [Google Scholar]
- 23.Fleming KG. Standardizing the free energy change of transmembrane helix-helix interactions. J Mol Biol. 2002;323:563–571. doi: 10.1016/s0022-2836(02)00920-8. [DOI] [PubMed] [Google Scholar]
- 24.White SH, Wimley WC. Membrane protein folding and stability: physical principles. Annu Rev Biophys Biomol Struct. 1999;28:319–365. doi: 10.1146/annurev.biophys.28.1.319. [DOI] [PubMed] [Google Scholar]
- 25.Fisher LE, Engelman DM, Sturgis JN. Effect of detergents on the association of the glycophorin a transmembrane helix. Biophys J. 2003;85:3097–3105. doi: 10.1016/S0006-3495(03)74728-6. [DOI] [PMC free article] [PubMed] [Google Scholar]
- 26.Hong H, Bowie JU. Dramatic destabilization of transmembrane helix interactions by features of natural membrane environments. J Am Chem Soc. 2011;133:11389–11398. doi: 10.1021/ja204524c. [DOI] [PMC free article] [PubMed] [Google Scholar]