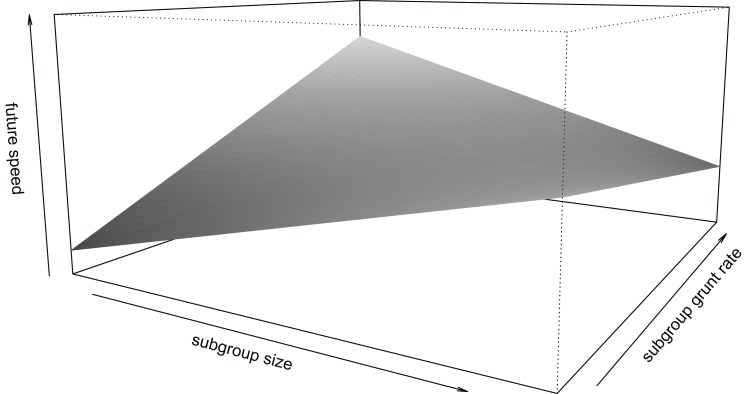
Figure 5. Interaction between subgroup size and subgroup grunt rate and its effect on future speed of individual mangabeys.
In smaller subgroups, individuals increased future speed with higher subgroup grunt rates. In larger subgroups, individuals decreased future speed with higher subgroup grunt rates. Speed (along the z-axis) ranges between −1.5 and 1.5. Limits along the x- and y-axes correspond to the range of standardized values in the data.

