Abstract
Photoacoustic imaging (PA) has emerged as a novel and noninvasive imaging modality owing to its high spatial resolution and high soft tissue contrast. Herein, we loaded a near-infrared (NIR) fluorescence dye (CySCOOH) onto the surface of PEGylated graphene oxide (GO) via π-π stacking to increase the NIR absorbance of GO. The PA imaging proved that PEGylated GO-CysCOOH (GO-PEG-CysCOOH) significantly enhances the PA signal in the tumor site compared with free GO-PEG. We then utilized the strong optical absorbance of GO-PEG-CySCOOH in the NIR region for in vivo photothermal therapy, achieving efficient tumor ablation after intravenous injection of GO-PEG-CySCOOH and low-power laser irradiation on the tumor. Our results indicate that this graphene-based nanocomposite can be developed as a promising contrast agent for PA imaging and a thermal agent for imaging guided photothermal therapy.
Introduction
Photoacoustic imaging (PA) has attracted extensive attention as an exciting non-invasive imaging modality for tumor imaging and tumor angiogenesis monitoring1, 2, which relies on detecting ultrasound waves generated by photothermal expansion of light-absorbing tissues or contrast probes under pulsed laser irradiation. PA imaging significantly improves in vivo imaging depth and resolution limit compared with traditional in vivo optical imaging. In recent years, various organic and inorganic nanomaterials including porphyrin shells3, carbon nanomaterials4, gold nanomaterials such as gold nanospheres5, chainlike gold6, nanorods, nanostars7, nanovesicles8 and nanocages9, have been widely used for PA imaging owing to their high NIR absorbance.
Graphene, as a two-dimensional (2D) honeycomb lattice, has been widely used in many fields since its discovery in 200410, 11. Owing to its high specific surface area, graphene can be used as a carrier for drug delivery and gene transfection12, 13. Utilizing its intrinsic high NIR absorbance, functionalized graphene oxide (GO) and reduced GO (rGO) have also been used as photothermal agents for in vivo cancer treatment10. In addition, GO-based nanocomposites that exhibit interesting optical and magnetic properties can be utilized as contrast agents for various biological imaging modalities including fluorescence imaging, photoacoustic imaging and magnetic resonance imaging14, and as a carrier for magnetism targeted drug delivery. While pure GO exhibited significant in vivo and in vitro toxicity15, fortunately, the stability and biocompatibility of GO would be improved after PEGylation16. In our recent work, a photosensitizer molecule 2-(1-hexyloxyethyl)-2-devinyl pyropheophorbide-alpha (HPPH) was loaded on PEGylated GO (GO-PEG-HPPH) via supramolecular π-π stacking for fluorescence imaging and positron emission tomography (PET) after radiolabeling of HPPH with 64Cu. And the GO-PEG-HPPH dramatically improved photodynamic cancer cell killing efficacy compared with free HPPH under 671 nm laser irradiation4. Organic and inorganic materials loaded on the surface of graphene can greatly enhance light-thermal conversion efficiency4.
In this work, a NIR fluorescence dye, CysCOOH, was loaded onto the surface of PEGylated GO via π-π stacking to form GO-PEG-CysCOOH nanocomposites. GO-PEG-CysCOOH dramatically increased the absorbance of GO in the NIR region and enhanced the efficacy of photothermal therapy under the low-power laser density compared with GO-PEG alone. In vivo PA imaging revealed higher PA signal in the tumor sites after intravenous injection of GO-PEG-CysCOOH, compared with GO-PEG alone. We then used relatively low laser power density to irradiate the tumor treated with GO-PEG-CysCOOH, achieving significant tumor ablation. This graphene based nano-formulation showed great potential for PA imaging and imaging guided PTT.
Materials and methods
Synthesis of GO-PEG
GO-PEG was synthesized following the procedure reported previously4. In brief, GO was prepared from graphite as an original material based on a modified Hummer’s method17. 1.8 g of sodium hydroxide (NaOH) was added into the 10 ml of GO solution (10mg/ml) at 55 °C for 4 h under magnetic stirring. The solution was adjusted to pH 1 using hydrochloric acid (HCl). The resulted solution was neutralized and purified by repeated rinsing and centrifugation. A solution of mPEG-NH2 (5 mg/ml) was added into the GO solution (1 mg/ml), and the mixture was sonicated for 5 min. 5 mg of N-(3-dimethylaminopropyl-N-ethylcarbodiimide) hydrochloride (EDC, from Sigma.) was then added to the mixture in two equal portions. The reaction was stirred overnight at room temperature, yielding a GO-PEG solution. The solution was further purified with dialysis and stored at 4 °C for following experiments.
Synthesis of CySCOOH
The CySCOOH was synthesized as Figure S1 (Electronic Supporting Information). The CySCOOH-NHS ester was synthesized by reacting CySCOOH (200 mg, 0.32 mmol) with N-hydroxysuccinimide (NHS) (44 mg, 0.38 mmol) in the presence of N, N′-Dicyclohexylcarbodiimide (DCC) (65 mg, 0.32 mmol). After stirring overnight, the reaction mixture was concentrated in vacuo, and purified by column chromatography (1:9, methano/dichloromethane MeOH/DCM) and lyophilized to yield CySCOOH-NHS (159 mg, 70%).
Synthesis and characterization of GO-PEG-CySCOOH
In brief, 4 mg of CySCOOH was dissolved in dimethyl sulfoxide (DMSO),and then mixed with 2 mg of GO–PEG, stirring at room temperature for 24 h. Excess CySCOOH was removed by centrifuge filtration through Amicon centrifugal filters (Millipore) with 100 kDa molecular weight cutoff (MWCO) for 5–6 times. Black-green color GO-PEG-CySCOOH solution was obtained and stored at 4°C. The CySCOOH loading capacity onto the surface of GO-PEG was investigated by UV-vis-NIR spectra. The quantity of CySCOOH dissolved in PBS solution was recorded at 820 nm which was the characterization peak of CySCOOH. The CySCOOH absorbance at 820 nm showed concentration-dependent. The diameter and morphology of GO-PEG and GO-PEG-CySCOOH were measured by atomic force microscope (AFM, Nanoscope IIIa, Digital Instrument Inc., USA). The standard curve of GO-PEG-CySCOOH at 820 nm was measured to calculate the number of molecules CySCOOH per gram of GO-PEG. Fluorescence intensity of the GO-PEG-CySCOOH and free CySCOOH were monitored using F-7000 fluorescence spectrophotometer.
Cell experiments
4T1 mouse breast cell lines were acquired from American Type Culture Collection (ATCC, Manassas, VA) and cultured under the standard culture conditions (RPMI-1640 medium supplemented with 10% FBS and 1% penicillin/streptomycin (100 mg/mL) solution at 37°C and 5% CO2). 4T1 cells incubated in 96-well cell plates at 5×10³/well for 24 h were co-incubated with CySCOOH, GO-PEG, and GO-PEG-CySCOOH at various concentrations (0–200 μM of CySCOOH). Next, 100 μg of methyl thiazolyl tetrazolium (MTT) solution (Sigma) was added into each well. After 4 h incubation, the cell media were removed and dimethyl sulfoxide (100 μL) was added to solubilize the formazin crystals. The relative cell viability was measured by reading plates at an absorbance of 570 nm. The cells were incubated with CySCOOH, GO-PEG and GO-PEG-CySCOOH at the same CySCOOH concentration of 100 μM for 24 h. Cells were washed with PBS for 3 times. 100 μL of fresh cell medium was added into wells, and then immediately irradiated by the 808 nm NIR laser at the power density of 1 W/cm2 for 10 min. The plates were returned to the incubator for further cultivation overnight. Cell viability relative was measured by the standard MTT assay.
Animal models
Nude mice were acquired from Harlan laboratories. The breast tumor model was established by subcutaneous injection of 2×10⁶ of 4T1 cells at the right haunch. Tumor mice were used for optical and photoacoustic imaging and photothermal therapy when the total volume of tumor reached about 100 mm3 (1 week).
In vivo fluorescence imaging
Mice bearing 4T1 tumor models were intravenously (i.v.) injected with GO-PEG-CySCOOH (200 μL, 1.5 mg/mL corresponding to 168 μg of CySCOOH). Fluorescence imaging was performed at 0, 1, 3, 24, 48, and 72 h post-injection by an IVIS lumina 2 optical imaging system. Major organs from treated mice were collected for optical imaging at 48 h post-injection.
In vivo photoacoustic imaging (PA)
When the tumor size reached ~100 mm3, 300 μg of GO-PEG-CySCOOH (corresponding to 168 μg of CySCOOH), and GO-PEG were i.v. injected into mice, respectively. A high-resolution animal photoacoustic imaging system with 256-element linear array a middle frequency of 21 MHz was used for photoacoustic imaging of tumor before and after injection. The photoacoustic signal intensity in the tumor sites was quantified by photoacoustic (PA) imaging.
Photothermal therapy
Mice bearing 4T1 tumor models were randomly divided into 6 groups. The treated mice including mice i.v. injected with 168 μg of CySCOOH, 300μg of GO-PEG or 300 μg of GO-PEG-CySCOOH (6 mice per group), were irradiated by 808 nm NIR laser at the power density of 0.5 W/cm2 for 5 min (600 J/cm2). In parallel control groups, mice i.v. injected with 168 μg of CySCOOH, 300 μg of GO-PEG or 300 μg of GO-PEGCySCOOH were no laser irradiation. Mice were observed for 60 days after PTT treatment. The volume of tumor (V) was calculated by the following equation: V = Length * width2/2. The relative volume of tumors was evaluated by normalizing the measured values to their initial sizes. Mice were euthanized for ethical consideration when tumor volume reached the 2000 mm3. On the other hand, mice were considered cured if there was no palpable tumor by day 60. The tumor weights were measured every other day.
Ex vivo histological staining
Mice were euthanized to collect major organs after PTT treatment. Tissues were fixed in a 4% Formaldehyde solution at room temperature for 48 hours, and then sectioned into thin slices. Haematoxylin and eosin (H&E) staining was performed following manufacturer’s instructions and observed by a bright-field microscopy (Olympus).
Results and discussion
GO was synthesized by a modified Hummers method, and functionalized by amino-terminated PEG (5 kDa) via amide formation to form GO-PEG. CySCOOH-NHS, a NIR fluorescence dye, was loaded onto the surface of GO-PEG via π-π stacking (Figure 1a). The average size of GO-PEG measured by atomic force microscope (AFM) imaging was less than 50 nm and the thickness was ~1.5 nm (Figure 1c). After CySCOOH-NHS loading, the thickness of GO-PEG-CySCOOH increased to 2 nm (Figure 1c). UV-vis-NIR spectra showed that PEGylated GO loaded CySCOOH significantly increased absorbance in the NIR region, compared with GO-PEG (Figure 1e). There was an obvious peak around 820 nm, suggesting successful loading of CySCOOH onto GO-PEG. GO-PEG-CySCOOH solution showed remarkable stability and biocompatibility in different physiological solutions including water, PBS, cell medium, and fetal bovine serum (FBS) (Figure 1b). From the fluorescence spectra data, we found that the fluorescence single was significantly quenched by GO after loading to the surface of GO, further confirming successful loading of CySCOOH onto GO-PEG (Figure 1f). A loading efficiency of 56% (CySCOOH: GO-PEG weight ratio) was achieved in a reaction of 1 mg of CySCOOH mixed with 1 mg of GO-PEG (Figure 1 d). In order to investigate the potential of GO-PEG-CySCOOH as thermal agent, GO-PEG, GO-PEG-CySCOOH and free CySCOOH at the same concentration of GO-PEG (44.5 μg/ml) and corresponding CySCOOH (25 μg/ml) were irradiated with 808 nm laser irradiation for 2 min (2 W/cm2), the temperature of GO-PEG-CySCOOH showed obvious increase to 53 °C compared with GO-PEG, likely owing to CySCOOH loading. The temperature of free CySCOOH also increased after laser exposure in 2 min, but decreased a little, likely owing to photobleaching of CySCOOH after long time laser exposure (Figure 1 g).
Figure 1.
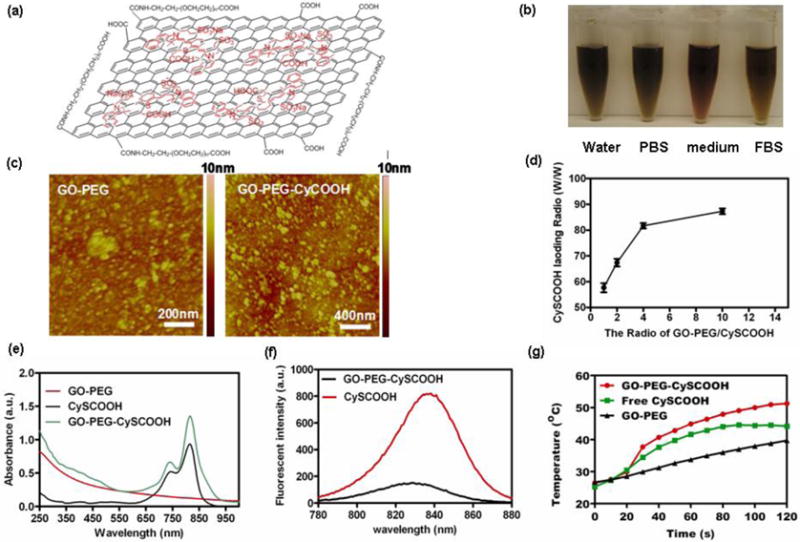
Preparation and characterization of GO-PEG and GO-PEG-CySCOOH. a) Schematic structure of GO-PEG-CySCOOH. b) Stability of GO-PEG-CySCOOH in different physiological solution including water, PBS, cell medium and fetal bovine serum. No Significant aggregation was noticed after 24 hours incubation. c) AFM images of GO-PEG and GO-PEG-CySCOOH. d) Normalized UV-vis-NIR spectra of GO-PEG, free CySCOOH and GO-PEG-CySCOOH. Two characteristic absorption peaks at 740 and 820 nm were observed for GO-PEG-CySCOOH. e) Quantification of CySCOOH loading at different CySCOOH concentrations. f) Fluorescence spectra of free CySCOOH, and GO-PEG-CySCOOH at a concentration of 20 μM of CySCOOH and 50 μg of GO-PEG-CySCOOH. g) Temperature elevation of GO-PEG-CySCOOH, free CySCOOH and GO-PEG solution at the same concentration over a period of 2 min under exposure of NIR light (808 nm, 1 W cm2) measured using a digital thermocamera.
We firstly investigated the potential toxicity to cancer cells. 4T1 murine cancer cells were incubated with different concentrations of GO-PEG, GO-PEG-CySCOOH and free CySCOOH for 24 h. The standard methyl thiazolyl tetrazolium (MTT) assay was then carried out to determine the relative viabilities. No obvious cytotoxicity was observed for 4T1 cell at the high concentration of CySCOOH (200 μM), indicating that GO-PEG, GO-PEG-CySCOOH and free CySCOOH induced no obvious toxicity to cells (Figure 2b). For in vitro photohthermal therapy (PTT), 4T1 cells incubated with GO-PEG, GO-PEG-CySCOOH and free CySCOOH at the concentration of 100 μM CySCOOH for 24 h, were irradiated with 808 nm laser irradiation at different laser power density for 3 min and co-stained with Calcine AM and propidium iodide (PI) for 30 min to differentiate live (green) and dead (red) cells, and imaged by a confocal fluorescence microscope (Figure 2 a). MTT assay was also used to quantitatively measure the relative cell viabilities after PTT treatment under different laser powers (Figure 2c). It was found that the relative viability of cells co-incubated with GO-PEG-CySCOOH was depended on the laser power density. Following laser power increase, most of cells incubated with GO-PEG-CySCOOH were killed by laser irradiation at power density of 1.0 W/cm2 for 10 min. In contrast, cells without CySCOOH incubation were not affected even after laser exposure at the highest power density of 2 W/cm2, while cells treated with PEGylated GO showed limited toxicity to cells compared with GO-PEG-CySCOOH. Therefore, our results showed that GO-PEG-CySCOOH could serve as a powerful thermal agent for in vitro and in vivo cancer cell PTT.
Figure 2.
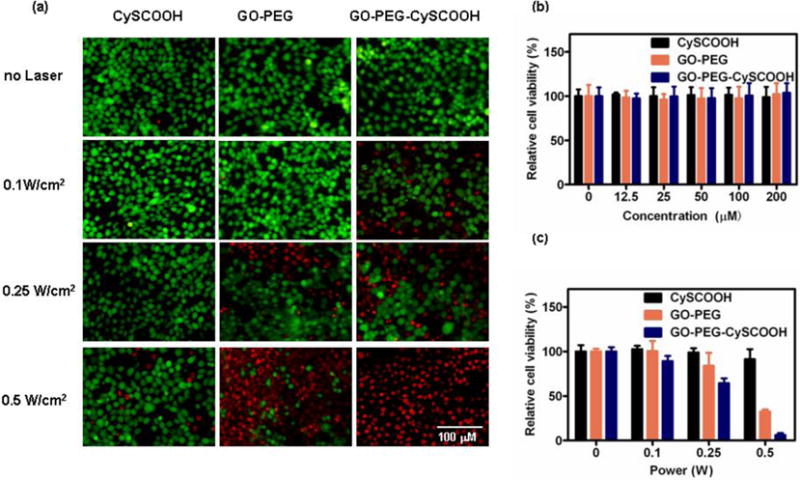
In vitro cell experiments. a) Fluorescence image of Calcein AM/PI co-stained 4T1 cells incubated with 89.7 μg/ml of free CySCOOH, 160 μg/ml of GO-PEG and 250 μg/ml of GO-PEG-CySCOOH (equal to CySCOOH concentration of 100 μM) for 24 h after laser irradiation at different power densities (0.1, 0.25 and 0.5 W/cm2) for 10 min. The cells incubated with same concentration of free CySCOOH, GO-PEG and GO-PEG-CySCOOH without laser irradiation as control group (Scale bars: 100 μm). b) Relative viability of 4T1 cells incubated with various concentrations of free CySCOOH, GO-PEG or GO-PEG-CySCOOH for 24 h .c) Relative viability of 4T1 cells incubated with various concentrations of free CySCOOH, GO-PEG or GO-PEG-CySCOOH after 808- nm laser irradiation at different power densities (0.1, 0.25 and 0.5 W/cm2) for 10 min.
Next, we utilized GO-PEG-CySCOOH as a multifunctional nano-probe for in vivo tumor multimodal imaging. Female nude mice bearing 4T1 tumor models intravenously injected with GO-PEG-CySCOOH (2.34 mg/ml) and free CySCOOH (both contain 0.84 mg/ml of CySCOOH) were imaged by the IVIS in-vivo imaging system. It was found that strong fluorescence signal in the tumor sites after i.v. injection of GO-PEG-CySCOOH for 48 h post injection (p.i.) was found, while fluorescence signal in the tumor treated with free CySCOOH showed very strong signal at the beginning time points and promptly decreased after 1 h p.i, likely owing to that small molecular dye was excreted easily from the body (Figure 3a). Like fluorescence imaging, photoacoustic (PA) imagings of 4T1 tumor models i.v. injected with GO-PEG-CySCOOH and GO-PEG were also carried out p.i at different time points. We found that tumor treated with GO-PEG-CySCOOH showed very strong PA signal compared with free GO-PEG (Figure 3b). The relative PA value of different treated group was measured. The PA signal of GO-PEG-CySCOOH was 5 fold than GO-PEG treated group at 24 h p.i. (Figure 3c). However, following the time, the PA signal was decreased after 48h p.i., likely owing to the excretion of GO-PEG-CySCOOH. Therefore, GO-PEG-CySCOOH exhibited high tumor uptake.
Figure 3.
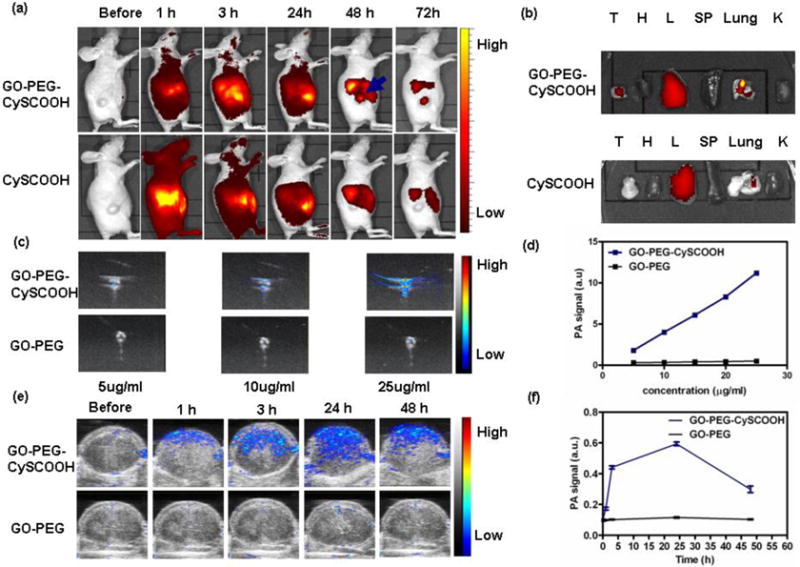
In vivo NIR fluorescence (FL) and photoacoustic (PA) imaging. (a) In vivo FL images of mice i.v. injected with CySCOOH and GO-PEG-CySCOOH at different time points post injection; (b) ex vivo NIR FL images of major tissues (T, tumor; H, heart; L, liver; SP, spleen; lung; K, kidneys), harvested from mice treated with free CySCOOH and GO-PEG-CySCOOH after 24 h treatment (c) Ex vive PA images of GO-PEG and GO-PEG-CySCOOH solution at different concentration (d) Ex vive Relative PA signal intensity of GO-PEG and GO-PEG-CySCOOH solution at different concentration (e) In vivo ultrasonic (US) and PA images of tumor of mice intravenously injected with GO-PEG and GO-PEG-CySCOOH at different time points. (f) Time course PA signal quantification change of tumors followed by intravenous injection of GO-PEG and GO-PEG-CySCOOH. (Error bars represent standard deviation; n = 3 per group)
Motivated by multimodal imaging data, we then used GO-PEG-CySCOOH as thermal agent for in vivo photothermal therapy. Mice bearing 4T1 tumor modal were i.v. injected with CySCOOH (200 μl, 0.84mg/ml) GO-PEG (200 μl, 1.5mg/ml) and GO-PEG-CySCOOH (200 μl, 2.34mg/ml). After 24 h p.i, we then used IR camera to monitor the surface temperature change of tumor and found that the temperature of mice treated with GO-PEG-CySCOOH and 0.5W/cm2 laser irradiation increased by 35°C, which could complete ablate tumor (Figure 4a&b). In contrast, mice treated with GO-PEG and 0.5W/cm2 laser exposure showed just a less increase the surface temperature of tumor, which was very lower than GO-PEG-CySCOOH treated group. In the CySCOOH treated group, the surface temperature of mice showed a less increase (Figure 4a&b). We then utilized GO-PEG-CySCOOH as thermal agent for in vivo photothermal therapy. The tumors of mice i.v. injected with GO-PEG-CySCOOH and laser irradiation at the power density of 0.5 W/cm2 for 5 min (n=7) were completely ablated, while other control groups (7 per group) including free CySCOOH, GO-PEG and GO-PEG-CySCOOH without laser irradiation, free CySCOOH and GO-PEG with laser irradiation showed similar rapid of tumor growth, suggesting that GO-PEG and CySCOOH induced no obvious affect the tumor growth (Figure 5a). The tumors from different treated groups were collected for histology examination. It was found that tumor treated with GO-PEG-CySCOOH and laser irradiation showed significantly damage compared with other control groups (Figure 5c, d). Besides, mice bearing 4T1 tumors treated with GO-PEG-CySCOOH and laser irradiation survived over 60 days without tumor re-growth (Figure 5b), in marked contrast to mice in the five control groups which survived for only an average of 20 days post treatment, further demonstrating the excellent efficacy of GO-PEG-CySCOOH based in vivo photothermal therapy of cancer.
Figure 4.
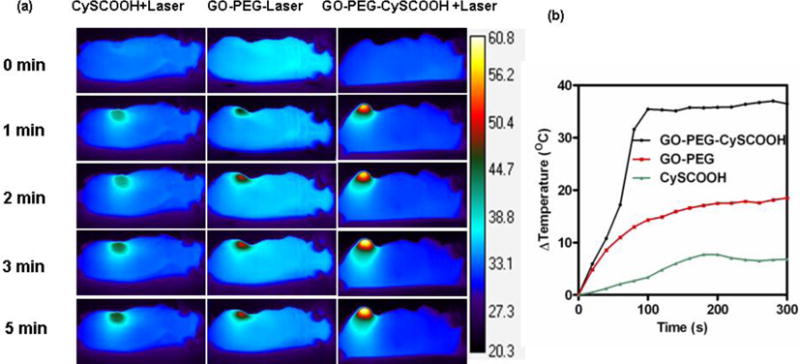
In vivo infrared imaging. (a) Infrared (IR) thermal imaging of mice bearing 4T1 tumor modal injected with free CySCOOH, GO-PEG or GO-PEG-CySCOOH (dose=8.4 mg/kg CySCOOH) and under 808 nm laser exposure. (b) Heating curves of 4T1 tumors upon 808-nm laser irradiation at a power density of 0.5W/cm2 for 10 min.
Figure 5.
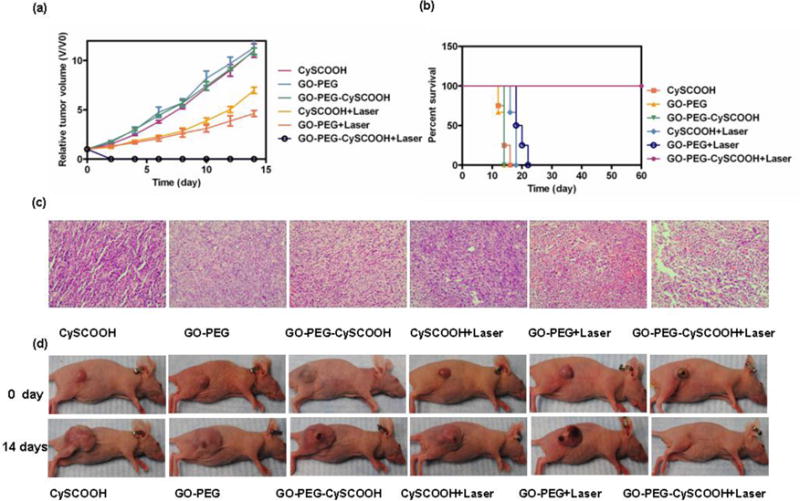
In vivo photothermal therapy. (a) Tumor growth curves of different groups of 4T1 tumor-bearing mice after PTT. Tumor volumes were normalized to their initial sizes. (Error bars represent standard deviation; n = 6 per group P < 0.01). (b) Survival curves of tumor-bearing mice after various treatment (c) H&E staining of tumor sections obtained from different groups at 2 h after laser irradiation. (d) Representative photos of mice bearing 4T1 tumors at difference days after different treatments.
Finally, we investigated the in vivo potential toxicity of GO-PEG-CySCOOH and free CySCOOH with an equivalent CySCOOH dose of 8.4 mg/kg (n = 6/group) (Figure 6). Neither death nor significant body weight drop was noticed after injection (Figure 6a). Meanwhile, we collected the major organs including heart, liver, spleen, lung, kidney from treated mice for H&E staining. During our experiments, no obvious abnormality and tissue damage was observed (Figure 6b), indicating that the GO-PEG-CySCOOH, GO-PEG and free CySCOOH was safe to treated mice at the CySCOOH dose of 8.4 mg/kg. Further toxicological studies are still needed to determine the long-term biocompatibility in animals.
Figure 6.
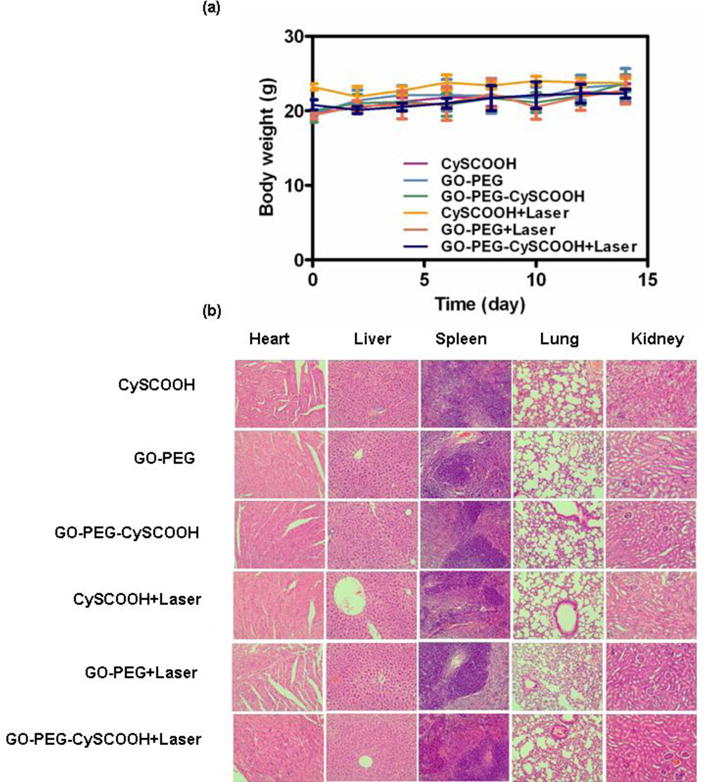
(a) Body weight curve of different treated group. (b) H&E stained images of major organs. No noticeable abnormality and tissue damage was observed in different groups, including heart, liver, spleen, lung and kidney,
Conclusion
We developed a novel graphene based nanocomposite for in vivo multimodal imaging and imaging guided in vivo cancer PTT. Fluorescence dye remarkably enhanced the NIR absorbance of GO-PEG and increased in vivo PTT efficacy. The tumor uptake was also confirmed by fluorescence and photoacoustic imaging, indicating high tumor uptake of GO-PEG-CySCOOH via i.v. injection. With relatively low laser power density irradiation, tumors treated with GO-PEG-CySCOOH were completely ablated after 0.5 W/cm2 laser exposure for 5 min, without re-growth in 60 days. Moreover, GO-PEG-CySCOOH induced no obvious toxicity to treated mice and increased long-term survival of tumor mice following treatment. Our results further confirmed that graphene based nanocomposites could be served as a powerful contrast agent for PA imaging and fluorescence imaging guided in vivo tumor PTT.
Supplementary Material
Acknowledgments
This work was supported by the Intramural Research Program (IRP) of the National Institute of Biomedical Imaging and Bioengineering (NIBIB), National Institutes of Health (NIH), and grants from National Natural Science Foundation of China (81471715, 81201171, 30900359), Hunan healthcare research funds (B2013-06)
References
- 1.Nie L, Chen M, Sun X, Rong P, Zheng N, Chen X. Nanoscale. 2014;6:1271–1276. doi: 10.1039/c3nr05468c. [DOI] [PubMed] [Google Scholar]
- 2.Nie L, Wang S, Wang X, Rong P, Ma Y, Liu G, Huang P, Lu G, Chen X. Small. 2013 doi: 10.1002/smll.201302924. [DOI] [PubMed] [Google Scholar]
- 3.Huynh E, Lovell JF, Helfield BL, Jeon M, Kim C, Goertz DE, Wilson BC, Zheng G. Journal of the American Chemical Society. 2012;134:16464–16467. doi: 10.1021/ja305988f. [DOI] [PubMed] [Google Scholar]
- 4.Rong P, Yang K, Srivastan A, Kiesewetter DO, Yue X, Wang F, Nie L, Bhirde A, Wang Z, Liu Z, Niu G, Wang W, Chen X. Theranostics. 2014;4:229–239. doi: 10.7150/thno.8070. [DOI] [PMC free article] [PubMed] [Google Scholar]
- 5.Lu W, Huang Q, Ku G, Wen X, Zhou M, Guzatov D, Brecht P, Su R, Oraevsky A, Wang LV. Biomaterials. 2010;31:2617–2626. doi: 10.1016/j.biomaterials.2009.12.007. [DOI] [PMC free article] [PubMed] [Google Scholar]
- 6.Lin M, Guo C, Li J, Zhou D, Liu K, Zhang X, Xu T, Zhang H, Wang L, Yang B. ACS applied materials & interfaces. 2014 doi: 10.1021/am500715f. [DOI] [PubMed] [Google Scholar]
- 7.Wang S, Huang P, Nie L, Xing R, Liu D, Wang Z, Lin J, Chen S, Niu G, Lu G. Advanced materials. 2013;25:3055–3061. doi: 10.1002/adma.201204623. [DOI] [PMC free article] [PubMed] [Google Scholar]
- 8.Huang P, Lin J, Li W, Rong P, Wang Z, Wang S, Wang X, Sun X, Aronova M, Niu G. Angewandte Chemie. 2013;125:14208–14214. doi: 10.1002/anie.201308986. [DOI] [PMC free article] [PubMed] [Google Scholar]
- 9.Kim C, Cho EC, Chen J, Song KH, Au L, Favazza C, Zhang Q, Cobley CM, Gao F, Xia Y. ACS nano. 2010;4:4559–4564. doi: 10.1021/nn100736c. [DOI] [PMC free article] [PubMed] [Google Scholar]
- 10.Yang K, Feng L, Shi X, Liu Z. Chemical Society Reviews. 2013;42:530–547. doi: 10.1039/c2cs35342c. [DOI] [PubMed] [Google Scholar]
- 11.Novoselov KS, Geim AK, Morozov S, Jiang D, Zhang Y, Dubonos S, Grigorieva I, Firsov A. Science. 2004;306:666–669. doi: 10.1126/science.1102896. [DOI] [PubMed] [Google Scholar]
- 12.Liu Z, Robinson JT, Sun X, Dai H. Journal of the American Chemical Society. 2008;130:10876–10877. doi: 10.1021/ja803688x. [DOI] [PMC free article] [PubMed] [Google Scholar]
- 13.Feng L, Zhang S, Liu Z. Nanoscale. 2011;3:1252–1257. doi: 10.1039/c0nr00680g. [DOI] [PubMed] [Google Scholar]
- 14.Yang K, Hu L, Ma X, Ye S, Cheng L, Shi X, Li C, Li Y, Liu Z. Advanced materials. 2012;24:1868–1872. doi: 10.1002/adma.201104964. [DOI] [PubMed] [Google Scholar]
- 15.Omid A, Elham G. Acs Nano. 2010;4:5731–5736. [Google Scholar]
- 16.Kai Y, Jianmei W, Shuai Z, Youjiu Z, Shuit-Tong L, Zhuang L. Acs Nano. 2011;5:516–522. [Google Scholar]
- 17.Liu Z, Tabakman S, Welsher K, Dai H. Nano research. 2009;2:85–120. doi: 10.1007/s12274-009-9009-8. [DOI] [PMC free article] [PubMed] [Google Scholar]
Associated Data
This section collects any data citations, data availability statements, or supplementary materials included in this article.


