Abstract
Blood flow patterns and local hemodynamic parameters have been widely associated with the onset and progression of atherosclerosis in the carotid artery. Assessment of these parameters can be performed noninvasively using cine phase-contrast (PC) magnetic resonance imaging (MRI). In addition, in the last two decades, computational fluid dynamics (CFD) simulation in three dimensional models derived from anatomic medical images has been employed to investigate the blood flow in the carotid artery. This study developed a workflow of a subject-specific CFD analysis using MRI to enhance estimating hemodynamics of the carotid artery. Time-of-flight (TOF) MRI scans were used to construct three-dimensional computational models. PC-MRI measurements were utilized to impose the boundary condition at the inlet and a 0-dimensional lumped parameter model was employed for the outflow boundary condition. The choice of different viscosity models of blood flow as a source of uncertainty was studied, by means of the axial velocity, wall shear stress, and oscillatory shear index. The sequence of workflow in CFD analysis was optimized for a healthy subject using PC-MRI. Then, a patient with carotid artery stenosis and its hemodynamic parameters were examined. The simulations indicated that the lumped parameter model used at the outlet gives physiologically reasonable values of hemodynamic parameters. Moreover, the dependence of hemodynamics parameters on the viscosity models was observed to vary for different geometries. Other factors, however, may be required for a more accurate CFD analysis, such as the segmentation and smoothness of the geometrical model, mechanical properties of the artery’s wall, and the prescribed velocity profile at the inlet.
Keywords: Carotid artery bifurcation, WSS, nonlinear viscosity models, Impedance boundary conditions
1. Introduction
Hemodynamics and geometric variables play a crucial role in the appearance and progression of various vascular diseases [1–3]. Specifically, the significance of wall shear stress and flow disturbances in the formation and rupture of an atherosclerotic plaque, which is the leading cause of stroke, is well acknowledged [3, 4]. Research shows that there is an increased chance of atheroma buildup around vessel bifurcations, where the blood flow is stagnant or highly disturbed [5]. Additionally, wall shear stress (WSS) is proposed to be a controlling factor in the mechanism of plaque formation and rupture [6, 7]. These findings have persuaded researchers to grow an interest in the development of techniques that enable them to estimate WSS in vivo.
Through phase-contrast (PC) magnetic resonance imaging (MRI) velocity measurements, qualitative and quantitative assessment of WSS is possible [8–10]. Essentially, PC-MRI measures the blood and tissue velocity at each point in the field of view. However, the relatively low spatial in-plane resolution of the image and difficulty in circumferential wall’s detection obstructs an accurate estimation of WSS [11]. Another approach is to investigate WSS by employing the computational fluid dynamic (CFD) simulation of the blood flow in patient specific models. Essential components of carrying out such simulations require accurate anatomic models, imposition of realistic boundary conditions, utilization of an appropriate viscosity model, and inclusion of the wall elasticity [4,12–18].
Although accurate segmentation of blood vessels is a crucial step in analysis of blood circulation inside the body [19,20], realistic boundary conditions are suggested to be as important for accurately estimating the flow rate with three-dimensional CFD simulations [21]. Several approaches have been proposed to impose physiologically realistic boundary conditions. A common boundary condition type is the resistance boundary condition. This boundary condition does not require any specification of flow rate or pressure at the outlet. However, the resultant flow and pressure waves are forced to be in the same phase in the resistance boundary condition, which violates the wave propagation phenomena [13,22]. An alternative method is to use 1D method to solve the periodic blood flow in downstream vessels to provide boundary condition for the 3D computational domain [23,24]. Solution to a large number of downstream vessels, however, requires some simplifications, which leads to restriction of the method to periodicity of the blood flow. Therefore, a 0D model is proposed to track the dynamic nature of time dependent flow in human arteries [13,25,26]. The 0D modeling approach utilizes the concept of a hydraulic-electrical analogue which is known as the Windkessel model [27]. By prescription of an impedance of the downstream vessels at the outlets, the Windkessel model will facilitate the imposition of realistic boundary conditions for 3D simulations of blood flow.
While most hemodynamic simulations employ the Newtonian model for arterial flow, during the past decade several studies have suggested that appropriate nonlinear viscosity models should take an account of the key factors in hemodynamics simulations [12,28]. Such shear rate dependent-viscosity models have been proposed in literature, most commonly using Power-law, Carreau-Yasuda, and Casson models. Regardless, the viscosity of the blood is dependent on several factors such as the hematocrit level. In contrast, other studies have suggested that the nonlinear effect is negligible in large arteries such as carotid arteries [29,30]. Therefore, this study aims to investigate the nonlinear effect on hemodynamics factors and further improve the procedure to quantify uncertainties using PC-MRI measurements. Although several studies have shown that these simplifications are acceptable for hemodynamic simulation [30], there is still need to perform simulations as realistic as possible. To model a realistic hemodynamic simulation in large arteries completely, the deformability of the arteries’ walls should also be considered. However, for the sake of simplicity, rigid walls are assumed in this paper.
This paper is structured as follows: Methods section illustrates several steps towards a hemodynamic simulation in a healthy carotid artery, starting from raw anatomical MR images. One 3D subject specific model is generated by segmentation of the MRI scan. Using PC-MRI velocity measurements, the flow waveform at the inlet is computed. Consequently, an initial set of simulations is performed to achieve the most appropriate 0D outflow boundary conditions. Using the aforementioned boundary condition approach, the simulation is performed for four different viscosity models, Newtonian, Power-law, Carreau-Yasuda, and Casson. The objective here is to develop a workflow to provide more realistic blood flow simulations using the physiological boundary conditions and also to investigate the uncertainty of non-Newtonian blood flow that aids to design of clinical applications in future. Results section first reports the initial simulation and evaluates the validity of the outflow boundary conditions. Then, the comparison between different models and PC-MRI measurements are presented. Besides, mean wall shear stress, WSS at peak systole, and oscillatory shear index (OSI) for different viscosity models is delineated. Finally, a set of simulation is performed for another subject-specific model with an atherosclerotic carotid artery plaque, to understand how the geometry affects the flow pattern and wall shear stress distribution in a human artery.
2. Methods
2.1. Image acquisition and segmentation
This study was approved by the Internal Review Board at Michigan State University.
Two individual subjects (one healthy subject and one patient with carotid artery stenosis) were scanned on a GE 3T Signa® HDx MR scanner (GE Healthcare, Waukesha, WI). Time of flight (TOF) MRI scans were extracted from the set of 3D images and imported to an image processing software package, MIMICS® (Materialize, Leuven, Belgium). Using thresholding and region growing segmentation techniques, geometrical solid models of blood vessels are constructed. After the initial segmentation, the 3D model underwent several steps of smoothening. Finally, 3D blood vessel models were transferred to an automatic mesh generator.
2.2. Blood flow measurement
Blood flow velocity data with three directions at 16 equidistant time frames of the cardiac cycle were acquired using two dimensional (2-D) time-resolved (Cine) phase contrast (PC) techniques from the healthy subject. The velocity components in three directions were acquired at seven contiguous axial slices at, above and below the carotid bifurcation. All data were acquired in synchrony with the cardiac cycle. A slice at the common carotid artery was chosen for flow quantification. Since flow was almost unidirectional at the peak systole, the corresponding speed image at this time point was chosen for the delineation of the carotid artery wall on the PC-MRI images. By segmenting the lumen and then integrating the axial velocity over the lumen, the flow waveform inside the carotid artery was computed. Similar approach was used to compute the flow waveforms split between two branches of the carotid artery.
2.3. Blood flow modeling
Blood flow was mathematically modeled by the Navier-Stokes equations. The conservation of mass and momentum for an incompressible fluid in three dimensions can be expressed as
| (1) |
| (2) |
where ρ is the constant density, ν is the velocity vector, σ is the stress tensor, and f is the external or body force which is assumed zero in our simulations. The stress tensor can be decomposed to hydrostatic and deviatoric stresses
| (3) |
where p is the pressure, I is the identity tensor, and τ is the deviatoric stress tensor which is a function of the shear rate tensor (D)
| (4) |
where μ is the dynamic blood viscosity, and γ̇ is the shear rate. In addition, the shear rate tensor is defined as follows
| (5) |
Finally, γ̇ is defined by a function of D:
| (6) |
To employ the system of equations, constitutive equations are needed to calculate the viscosity of the blood. Previously, a variety of constitutive equations have been proposed to model blood flow. The simplest model is a Newtonian fluid which assumes a constant viscosity (μ = μ0). Recent studies, however, suggested that the shear dependent viscosity models can accurately capture shear-thinning nature of blood flow. The most common non-Newtonian models used for the blood are the power law, Casson, and Carreau-Yasuda models [12]. The power law model can be expressed in the following from
| (7) |
where k is the flow consistency index and n is the power law index, showing the non-Newtonian behavior of the blood [31]. This mathematical description is one of the simplest models used for representing the behavior of a non-Newtonian fluid. However, since this model ranges from zero shear rates to infinity when shear rate approaches zero, only values in the realistic range can approximate a non-Newtonian fluid behavior. The power law index is usually chosen so that the model reproduces the shear thinning behavior of the blood in hemodynamic simulations. Regardless, both k and n depend the components of blood, mainly hematocrit, and are subject to change for each individual [16,29]. The Casson model takes into account not only the shear thinning behavior but also the yield stress of the blood. Specifically, this model is used for blood flow at low shear rates in narrow arteries [32]. Following equation gives the dynamic viscosity with regards to this viscosity model
| (8) |
where τ0 is the yield stress and μ0 is the Newtonian viscosity. In addition, parameter m controls the viscosity when shear rate tends to zero.
The last model considered in this paper is the Carreau-Yasuda model. This model, similar to power law, is a generalization of the Newtonian model. However, Carreau-Yasuda model better fits the experimental data on the viscosity and shear rate relationship [16].
| (9) |
where μ0 is the viscosity at zero shear rate, μinf is the viscosity at infinite shear rate, λ is the relaxation time, and n is the power index. The parameters λ and n control the slope and transitions in the power law regions.
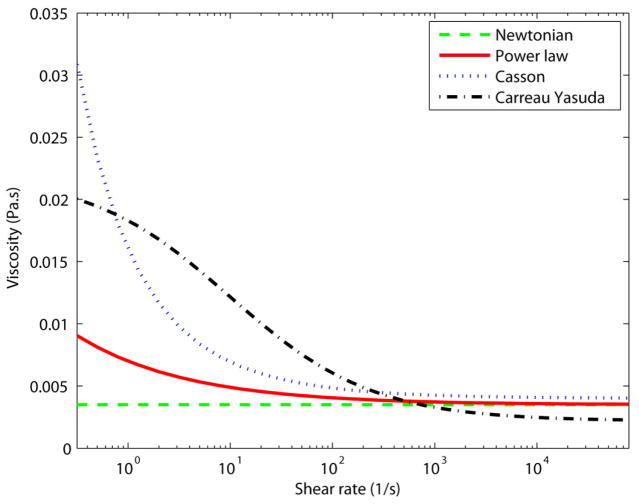
The parameters used for each viscosity model are summarized in Table 1. The shear rate dependence of all viscosity models is demonstrated in Fig. 1.
Table 1.
| Viscosity model | Parameters |
|---|---|
| Newtonian | μ =0.0035 Pa.s |
| Power law |
k =0.0035 n =0.6 |
| Casson |
τ0 =0.004 Pa μ0 =0.004 Pa.s m =100 |
| Carreau-Yasuda |
μ0 =0.022 Pa.s μinf =0.002 Pa.s λ =0.11 s n =0.392 a=2 |
Figure 1.
The viscosity as a function of the shear rate for different viscosity models.
Finite volume scheme was implemented to solve the 3D unsteady Navier-Stokes using a software package, ANSYS FLUENT CFD (ANSYS Inc., Canonsburg, PA). Carotid artery walls were considered rigid and with no-slip boundary condition. As the inlet boundary condition, an interpolation of the time dependent flow wave computed from the healthy subject’s PC-MRI scans was prescribed with a parabolic profile radially in space.
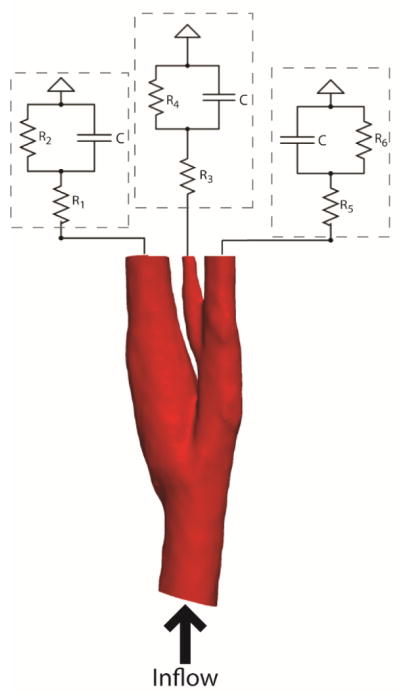
Hemodynamics conditions were applied at the outlets in terms of a proximal resistance Rp, for large arteries and arterioles, a vessel capacitance C, for large arteries’ wall compliance, and a distal resistance Rd, simulating small arterioles and capillaries. This model is called Resistance-Capacitance-Resistance (RCR), or Windkessel, model. The downstream pressure is expressed through an ordinary differential equation similar to the relation between voltage and current in electric circuits [34]
| (10) |
where i(t) represents the flow rate and p(t) is the time dependent pressure. Assuming that the flow rate is known from measurements, the pressure waveform at the outlet can be computed and applied at the boundaries for flow simulation. A schematic figure showing the electrical circuits at the outlets is given in Fig. 2.
Figure 2.
Simulation setup for modeling carotid flow, electrical circuit models coupled with 3D anatomical model
To realistically estimate the RCR parameters for each outlet, however, the values should be tuned so that they match the clinical data, for instance pressure measured in the patient. Since patient specific data was not available for the present subjects, common peak systolic and diastolic pressures for a healthy person were used as target values. A software package, SimVascular (open source, https://simtk.org/home/simvascular), was used for the estimation of the RCR parameters. This package provides a finite element tool to simulate blood flow through human arteries with the RCR parameters directly set at the outlets. For the estimation, first, an optimization algorithm was used to initially set reasonable values. Then using SimVascular, an initial simulation was performed and the resultant pressure waveforms at the outlets were observed. The RCR values were then changed manually with regards to the recorded pressure waveform and the next simulation was performed. This process was repeated until the systolic and diastolic pressures matched the desired values. Finally, the last pressure waveforms were prescribed at the outlets.
Hemodynamic wall parameters were investigated in terms of time averaged wall shear stress (TAWSS) and oscillatory shear index (OSI), defined as following
| (11) |
| (12) |
Where T is the cardiac cycle duration and τw is the shear stress at the wall of the aorta (Eq. 4). These metrics are widely used as metrics for quantification of flow disturbances and finding correlation between flow properties and morphological conditions [1,35]. In particular, OSI monitors the variation of τw during a cycle and can vary from zero to 0.5.
2.4. Comparison between the CFD model and PC-MRI
Since the PC-MRI scans were taken from given locations with regards to a reference from MRI machine, the axial location of slices along the carotid artery were known. Therefore, by employing the junction point on the TOF-MRI as the reference point, the pairs of corresponding axial slices on PC-MRI and CFD model were determined. Similar to the flow rate calculation, the circumference of the carotid artery was delineated in the peak systolic phase where the flow is in axial direction at all locations of the lumen. Manual alignment was also applied to ensure that the centroids of the two arterial cross sections matched with each other. To conduct a comparative study between PC-MRI and the CFD model, this process was carried out manually for two slices, one below and one above the carotid bifurcation. Lastly, the difference between axial velocity from measurements and CFD simulations was investigated.
2.5. General framework of patient specific simulations
Overall, a 3D subject-specific modeling started with TOF-MRI and PC-MRI data. Using TOF-MRI, the medical images were segmented to construct a suitable anatomic model for the simulation. The next step was to perform a number of simulations iteratively to obtain the correct RCR values. The viscosity model was another factor that needed to be investigated. Four different viscosity models were assessed in this paper. The final step before reaching reliable results was to validate the results versus in vivo MRI data.
3. Results
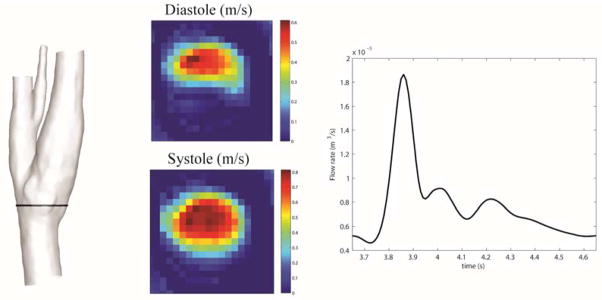
Basic segmentation and integration on PC-MRI velocity measurements for the healthy subject provided the time dependent flow rate in a healthy common carotid artery (CCA). Figure 4 shows the velocity measurements at the peak systolic and diastolic phases at a CCA slice.
Figure 4.
Left: location of PC-MRI on the segmented model. Middle: velocity measurements for peak systolic and diastole. Right: Interpolated flow waveform for one cardiac cycle.
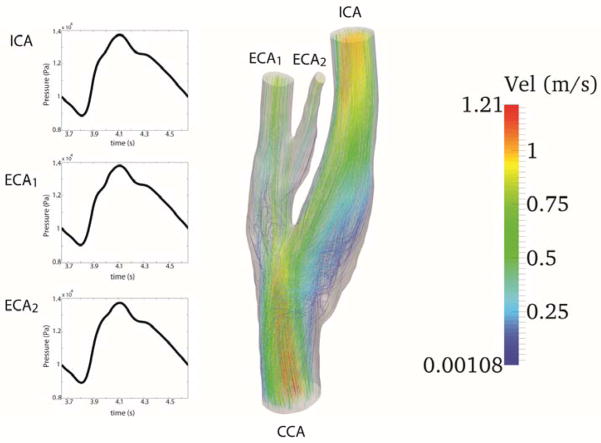
Using the computed waveform at the inlet, a series of simulations on a relatively coarse mesh were performed to obtain the appropriate time varying pressure at the outlet. The targeted systolic and diastolic pressures at all outlets were 110 and 70 mmHg, respectively. Figure 5 shows the resultant streamlines and pressure waveforms for the fourth cardiac cycle. Table 2 shows the values of optimal RCR parameters used to obtain the appropriate pressure waveform.
Figure 5.
The figure illustrates the waveform at the inlet (CCA) and the pressure waveforms at each outlet, internal carotid artery (ICA), external carotid artery (ECA1), and the small vessel which branches from ECA1 (ECA2). At the right streamlines for a Newtonian viscosity model are depicted.
Table 2.
Parameters used for RCR
| R [Pa.s/m3] | C [m3/Pa] | R [Pa.s/m3] | |
|---|---|---|---|
| ICA | 1.11 × 10⁶ | 4.2 × 10⁻¹³ | 8.15 × 10¹¹ |
| ECA1 | 2.27 × 10⁶ | 2.70 × 10⁻¹³ | 4.07 × 10¹² |
| ECA2 | 1.33 × 10⁵ | 6.90 × 10⁻¹³ | 2.81 × 10¹¹ |
There is a time shift between the maximum flow and maximum pressure during the cardiac cycle. This time delay is due to the compliance of the downstream vasculature which is reflected in the simulations via capacitance term in the RCR model. Artificial extensions at the outlet were used as a treatment to prevent backflow divergence. The streamlines exiting the domain at the outlets (shown in Fig. 5) clearly display undisturbed flow at the outlets.
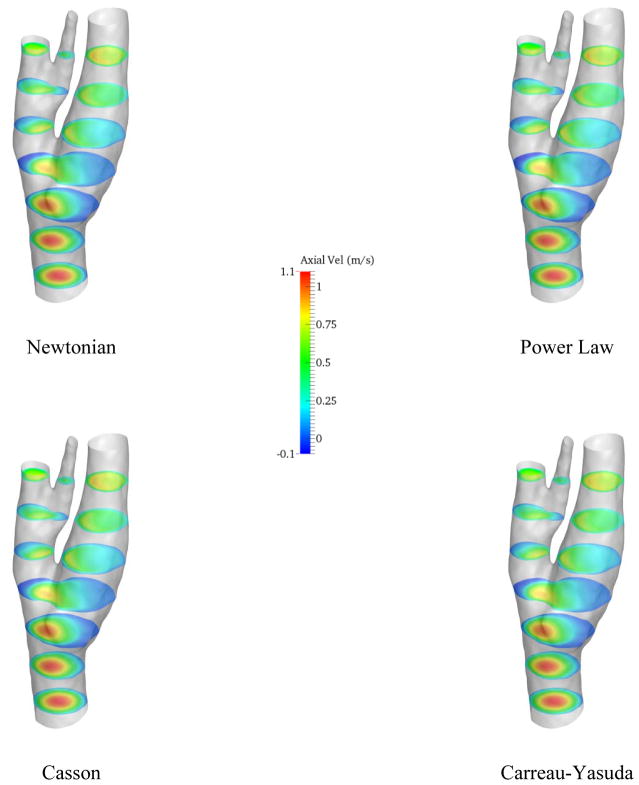
In the next step, a CFD analysis was performed using the computed wave forms as boundary conditions for a 1 million element mesh with time step of 0.005 s for 4 cardiac cycles. The heart rate was assumed 60 bpm for all the simulations. The simulations were performed for different viscosity models and the axial velocity contours on axial slices are represented in Fig. 6.
Figure 6.
Axial velocity on different axial slices
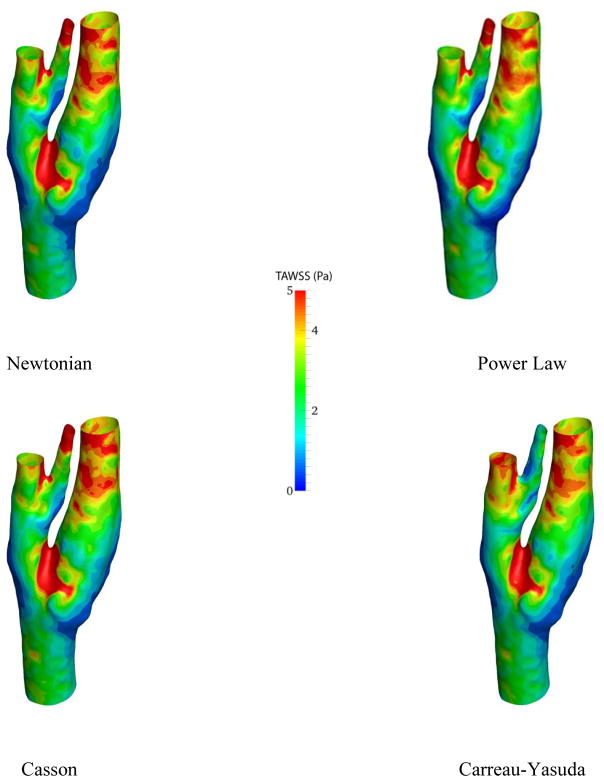
On the slice right below the bifurcation, negative axial velocity is present which implies that the blood is recirculating around this area. The recirculation zone can also be detected from the streamlines in Fig. 5. Moreover, the velocity profiles do not vary drastically from model to model, as it can be observed in Fig. 6. However, near the recirculation zone where the velocity magnitude is the lower, slightly different contour lines can be noticed. The distribution of time averaged wall shear stress (TAWSS) on the carotid artery wall is demonstrated in Fig. 7.
Figure 7.
Average of wall shear stress over one cardiac cycle for different viscosity models
The difference between different viscosity models can be illustrated through wall shear stress contours. For instance, near carotid sinus, where the carotid artery expands, dissimilar contour lines are observable. Besides, the lowest TAWSS is seen in this region. This is especially important for the researchers because carotid sinus is the location where the plaque accumulates. As expected, the highest wall shear stress occurs near the junction points due to high velocity gradients.
Figure 8 shows the magnitude of WSS for the Newtonian model at the peak systolic. The distribution of WSS at the peak systolic is similar to that of TAWSS, albeit higher values: The wall shear stress has the highest near the inner wall of the carotid bifurcation and conversely, the carotid bulb displays low wall shear stresses.
Figure 8.
The magnitude of wall shear stress at the peak systolic
Similar to what was observed in other studies [36], the results show that the blood flow is predominantly unidirectional during the cardiac cycle for the healthy patient, and therefore, OSI is almost zero everywhere on the whole circumference of the domain.
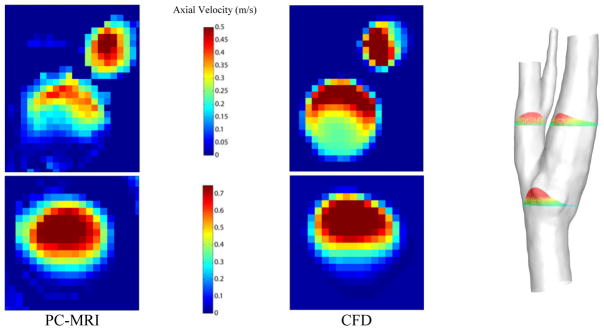
A qualitative analogy of the axial velocity profiles at the peak systolic from PC-MRI data and CFD results is shown in Fig. 9. To avoid redundancy, only the results from Newtonian simulation are plotted here.
Figure 9.
The PC-MRI axial velocity measurements on two slices before and after the carotid biurcation (left panel). The spatially averaged velocity profiles on the respective slices (middle panel). Location of slices on axial direction on the anatomical model (left panel).
On both pair of slices the calculated maximum velocity is overestimated by almost 30% in CFD simulations, although the total flow rate is the same. However, on the lower slice, the velocity distribution is inclined to the upper side for both measurement and simulation. In addition, on the slice above the junction point, the profiles are very similar to each other. The regions with low and high axial velocity are more distinguishable in this slice. Regardless, it should be considered that the delineation of the carotid artery wall on velocity measurement images is not exact. Additionally, the movement of the deformable artery wall is completely neglected in the CFD simulations.
In the next step, CFD simulations were performed on a carotid artery with atherosclerotic plaque. The same pulsatile flow at the inlet and pressure at the outlets were implemented to assess the effect of carotid stenosis, because the velocity measurements were not available for the patient. A total of 1.1 million elements were utilized and solution was computed with time resolution of 0.005 s for four cardiac cycles.
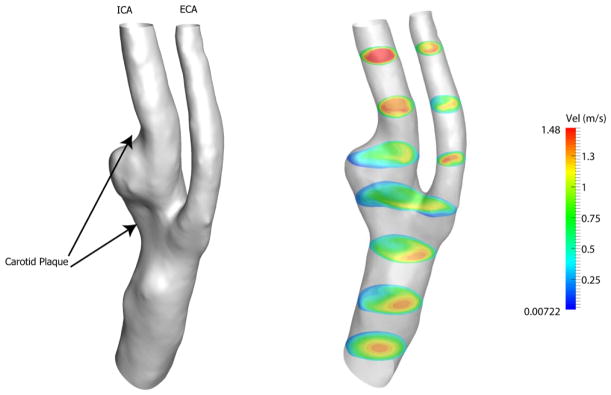
Figure 10 depicts the anatomical model and the velocity contours for the patient model. Since the geometry is obviously more tortuous, the blood flow is more unpredictable in this case.
Figure 10.
Left panel shows the view of the anatomic model for the patient with carotid artery plaque. Axial velocity on several slices along the axial direction at peak systole is depicted on the right.
Starting from the inlet, the velocity profile is almost parabolic at the beginning. As the flow approaches the plaque and bifurcation region, it follows the geometry of the unhealthy carotid artery. Recirculation regions appear near the carotid sinus throughout the cardiac cycle. In addition, low velocity flow occurs near the carotid bifurcation and carotid sinus. However, the flow seems to be fully developed superior to the ICA.
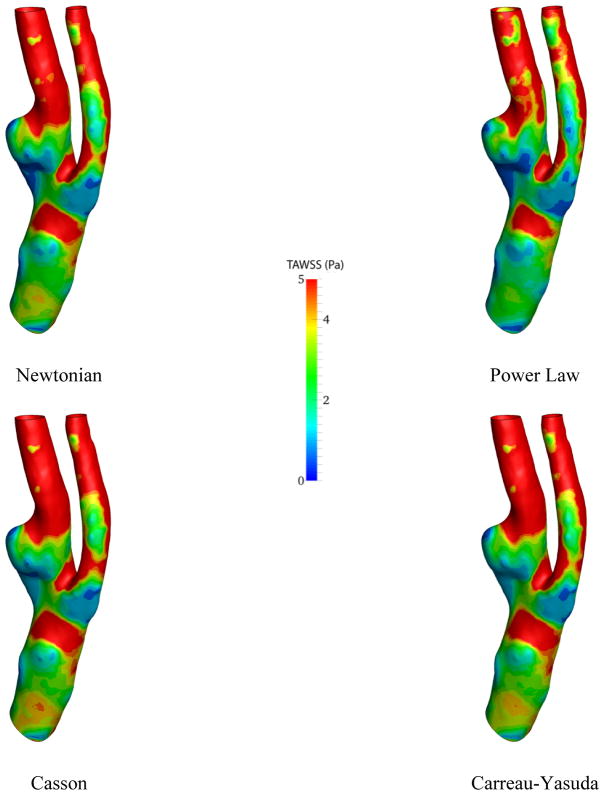
The results of simulation for different viscosity models are presented only in terms of TAWSS and OSI. Figure 11 illustrates the resulting TAWSS from CFD analysis.
Figure 11.
Time-average of wall shear stress over one cardiac cycle for different viscosity models
Although the Power-law and Newtonian models are very similar to each other, the discrepancy in the TAWSS is more noticeable in the patient carotid artery model than that of the healthy subject, particularly around the plaque region. Near the outlet region of the ECA, the Newtonian model shows higher values. The maximum TAWSS for the Newtonian model is 32.5 Pa while it is predicted by the Power-law model almost 27% lower, relatively. Additionally, the Casson and Carreau-Yasuda models predict +7% and −11% change in maximum TAWSS relative to that of the Newtonian model.
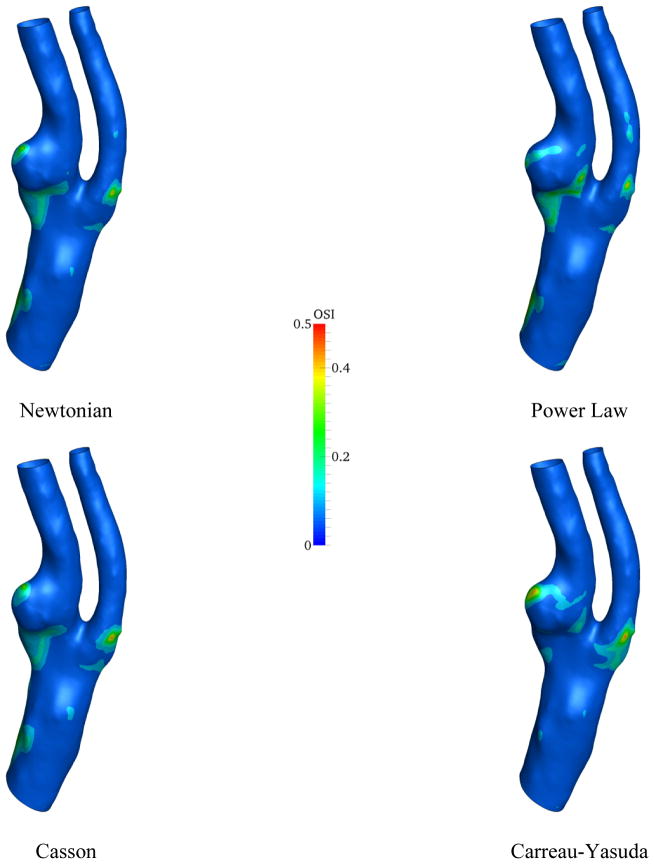
The similar set of plots was produced for the OSI in the patient model, Fig. 12.
Figure 12.
The contour of the OSI for different viscosity models
The highest oscillations in the wall shear stress occur in vicinity of the carotid plaque. The most important region with relatively high OSI is near to the carotid plaque at the root of the ICA. Clearly, this region almost disappears in CFD simulation using Carreau-Yasuda model and has its strongest appearance in Power-law model. In addition to the viscosity model, the vessel geometry clearly plays a crucial role in the directional oscillation of wall shear stress.
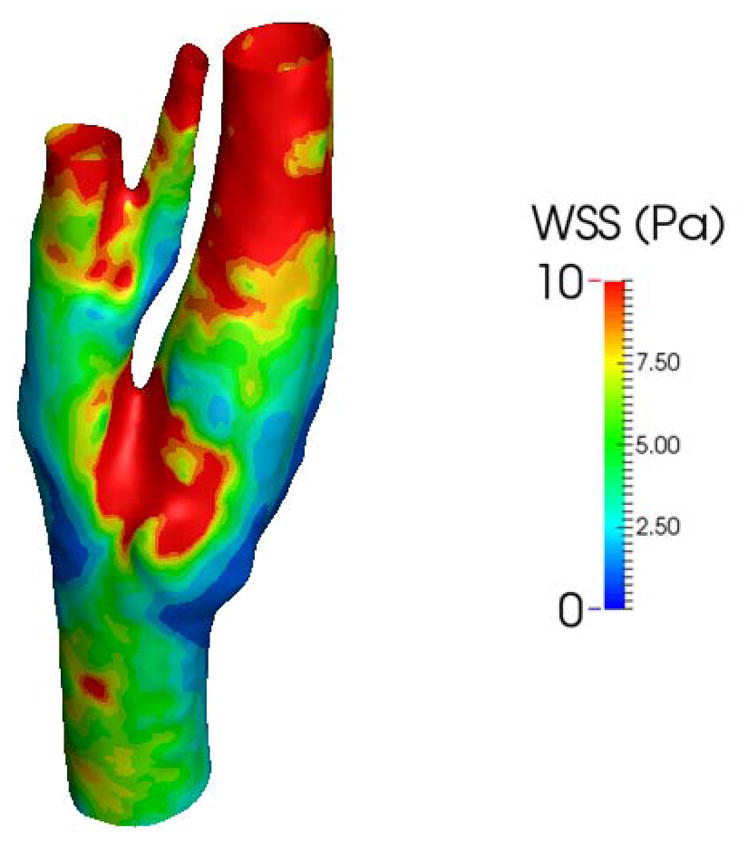
The distribution of peak systolic wall shear stress for the patient model using a Newtonian fluid is shown in Fig. 13. Since the diameters over the range in the patient’s model are smaller than those of the healthy model, the simulation shows that larger portions of the carotid artery wall are highlighted with high wall shear stress. Interestingly, near the carotid sinus and where the plaque has formed, notable lower wall shear stress is observed, probably due to flow recirculation with low velocity gradient. By comparing Figs. 12 and 13, however, similar patterns of OSI and WSS magnitude can be observed around the areas that carotid plaque is present.
Figure 13.
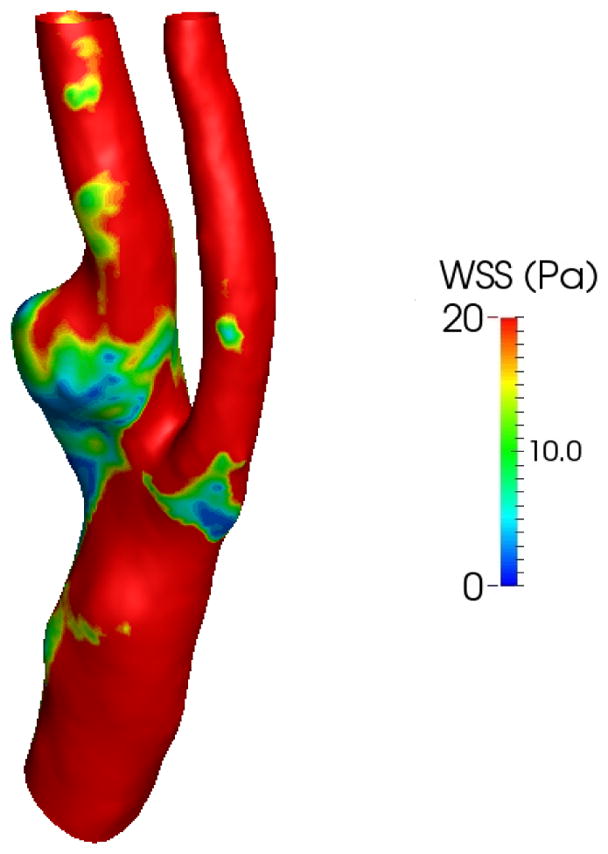
Wall shear stress at peak systole for the patient model
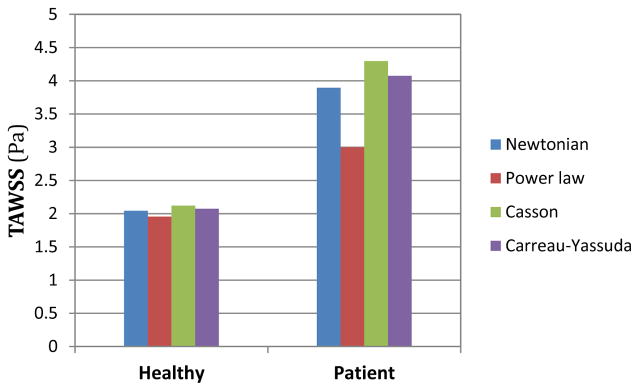
The following bar plot compares the average of TAWSS over the computational domain for the two understudy artery models and different viscosity models.
As shown in Fig. 14 averaged wall shear stress for the healthy subject is very close to 2 Pa for all the viscosity models. In contrast, TAWSS varies more considerably for the patient. Particularly, TAWSS is 10% higher for the Casson model than the Newtonian model, whereas TAWSS for the Power-law model is 22% lower. It is worthy to note that in both anatomic models, the Casson and Power-law models seem to provide highest and lowest values, respectively.
Figure 14.
The different spatially averaged TAWSS for two geometries and viscosity models
4. Discussion
The present paper constructed two subject-specific carotid artery geometrical models and developed the workflow using MRI to study the blood flow. The ability of effectively simulating the flow and pressure in a carotid artery is essential for researchers to either model the performance of medical devices or predict the evolution of a vascular pathology [5,37]. Fundamentally, velocity measurements through PC-MRI can be useful for quantification of different flow metrics, such as TAWSS and OSI [5]. However, there are major drawbacks associated with this technique, for instance, difficulties in outlining the artery’s wall [38] and quantification of the velocities in geometrically tortuous regions [39]. Alternatively, the combination of medical imaging data with CFD analysis has been widely used in the research community.
The PC-MRI offers a valuable tool to provide complementary data for a subject-specific CFD analysis. A simple segmentation and integration of the PC-MRI data measured in the CCA produced the flow rate over a cardiac cycle. The complete velocity measurements (Fig. 4), however, are not adequate for a direct hemodynamics study. In addition to a relatively low spatial resolution, the low velocity magnitude, seen in the lower half of the image (middle panel of Fig. 4), hampers an accurate determination of the local wall shear stress on the slice corresponding to the diastole [5].
Pressure measurements for a subject contributed to acquiring a more realistic CFD simulation through implementation of RCR boundary conditions. Via an iterative process, the RCR values (Table 2) were estimated for a pressure waveform with high and low of 110 and 70 mmHg, respectively (Fig 5). The pressure lags the flow by 0.25s which is similar what was observed empirically in [40]. Therefore, regarding the pressure waveforms, the RCR boundary condition seems to have captured the physiologic behavior of carotid flow. However, to obtain the appropriate subject-specific RCR values, the pressure should be measured at the same time the scans are taken.
Figure 6 shows variations in the simulation results across four different viscosity models by means of the axial velocity. Considering the size of the carotid artery and the input flow rate, the shear rate is relatively high (>102 s−1) in the most parts of the computational domain. Thus, derived viscosities from all the models are almost constant (Fig 1) and naturally, the velocity profiles are marginally altered in the healthy model. Conversely, the strain rate is lower near the carotid bulb, where the flow recirculated, which led to discrepancies in the simulated flow field. The dissimilarity between different viscosity models is more observable through wall shear stress metrics (Figs 7, 11, and 12). Especially in Fig. 11, different TAWSS distributions for different viscosity approximations are clearer. It is worthy to mention that the distributions of wall shear stress in this figure show similar pattern of TAWSS of Lee et al [41] study using a Casson blood flow simulation of a deformable wall, carotid bifurcation model. Regardless, the results suggest a relatively low sensitivity of TAWSS to the viscosity model, which is consistent with respect to other studies [29], [42–45]. Notably, Lee and Steinman [45] suggested that using non-Newtonian viscosity models for patient specific simulations may not be practically efficient, considering other sources of uncertainties. Moreover, they suggested that the sensitivity of the OSI and TAWSS to the viscosity model is of the order of 10%. In addition, Morbiducci et al. [44] suggested that whether the viscosity model is important as a source of uncertainty is dependent on the model’s geometry. The latter finding is in agreement with the results in this paper.
The variability of wall shear stress metrics (TAWSS, peak systolic WSS, and OSI), however, is reliant on the complexity of the model geometry. For example, for a healthy carotid artery, the OSI is almost zero everywhere on the circumference of the carotid artery, which is congruous with [36]. On the other hand, the OSI is considerable around certain regions for the stenosis patient’s model (Fig. 12). Moreover, the core region of elevated OSI at the carotid sinus is characterized by low time averaged and peak systolic WSS, which is also reported in [35]. It is worthy to mention the similarity between contour lines of OSI and WSS magnitude around the carotid plaque for the patient model (Figs. 12 and 13). This may provide some insight in the correlation between plaque formation and rupture, and WSS metrics which requires a larger dataset and further investigation. Nonetheless, the low and oscillating wall shear stress are highly used in the biomechanical research community as controlling factors in atherogenesis [1].
Despite the difference in flatness of velocity profiles (Fig 9), reasonable qualitative agreement is found on the velocity measurements between the PC-MRI and the CFD simulations. Similar results were observed in Steinman et al. [39] for carotid bifurcation, in Boussel et al. [43] for intracranial aneurysms, and in Yiallourou et al. [46] for cerebrospinal fluid simulations. The flatness of the measured velocity profiles, particularly at the slice below the bifurcation, suggests that the flow may not be fully developed at this location, in spite of the fully developed parabolic profile that was implemented at the inlet. This disturbed profile is the result of the existence of helical and secondary flows near the carotid bulb.
During the three dimensional model reconstructions, the geometry experienced several steps of smoothening which may erase some local geometrical properties of the model. In addition to the quality of image data, a number of simplifications were made to facilitate the CFD simulation process. Although, many studies have successfully simulated blood flow in three dimensional deformable models [13,41,47–49], the artery’s wall was assumed to be rigid, which is reported to be an acceptable assumption for large arteries [30].
Regarding the inlet boundary condition, this study employed a prescribed parabolic velocity profile. One limitation of this approach, however, is not taking into account the effect of helical flow at the inlet which may contribute to change in wall shear stress in downstream [50]. Regardless, although the prescription of the inlet boundary condition has shown to be of less significance in comparison with the geometry reconstruction [14], multiple studies have evaluated influence on different inlet boundary conditions of the carotid artery [51–53]. Moreover, the use of the simple RCR boundary conditions, constant flow division, and the flow being fully developed at the outlets are other important assumptions. Nevertheless, many studies have been in favor of 0D lumped model and multi-scale coupling for hemodynamics simulations [13,37,44]. However, Balossino et al. [54] suggested that using a lumped parameter model can be replaced by prescription of the velocity profile at one outlet, and zero normal stress at the other outlet, to obtain similar results at the region of interest. In addition, using general viscosity models was another approximation considered in this paper. The rheology of the blood is dependent on many subject-specific factors such as hematocrit levels [29,55]. Nonetheless, based on what was observed in this study and similar studies, the difference in wall shear stress due to the viscosity is relatively small in comparison with its variation among different geometries [45]. The non-stenotic case’s boundary conditions were used for the patient model which may introduce incoherence in the simulation, because of the altered velocity profiles and downstream conditions when plaque is present. Finally, blood flow in large arteries was considered laminar under normal physiologic conditions. However, physiological conditions may cause turbulence in the flow which brings about the requirement for a new approach for the hemodynamics modeling.
This paper provided a workflow for hemodynamic simulation at carotid bifurcation using imaging data. In addition, multiple limitations from simplifications and uncertainties in each step of the simulation were reported. For instance, blood viscosity can be related to a variety of factors whose measurements may not be available for researchers. Furthermore, realistic boundary conditions at the outlet require several flow rate and pressure measurements at the same time the image is taken. Besides, this simulation only corresponds to the subject’s condition in which the scan is taken. Another uncertainty associated with the simulation is the rigidity of the wall assumed in this paper.
In closing, regardless of the simplifications, the general procedure presented in this study captured many physiological aspects of blood flow in human arteries. Patient-specific velocity measurements were successfully integrated with numerical study to investigate the blood flow in vivo. Moreover, the RCR boundary condition seems to be an appropriate and efficient way to prescribe the flow at the outlet. In addition, the importance of the application of different viscosity models appears to be dependent on the geometry of the carotid artery.
Based on a sensitivity study, a future work will need to perform an uncertainty analysis on the aforementioned variables, such as deformable wall, in CFD simulations and optimizing the best models, so that a meaningful comparison of CFD results with blood flow measurements will improve the prediction of rupture risk of carotid plaques. Furthermore, a multivariable study of geometrical biomarker’s, and hemodynamic investigations will identify the key variables using a large dataset, providing physicians to decide the surgical time, if needed, and to aid clinical management.
Figure 3.
Outline of the workflow of a patient specific hemodynamics simulation
Acknowledgments
Authors gratefully acknowledge the support, in part, by the National Heart, Lung, and Blood Instintute of the National Institutes of Health (R21HL113857) and National Science Foundation (CMMI-1150376). The contents of solely the responsibility of the authors and does not necessarily represent the official views of the National Instututes of Health.
Authors would also like to gratefully acknowledge Simmetrix, Inc. (http://www.simmetrix.com) for offering software licensing of the MeshSim mesh generation library, and Dr. Nathan Wilson for offering SimVascular software package and his assistance.
References
- 1.Ku DN, Giddens DP, Zarins CK, Glagov S. Pulsatile flow and atherosclerosis in the human carotid bifurcation. Positive correlation between plaque location and low oscillating shear stress. Arteriosclerosis. 1985;5:293–302. doi: 10.1161/01.atv.5.3.293. [DOI] [PubMed] [Google Scholar]
- 2.Marshall I, Zhao S, Papathanasopoulou P, Hoskins P, Xu Y. MRI and CFD studies of pulsatile flow in healthy and stenosed carotid bifurcation models. J Biomech. 2004;37:679–87. doi: 10.1016/j.jbiomech.2003.09.032. [DOI] [PubMed] [Google Scholar]
- 3.Yim P, Demarco KJ, Castro MA, Cebral J. Characterization of shear stress on the wall of the carotid artery using magnetic resonance imaging and computational fluid dynamics. Stud Health Technol Inform. 2005;113:412–42. [PubMed] [Google Scholar]
- 4.Bluestein D, Alemu Y, Avrahami I, Gharib M, Dumont K, Ricotta JJ, Einav S. Influence of microcalcifications on vulnerable plaque mechanics using FSI modeling. J Biomech. 2008;41:1111–18. doi: 10.1016/j.jbiomech.2007.11.029. [DOI] [PubMed] [Google Scholar]
- 5.Papathanasopoulou P, Zhao S, Köhler U, Robertson MB, Long Q, Hoskins P, Xu X, Marshall I. MRI measurement of time-resolved wall shear stress vectors in a carotid bifurcation model, and comparison with CFD predictions. J Magn Reson Imaging. 2003;17:153–62. doi: 10.1002/jmri.10243. [DOI] [PubMed] [Google Scholar]
- 6.Caro CG, Fitz-Gerald JM, Schroter RC. Atheroma and arterial wall shear observation, correlation and proposal of a shear dependent mass transfer mechanism for atherogenesis. Proc R Soc Lond B Biol Sci. 1971;177:109–33. doi: 10.1098/rspb.1971.0019. [DOI] [PubMed] [Google Scholar]
- 7.Giddens DP, Zarins CK, Glagov S. The role of fluid mechanics in the localization and detection of atherosclerosis. J Biomech Eng. 1993;115:588–94. doi: 10.1115/1.2895545. [DOI] [PubMed] [Google Scholar]
- 8.Moore JE, Jr, Xu C, Glagov S, Zarins CK, Ku DN. Fluid wall shear stress measurements in a model of the human abdominal aorta: oscillatory behavior and relationship to atherosclerosis. Atherosclerosis. 1994;110:225–40. doi: 10.1016/0021-9150(94)90207-0. [DOI] [PubMed] [Google Scholar]
- 9.Oshinski JN, Ku DN, Mukundan S, Loth F, Pettigrew RI. Determination of wall shear stress in the aorta with the use of MR phase velocity mapping. J Magn Reson Imaging. 1995;5:640–47. doi: 10.1002/jmri.1880050605. [DOI] [PubMed] [Google Scholar]
- 10.Suzuki J, Shimamoto R, Nishikawa J, Tomaru T, Nakajima, Nakamura K, Shin WS, Toyo-oka T. Vector analysis of the hemodynamics of atherogenesis in the human thoracic aorta using MR velocity mapping. Am J Roentgenol. 1998;171:1285–90. doi: 10.2214/ajr.171.5.9798863. [DOI] [PubMed] [Google Scholar]
- 11.Oyre S, Ringgaard S, Kozerke S, Paaske WP, Scheidegger MB, Boesiger P, Pedersen EM. Quantitation of circumferential subpixel vessel wall position and wall shear stress by multiple sectored three-dimensional paraboloid modeling of velocity encoded cine MR. Magn Reson Med. 1998;40(5):645–55. doi: 10.1002/mrm.1910400502. [DOI] [PubMed] [Google Scholar]
- 12.Shibeshi SS, Collins WE. The rheology of blood flow in a branched arterial system. Appl Rheol. 2005;156:398–405. doi: 10.1901/jaba.2005.15-398. [DOI] [PMC free article] [PubMed] [Google Scholar]
- 13.Vignon-Clementel IE, Figueroa CA, Jansen KE, Taylor CA. Outflow boundary conditions for 3D simulations of non-periodic blood flow and pressure fields in deformable arteries. Comput Methods Biomech Biomed Engin. 2010;13:625–640. doi: 10.1080/10255840903413565. [DOI] [PubMed] [Google Scholar]
- 14.Moyle KR, Antiga L, Steinman DA. Inlet conditions for image-based CFD models of the carotid bifurcation: is it reasonable to assume fully developed flow? J Biomech Eng. 2006;128(3):371–79. doi: 10.1115/1.2187035. [DOI] [PubMed] [Google Scholar]
- 15.Gijsen FJ, Allanic E, van de Vosse FN, Janssen JD. The influence of the non-Newtonian properties of blood on the flow in large arteries: unsteady flow in a 90 degrees curved tube. J Biomech. 1999;32(7):705–13. doi: 10.1016/s0021-9290(99)00014-7. [DOI] [PubMed] [Google Scholar]
- 16.Cho YI, Kensey KR. Effects of the non-Newtonian viscosity of blood on flows in a diseased arterial vessel. Part 1: Steady flows Biorheology. 1991;28:241–62. doi: 10.3233/bir-1991-283-415. [DOI] [PubMed] [Google Scholar]
- 17.Nobile F, Vergara C. An Effective Fluid-structure interaction formulation for vascular dynamics by generalized Robin conditions. SIAM J Sci Comput. 2008;30(2):731–63. [Google Scholar]
- 18.Thomas JB, Milner JS, Rutt BK, Steinman DA. Reproducibility of image-based computational fluid dynamics models of the human carotid bifurcation. Ann Biomed Eng. 2003;31(2):132–41. doi: 10.1114/1.1540102. [DOI] [PubMed] [Google Scholar]
- 19.Kirbas C, Quek F. A review of vessel extraction techniques and algorithms. ACM Comput Surv. 2004;36:81–121. [Google Scholar]
- 20.Sharma N, Aggarwal LM. Automated medical image segmentation techniques. J Med Phys. 2010;35:3–14. doi: 10.4103/0971-6203.58777. [DOI] [PMC free article] [PubMed] [Google Scholar]
- 21.Taylor CA, Draney MT. Experimental and computational methods in cardiovascular fluid mechanics. Annu Rev Fluid Mech. 2004;36:197–231. [Google Scholar]
- 22.Olufsen MS, Peskin CS, Kim WY, Pedersen EM, Nadim A, Larsen J. Numerical simulation and experimental validation of blood flow in arteries with structured-tree outflow conditions. Ann Biomed Eng. 2000;28:1281–99. doi: 10.1114/1.1326031. [DOI] [PubMed] [Google Scholar]
- 23.Formaggia L, Gerbeau JF, Nobile F, Quarteroni A. On the coupling of 3D and 1D Navier–Stokes equations for flow problems in compliant vessels. Comput Methods Appl Mech Eng. 2001;191(7):6. 561–82. [Google Scholar]
- 24.Laganà K, Dubini G, Migliavacca F, Pietrabissa R, Pennati G, Veneziani A, Quarteroni A. Multiscale modelling as a tool to prescribe realistic boundary conditions for the study of surgical procedures. Biorheology. 2002;39(3–4):359–64. [PubMed] [Google Scholar]
- 25.Wan J, Steele B, Spicer SA, Strohband S, Feijóo GR, Hughes TJR, Taylor CA. A one-dimensional finite element method for simulation-based medical planning for cardiovascular disease. Comput Methods Biomech Biomed Engin. 2002;5:195–206. doi: 10.1080/10255840290010670. [DOI] [PubMed] [Google Scholar]
- 26.de Pater L, van den Berg J. An electrical analogue of the entire human circulatory system. Med Electron Biol Eng. 1964;2:161–66. doi: 10.1007/BF02484215. [DOI] [PubMed] [Google Scholar]
- 27.Shi Y, Lawford P, Hose R. Review of zero-D and 1-D models of blood flow in the cardiovascular system. Biomed Eng OnLine. 2011;10:33–71. doi: 10.1186/1475-925X-10-33. [DOI] [PMC free article] [PubMed] [Google Scholar]
- 28.Johnston BM, Johnston PR, Corney S, Kilpatrick D. Non-Newtonian blood flow in human right coronary arteries: steady state simulations. J Biomech. 2004;37:709–20. doi: 10.1016/j.jbiomech.2003.09.016. [DOI] [PubMed] [Google Scholar]
- 29.Evju Ø, Valen-Sendstad K, Mardal KA. A study of wall shear stress in 12 aneurysms with respect to different viscosity models and flow conditions. J Biomech. 2013;46:2802–08. doi: 10.1016/j.jbiomech.2013.09.004. [DOI] [PubMed] [Google Scholar]
- 30.Steinman DA. Modeling of Physiological Flows. Springer Milan; 2012. Assumptions in modelling of large artery hemodynamics; pp. 1–18. [Google Scholar]
- 31.Hussain MA, Kar S, Puniyani RR. Relationship between power law coefficients and major blood constituents affecting the whole blood viscosity. J Biosci. 1999;24(3):329–37. [Google Scholar]
- 32.Venkatesan J, Sankar DS, Hemalatha K, Yatim Y. Mathematical analysis of Casson fluid model for blood rheology in stenosed narrow arteries. J Appl Math. 2013:1–11. [Google Scholar]
- 33.Biasetti J, Gasser TC, Auer M, Hedin U, Labruto F. Hemodynamics of the normal aorta compared to fusiform and saccular abdominal aortic aneurysms with emphasis on a potential thrombus formation mechanism. Ann Biomed Eng. 2010;38(2):380–90. doi: 10.1007/s10439-009-9843-6. [DOI] [PubMed] [Google Scholar]
- 34.Zhang G. Computational Bioengineering. CRC Press; 2015. [Google Scholar]
- 35.Lee SW, Antiga L, Steinman DA. Correlations among indicators of disturbed flow at the normal carotid bifurcation. J Biomech Eng. 2009;131:1013–20. doi: 10.1115/1.3127252. [DOI] [PubMed] [Google Scholar]
- 36.Wu SP, Ringgaard S, Oyre S, Hansen MS, Rasmus S, Pedersen EM. Wall shear rates differ between the normal carotid, femoral, and brachial arteries: An in vivo MRI study. J Magn Reson Imaging. 2004;19:188–93. doi: 10.1002/jmri.10441. [DOI] [PubMed] [Google Scholar]
- 37.Vignon-Clementel IE, Figueroa CA, Jansen KE, Taylor CA. Outflow boundary conditions for three-dimensional finite element modeling of blood flow and pressure in arteries. Comput Methods Appl Mech Eng. 2006;195:3776–96. [Google Scholar]
- 38.Cibis M, Potters WV, Gijsen FJH, Marquering H, vanBavel E, van der Steen AFW, Nederveen AJ, Wentzel JJ. Wall shear stress calculations based on 3D cine phase contrast MRI and computational fluid dynamics: a comparison study in healthy carotid arteries. NMR Biomed. 2014;27:826–34. doi: 10.1002/nbm.3126. [DOI] [PubMed] [Google Scholar]
- 39.Steinman DA, Thomas JB, Ladak HM, Milner JS, Rutt BK, Spence JD. Reconstruction of carotid bifurcation hemodynamics and wall thickness using computational fluid dynamics and MRI. Magn Reson Med. 2002;47:149–59. doi: 10.1002/mrm.10025. [DOI] [PubMed] [Google Scholar]
- 40.Hirata K, Yaginuma T, O’Rourke MF, Kawakami M. Age-related changes in carotid artery flow and pressure pulses possible implications for cerebral microvascular disease. Stroke. 2006;37:2552–56. doi: 10.1161/01.STR.0000242289.20381.f4. [DOI] [PubMed] [Google Scholar]
- 41.Lee SH, Kang S, Hur N, Jeong SK. A fluid-structure interaction analysis on hemodynamics in carotid artery based on patient-specific clinical data. J Mech Sci Technol. 2013;26:3821, 31. [Google Scholar]
- 42.Nandakumar N, Sahu KC, Anand M. Pulsatile flow of a shear-thinning model for blood through a two-dimensional stenosed channel. Eur J Mech – Bfluids. 2015;49:29–35. [Google Scholar]
- 43.Boussel L, Rayz V, Martin A, Acevedo-Bolton G, Lawton MT, Higashida R, Smith WS, Young WL, Saloner D. Phase-contrast magnetic resonance imaging measurements in intracranial aneurysms in vivo of flow patterns, velocity fields, and wall shear stress: comparison with computational fluid dynamics. Magn Reson Med. 2009;61:409–17. doi: 10.1002/mrm.21861. [DOI] [PMC free article] [PubMed] [Google Scholar]
- 44.Morbiducci U, Gallo D, Massai D, Ponzini R, Deriu MA, Antiga L, Redaelli A, Montevecchi FM. On the importance of blood rheology for bulk flow in hemodynamic models of the carotid bifurcation. J Biomech. 2011;4413:2427, 38. doi: 10.1016/j.jbiomech.2011.06.028. [DOI] [PubMed] [Google Scholar]
- 45.Lee SW, Steinman DA. On the relative importance of rheology for image-based CFD models of the carotid bifurcation. J Biomech Eng. 2006;129:273–278. doi: 10.1115/1.2540836. [DOI] [PubMed] [Google Scholar]
- 46.Yiallourou TI, Kröger JR, Stergiopulos N, Maintz D, Martin BA, Bunck AC. Comparison of 4D phase-contrast MRI flow measurements to computational fluid dynamics simulations of cerebrospinal fluid motion in the cervical spine. PloS ONE. 2012;7:1–13. doi: 10.1371/journal.pone.0052284. [DOI] [PMC free article] [PubMed] [Google Scholar]
- 47.Figueroa CA, Vignon-Clementel IE, Jansen KE, Hughes TJR, Taylor CA. A coupled momentum method for modeling blood flow in three-dimensional deformable arteries. Comput Methods Appl Mech Eng. 2006;195:5685–706. [Google Scholar]
- 48.Alastruey J, Parker KH, Peiró J, Byrd SM, Sherwin SJ. Modelling the circle of Willis to assess the effects of anatomical variations and occlusions on cerebral flows. J Biomech. 2007;40:1794–805. doi: 10.1016/j.jbiomech.2006.07.008. [DOI] [PubMed] [Google Scholar]
- 49.Xiao N, Humphrey JD, Figueroa CA. Multi-scale computational model of three-dimensional hemodynamics within a deformable full-body arterial network. J Comput Phys. 2013;244:22–40. doi: 10.1016/j.jcp.2012.09.016. [DOI] [PMC free article] [PubMed] [Google Scholar]
- 50.Shipkowitz T, Rodgers VGJ, Frazin LJ, Chandran KB. Numerical study on the effect of secondary flow in the human aorta on local shear stresses in abdominal aortic branches. J Biomech. 2000;33(6):717–28. doi: 10.1016/s0021-9290(99)00223-7. [DOI] [PubMed] [Google Scholar]
- 51.Hoi Y, Wasserman BA, Lakatta EG, Steinman DA. Effect of common carotid artery inlet length on normal carotid bifurcation hemodynamics. J Biomech Eng. 2010;132(12):1–6. doi: 10.1115/1.4002800. [DOI] [PMC free article] [PubMed] [Google Scholar]
- 52.Wake AK, Oshinski JN, Tannenbaum AR, Giddens DP. Choice of in vivo versus idealized velocity boundary conditions influences physiologically relevant flow patterns in a subject-specific simulation of flow in the human carotid bifurcation. J Biomech Eng. 2009;131(2):1–8. doi: 10.1115/1.3005157. [DOI] [PMC free article] [PubMed] [Google Scholar]
- 53.Gallo D, Steinman DA, Morbiducci U. An insight into the mechanistic role of the common carotid artery on the hemodynamics at the carotid bifurcation. Ann Biomed Eng. 2014;43(1):68–81. doi: 10.1007/s10439-014-1119-0. [DOI] [PubMed] [Google Scholar]
- 54.Balossino R, Pennati G, Migliavacca F, Formaggia L, Veneziani A, Tuveri M, Dubin G. Computational models to predict stenosis growth in carotid arteries: Which is the role of boundary conditions? Comput. Methods Biomech Biomed Engin. 2009;12(1):113–123. doi: 10.1080/10255840903080802. [DOI] [PubMed] [Google Scholar]
- 55.Jacobsen BK, Eggen AE, Mathiesen EB, Wilsgaard T, Njølstad I. Cohort profile: the Tromso study. Int J Epidemiol. 2012;41:961–67. doi: 10.1093/ije/dyr049. [DOI] [PMC free article] [PubMed] [Google Scholar]


