Abstract
BACKGROUND
Marijuana is the most widely used illicit drug in the United States and all over the world. Reports indicate that the potency of cannabis preparation has been increasing. This report examines the concentration of cannabinoids in illicit cannabis products seized by DEA (drug and enforcement administration) over the last two decades, with particular emphasis on Δ9-THC and cannabidiol (CBD).
METHODS
Samples in this report are received over time from DEA confiscated materials and processed for analysis using a validated ‘gas chromatograph with flame ionization detector (GC/FID)’ method.
RESULTS
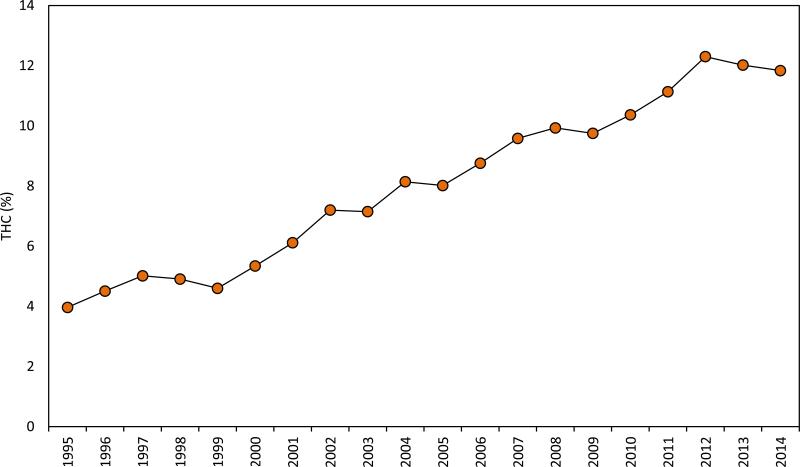
A total of 38,681samples of cannabis preparations were received and analyzed between January 1, 1995 and December 31, 2014. The data showed that, while the number of marijuana samples seized over the last four years has declined, the number of sinsemilla samples has increased. Overall, the potency of illicit cannabis plant material has consistently risen over time since 1995 from approximately 4% in 1995 to approximately 12% in 2014. On the other hand, the CBD content has fallen on average from approximately 0.28% in 2001 to <0.15% in 2014, resulting in a change in the ratio of THC to CBD from 14 times in 1995 to approximately 80 times in 2014.
CONCLUSION
It is concluded that there is a shift in the production of illicit cannabis plant material from regular marijuana to sinsemilla. This increase in potency poses higher risk of cannabis use, particularly among adolescents.
Keywords: Cannabinoids, Cannabis sativa, CBD, Δ9-THC, GC/FID, Potency
INTRODUCTION
Cannabis potency, expressed as the Δ9-tetrahydrocannabinol (Δ9-THC; or THC) concentration over time has been the subject of occasional reports from our group since 1984 (1-4). The importance of monitoring the potency of confiscated cannabis preparations, used as a measure of what is actually being used by the public, lies in the perceived negative health consequences of the use of the more potent products. This issue will be addressed in other parts of this special issue.
While cannabis has been reported to contain over 500 different compounds (546 compounds as of last count) belonging to a diverse group of chemical classes, the most important of which is the cannabinoids (104 cannabinoids) (5), the potency of cannabis is usually judged based on the THC content of the preparation. Other constituents do have pharmacological properties of their own, but are not the subject of this report.
Different cannabis preparations are found in the illicit market. These include cannabis (marijuana, sinsemilla, and ditchweed), hashish (the resinous parts of the plants mixed with some plant particles and shaped into different forms depending on the preparation method) and hash oil (concentrated extract of cannabis plant material or hashish as an oil or semisolid preparation).
In our last potency trends publication (4) we reviewed the status of cannabis potency in the illicit market, not only in the United States (USA), but also in Europe and other countries around the world. The data from the USA was based on our own findings, ending in 2009, while the other countries’ data are based on literature reports. While the potency of cannabis has increased dramatically over the years, resulting in negative impact on the users (6), it is important to mention that the literature is rich with many studies showing efficacy and biological activity of therapeutic potential using much lower potency cannabis preparations (ranging from 1.5-4% THC).
In this review the focus will be on the status of the cannabis potency in the United States, since this is where the bulk of potency data has been generated. Furthermore, while previous potency reports from our group have included data from samples provided from the Federal Drug Enforcement Administration (DEA) seizures as well as samples provided by state law enforcement agents through the cannabis eradication program, this review will focus on potency trends using only the DEA seized materials. These samples actually provide more realistic data since the seizures are made as the materials were on the way to illicit market distribution. While the main cannabinoids of interest in cannabis are THC and CBD, analysis is carried out for all major cannabinoids to have a good understanding of the chemical profile of all samples which might affect the overall biological activity of the drug.
METHODS AND MATERIALS
Samples
All samples in this report were received from drug and enforcement administration (DEA) and provided to our laboratory (under contract with the National Institute on Drug Abuse, NIDA) by DEA regional laboratories. These samples were stored in a climatic controlled storage at 4°C by DEA before sending it to The University of Mississippi (UMISS). At UMISS, samples were also stored in a climatic controlled vault at 4°C. A total of 39,985 cannabis preparations (cannabis plant material, hashish and hash oil) were received during that period, January 1, 1995 to December 31, 2014, from the eight DEA regional laboratories as shown in Table 1, of which 38,681 cannabis samples were analyzed (Table 2).
Table 1.
Number of specimens, by category, submitted by DEA regional laboratories for analysis, 1995 to 2014
| Types | ||||||||
|---|---|---|---|---|---|---|---|---|
| DEA Regional Laboratory | Cannabis | Hashish | Hash Oil | Total | Total | |||
| n | Δ9-THC % | n | Δ9-THC % | n | Δ9-THC % | n | Δ9-THC % | |
| STRL (Special Testing Research Laboratory) | 31 | 3.00±3.11 | 86 | 4.95±3.72 | 6 | 11.04±10.28 | 123 | 4.76±4.37 |
| NERL (Northeast Regional Laboratory) | 4474 | 9.92±6.26 | 96 | 15.62±15.51 | 21 | 16.55±8.87 | 4591 | 10.07±6.66 |
| MARL (Mid-Atlantic Regional Laboratory) | 3258 | 7.18±4.40 | 35 | 16.29±16.65 | 12 | 22.48±6.69 | 3305 | 7.33±4.88 |
| SERL (Southeast Regional Laboratory) | 5080 | 7.39±5.25 | 54 | 13.27±14.14 | 49 | 21.00±16.31 | 5183 | 7.58±5.79 |
| NCRL (North Central Regional Laboratory) | 6204 | 7.35±4.90 | 48 | 20.26±17.37 | 16 | 48.35±25.42 | 6268 | 7.55±5.75 |
| SCRL (South Central Regional Laboratory) | 3383 | 5.19±2.75 | 8 | 26.38±18.06 | 4 | 68.63±3.56 | 3395 | 5.31±3.74 |
| SWRL (Southwest Regional Laboratory) | 5464 | 10.61±6.60 | 291 | 26.86±16.91 | 50 | 29.27±27.97 | 5805 | 11.59±8.78 |
| WRL (Western Regional Laboratory) | 9712 | 7.12±5.39 | 196 | 28.14±19.70 | 103 | 45.94±30.87 | 10011 | 7.93±8.30 |
| Grand Total | 37606 | 7.86±5.57 | 814 | 21.78±18.15 | 261 | 34.32±28.00 | 38681 | 8.34±7.14 |
Table 2.
Average cannabinoids concentration of cannabis samples confiscated by DEA, 1995 to 2014
| Year | N | Δ8-THC % | Δ9-THC % | CBD % | CBC % | CBN % | CBG % | THCV % |
|---|---|---|---|---|---|---|---|---|
| 1995 | 3763 | 0.00 | 3.96±1.82 | 0.28±0.48 | 0.19±0.08 | 0.39±0.27 | 0.13±0.22 | 0.05±0.08 |
| 1996 | 1402 | 0.00 | 4.51±2.26 | 0.37±0.56 | 0.20±0.10 | 0.38±0.31 | 0.16±0.30 | 0.09±0.15 |
| 1997 | 1337 | 0.00 | 5.01±2.72 | 0.41±0.67 | 0.19±0.09 | 0.34±0.30 | 0.20±0.23 | 0.11±0.11 |
| 1998 | 1341 | 0.00 | 4.90±2.96 | 0.41±0.67 | 0.20±0.32 | 0.38±1.15 | 0.17±0.21 | 0.07±0.08 |
| 1999 | 1825 | 0.00 | 4.60±3.42 | 0.42±0.64 | 0.17±0.09 | 0.55±0.42 | 0.17±0.26 | 0.05±0.07 |
| 2000 | 1929 | 0.00 | 5.34±3.51 | 0.52±0.83 | 0.18±0.08 | 0.51±0.36 | 0.26±0.27 | 0.08±0.08 |
| 2001 | 1687 | 0.00 | 6.11±3.72 | 0.55±0.85 | 0.19±0.09 | 0.40±0.32 | 0.29±0.27 | 0.09±0.08 |
| 2002 | 1690 | 0.00 | 7.20±4.79 | 0.47±0.79 | 0.21±0.15 | 0.28±0.28 | 0.28±0.28 | 0.10±0.10 |
| 2003 | 1872 | 0.00 | 7.15±4.66 | 0.47±0.77 | 0.22±0.10 | 0.29±0.29 | 0.33±0.32 | 0.09±0.08 |
| 2004 | 1914 | 0.00 | 8.14±5.29 | 0.51±0.84 | 0.23±0.33 | 0.35±0.30 | 0.40±0.35 | 0.10±0.13 |
| 2005 | 2295 | 0.00 | 8.01±5.02 | 0.48±0.88 | 0.26±0.32 | 0.39±0.37 | 0.40±0.37 | 0.09±0.13 |
| 2006 | 2081 | 0.00 | 8.76±5.66 | 0.43±0.81 | 0.24±0.15 | 0.33±0.38 | 0.40±0.36 | 0.09±0.11 |
| 2007 | 2143 | 0.00 | 9.58±5.47 | 0.46±0.98 | 0.24±0.17 | 0.31±0.68 | 0.44±0.38 | 0.10±0.14 |
| 2008 | 2000 | 0.00 | 9.93±5.41 | 0.41±0.97 | 0.25±0.16 | 0.41±0.44 | 0.37±0.35 | 0.10±0.15 |
| 2009 | 2074 | 0.01±0.05 | 9.75±5.49 | 0.39±0.84 | 0.24±0.25 | 0.48±0.47 | 0.33±0.36 | 0.10±0.12 |
| 2010 | 2260 | 0.05±0.26 | 10.36±6.25 | 0.28±0.60 | 0.25±0.18 | 0.50±0.43 | 0.34±0.33 | 0.08±0.11 |
| 2011 | 2342 | 0.06±0.10 | 11.13±6.57 | 0.22±0.56 | 0.25±0.24 | 0.45±0.41 | 0.42±0.96 | 0.09±0.13 |
| 2012 | 2091 | 0.08±0.11 | 12.30±6.89 | 0.20±0.56 | 0.24±0.14 | 0.55±0.44 | 0.43±0.34 | 0.09±0.10 |
| 2013 | 1133 | 0.08±0.11 | 12.02±6.23 | 0.17±0.58 | 0.27±0.15 | 0.58±0.42 | 0.47±0.36 | 0.10±0.15 |
| 2014 | 427 | 0.07±0.11 | 11.84±6.60 | 0.15±0.40 | 0.23±0.11 | 0.45±0.36 | 0.46±0.32 | 0.09±0.12 |
| Grand Total | 37606 | 0.02±0.08 | 7.86±5.57 | 0.39±0.75 | 0.22±0.19 | 0.41±0.45 | 0.32±0.40 | 0.09±0.11 |
The description of each sample type of cannabis product received for analysis is listed below:
Marijuana – Male or female cannabis grown for illicit drug use
Sinsemilla – Female cannabis plants which have not been pollinated. May grow from cutting or from seed. May contain some seed (if unpollinated the seed will be sterile).
Kilobrick – Pressed cannabis made of leaves, heads, stems, and seeds.
Thai Sticks – A form of cannabis from Thailand consisting of premium buds of seedless marijuana in which the leaves and buds are tied on the stems to secure the plant material.
Hashish – A concentrated resin cake or ball produced from pressed kief, the detached tricomes and fine material that falls off the cannabis flowers and leaves. It varies in color from black to golden brown depending on the purity and variety of cultivar it was obtained from.
Hash Oil – Obtained from the cannabis plant by solvent extraction, and contains the cannabinoids present in the natural oils of cannabis flowers and leaves. The solvents are evaporated to leave behind very concentrated oil.
Ditchweed – Unattended, wild male and female fiber type cannabis (hemp) that is native to many mid-western states.
GC/FID Analysis
The analytical method has been previously described (3). Briefly, a Varian gas chromatograph with Flame Ionisation Detector (GC/FID) is used for the analysis. Quantitative analysis of seven of the major cannabinoids in cannabis (Δ9-Tetrahydrocannabinol, Δ9-THC; Δ8-Tetrahydrocannabinol, Δ8-THC; Tetrahydrocannabivarin, THCV; Cannabidiol, CBD; Cannabichromen, CBC; Cannabigerol, CBG and Cannabinol, CBN) is carried out by solvent extraction followed by analysis using capillary gas chromatography, a method offering short analysis time and resolution of all cannabinoids on a single column. Two samples (100 mg each) are used for analysis from each manicured potency monitoring (PM) sample. A 3.0 ml of internal standard (I.S.) extraction solvent (100 mg of 4-androstene-3,17-dione + 10 mL chloroform + 90 mL methanol) is added to the sample and allowed to rest at room temperature for one hour. The extract is then filtered through a cotton plug and the clear filtered material is transferred to an autosampler vial. Samples are placed onto the GC instrument along with vials of ethanol, internal standard/Δ9-THC mixture (unextracted standard), and controls. Lastly the results are calculated by obtaining an average percentage of each cannabinoid from the two chromatograms of each PM sample. It must be noted that the response factor for the cannabinoids relative to I.S. is 1. Therefore, the area of each cannabinoid divided by that of the I.S. multiplied by the amount of I.S. added (3 mg) gives the percentage of each cannabinoid in the sample, since 100 mg of sample is used for analysis. For example, a cannabinoid with the same peak area as that of the I.S. represents a 3% concentration in the sample. The method has been validated to meet FDA (food and drug administration) GMP (good manufacturing practices) requirements.
Statistical Analysis
The statistical analysis of data was performed using normal distribution function (NORM.DIST) of Microsoft Excel.
RESULTS
The first Potency Monitoring (PM) sample was received for analysis in 1975. In past years, confiscated marijuana samples were sent to the project from National, State, and Local law enforcement agencies, but due to funding restrictions, only samples from the DEA regional laboratories are processed for analysis as of August, 2010. A database to record information of each sample was established by the University of Mississippi School of Pharmacy data center. These samples are assigned a PM number by the database. Information such as seizure location (city and state), seizure amount, seizure date, case number, exhibit number, and identification of type of sample (bud, sinsemilla, kilobrick, maturity level, hashish, hash oil, etc.) are entered to describe the sample. At present, there are 54 fields of information entered to describe each sample. The samples are then prepared for analysis. Technological advances over the years have made it possible to increase the information recorded for each sample. The most recent database is on the web and can be viewed by a selected group. It also has the capability to be downloaded into a program e.g., excel, making it possible to prepare graphs and tables. The database program also has the capability to prepare many of the reports required by the Natonal Institute on Drug Abuse (NIDA) and other federal agencies.
Although the database includes samples received from DEA specimens as well as samples from domestic cannabis eradication program administered by different state law enforcement agencies, this report will only deal with DEA seized samples, representing approximately two-thirds of total number of samples. These samples have been referred to in some of our previous reports as non-domestic samples (the country of production of those samples is unknown) to distinguish them from the known domestically produced samples.
A total of 38,681 samples of cannabis preparations (37,606 cannabis plant material, 814 hashish and 261 hash oil samples) were received between January 1, 1995 and December 31, 2014 (20-year period), submitted by the eight DEA regional laboratories. All the cannabis samples (37,606) of different categories were analyzed. The main categories are marijuana (26,145 samples) and sensimilla (11,344 samples), and rest of the samples were ditchweed (115) and unknown (2). Under an agreement between NIDA and DEA our laboratory is to receive a 25 gram sample from the evidence submitted to the regional laboratories of each DEA marijuana seizure exceeding 75 grams, and a 2 gram sample from each hashish and hash oil seizure. Table 1 shows the number of samples, by category (cannabis, hashish or hash oil) received from each of the eight DEA regional laboratories, with the average Δ9-THC content for each product by region.
It is clear that the vast majority of the samples are in the cannabis (plant material) category, and that the hash oil has the highest Δ9-THC content followed by hashish then cannabis. Table S1 on the other hand shows a breakdown of the cannabis samples by type. Marijuana and sinsemilla are where most of the samples reside.
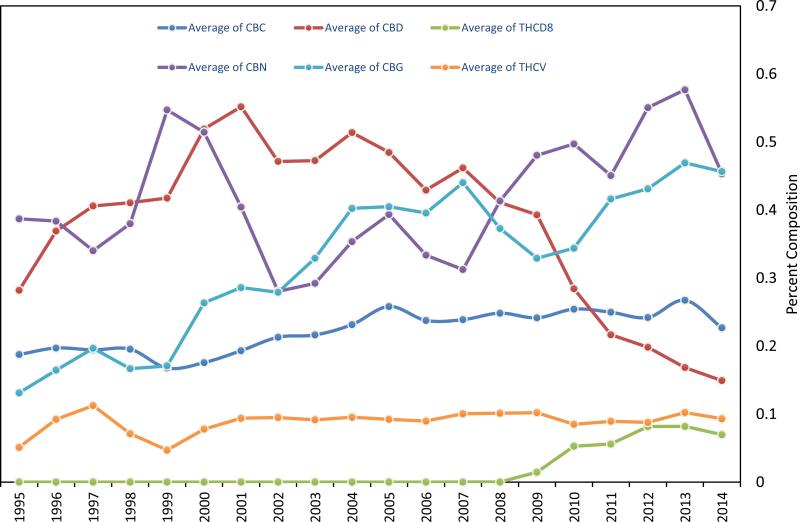
Table 2 shows the average concentration of THC and other major cannabinoids in cannabis samples by year, depicting the constant trend of increased potency of cannabis over time, starting from approximately 4% in 1995 and rising to approximately 12% in 2014. This is depicted in the graph shown in Figure 1. On the other hand there was no trend one way or the other for the content of the other cannabinoids except for CBD which has shown a general decline over the last decade, going from approximately 0.5% in 2004 to less than 0.2% in 2014, and the observed increase in the CBG concentration from 0.13% in 1995 to 0.46% in 2014 (Figure 2).
Figure 1.
Average Δ9-tetrahydrocannabinol (Δ9-THC) concentration of DEA specimens by year, 1995 – 2014.
Figure 2.
Average concentration of Cannabichromen (CBC), Cannabidiol (CBD), Δ8-Tetrahydrocannabinol (Δ9-THC), Cannabinol (CBN), Cannabigerol (CBG), Tetrahydrocannabivarin (THCV), in DEA specimens by year, 1995 – 2014 (All cannabinoids except Δ9-THC).
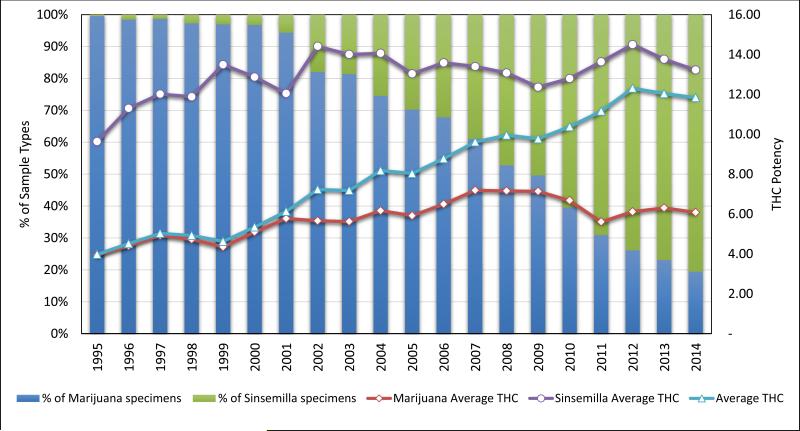
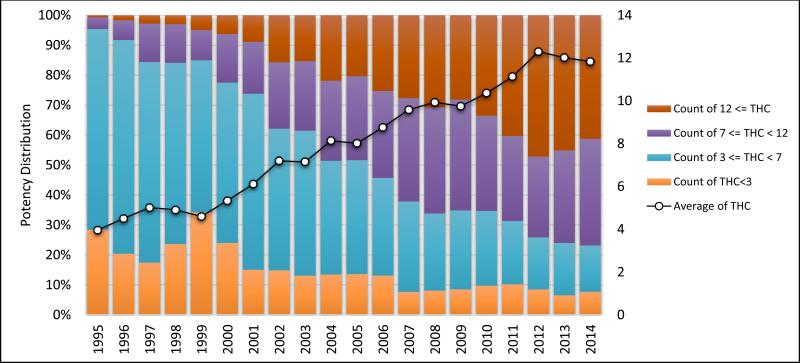
Table S2 shows the average THC content of cannabis samples by type of preparation of each of its two major categories, marijuana and sinsemilla, by year seized and number of samples. It is evident from Table S2 that while the number of samples in the marijuana type showed a strong declining trend (p = 0.051) over the last decade, the number of sinsemilla samples has shown a strong trend of increase (p = 0.056). Because of the much higher potency of sinsemilla than marijuana, the increase in the proportionate number of sinsemilla samples vs. marijuana has been the cause of the overall increase in potency of confiscated samples. Figure 3 shows the proportion of the number of marijuana vs sinsemilla samples seized by year. If one examined the prevalence of high potency cannabis samples over time, it is clear that the proportion of the higher potency samples (7 to 12% and > 12% THC) has been increasing over time. Table 3 shows the prevalence of samples of THC concentration of < 3%, 3-7%, 7-12%, and > 12%. Figure 4 shows a graphical representation of the potency distribution of cannabis samples over the period of this report. The percent of < 3% samples and 3-7% samples has been declining over time, while that of the 7-12% and > 12% has been on the rise, resulting in overall increase in the potency of confiscated cannabis over the years.
Figure 3.
Comparison of marijuana and sinsemilla samples confiscated by DEA from 1995 to 2014.
Table 3.
Prevalence of high potency Cannabis samples confiscated by DEA from 1995 to 2014
| Year | Δ9-THC n < 3 % | Δ9-THC n = 3 -7 % | Δ9-THC n = 7-12 % | Δ9-THC n > 12 % | Total | ||||
|---|---|---|---|---|---|---|---|---|---|
| n | % | n | % | n | % | n | % | ||
| 1995 | 1070 | 28.43% | 2521 | 66.99% | 148 | 3.93% | 24 | 0.64% | 3763 |
| 1996 | 286 | 20.40% | 1000 | 71.33% | 93 | 6.63% | 23 | 1.64% | 1402 |
| 1997 | 233 | 17.43% | 895 | 66.94% | 172 | 12.86% | 37 | 2.77% | 1337 |
| 1998 | 317 | 23.64% | 811 | 60.48% | 173 | 12.90% | 40 | 2.98% | 1341 |
| 1999 | 625 | 34.25% | 926 | 50.74% | 184 | 10.08% | 90 | 4.93% | 1825 |
| 2000 | 463 | 24.00% | 1032 | 53.50% | 313 | 16.23% | 121 | 6.27% | 1929 |
| 2001 | 254 | 15.06% | 991 | 58.74% | 292 | 17.31% | 150 | 8.89% | 1687 |
| 2002 | 251 | 14.85% | 799 | 47.28% | 375 | 22.19% | 265 | 15.68% | 1690 |
| 2003 | 245 | 13.09% | 906 | 48.40% | 434 | 23.18% | 287 | 15.33% | 1872 |
| 2004 | 258 | 13.48% | 726 | 37.93% | 512 | 26.75% | 418 | 21.84% | 1914 |
| 2005 | 313 | 13.64% | 872 | 38.00% | 643 | 28.02% | 467 | 20.35% | 2295 |
| 2006 | 273 | 13.12% | 678 | 32.58% | 604 | 29.02% | 526 | 25.28% | 2081 |
| 2007 | 164 | 7.65% | 647 | 30.19% | 739 | 34.48% | 593 | 27.67% | 2143 |
| 2008 | 162 | 8.10% | 515 | 25.75% | 708 | 35.40% | 615 | 30.75% | 2000 |
| 2009 | 177 | 8.53% | 546 | 26.33% | 767 | 36.98% | 584 | 28.16% | 2074 |
| 2010 | 220 | 9.73% | 564 | 24.96% | 718 | 31.77% | 758 | 33.54% | 2260 |
| 2011 | 239 | 10.20% | 495 | 21.14% | 664 | 28.35% | 944 | 40.31% | 2342 |
| 2012 | 178 | 8.51% | 363 | 17.36% | 564 | 26.97% | 986 | 47.15% | 2091 |
| 2013 | 74 | 6.53% | 198 | 17.48% | 350 | 30.89% | 511 | 45.10% | 1133 |
| 2014 | 33 | 7.73% | 66 | 15.46% | 152 | 35.60% | 176 | 41.22% | 427 |
| Total | 5835 | 15.52% | 15551 | 41.35% | 8605 | 22.88% | 7615 | 20.25% | 37606 |
Figure 4.
THC potency distribution of cannabis samples from DEA specimens and average THC by year, 1995 – 2014.
Domestically produced materials are seized in many cases as the plants are still in production. Therefore, the degree of maturity and the THC content for many of these specimens is not reflective of what the potency will be at the time of distribution. However, we have examined the average potency of mature cannabis samples from domestically produced materials seized in states that have legalized marijuana for medical use vs states where marijuana is still illegal. We found the average Δ9-THC concentration for the period 1995 -2010 to be 8.73 ± 6.08% for samples from states with laws allowing the use of the drug and 5.42 ± 4.90% for samples from states still operating under the federal law.
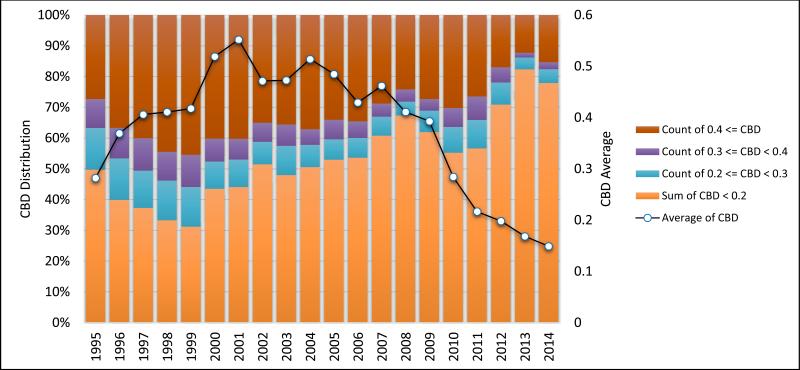
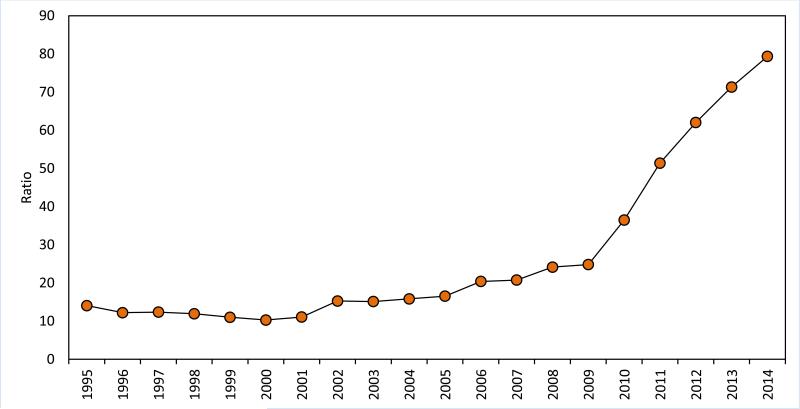
An additional important cannabinoid in cannabis of current interest is CBD. There has been a significant interest in CBD over the last few years and in cannabis preparations of high CBD content. This is because of the reported (7, 8) activity of CBD as an antiepileptic agent, particularly its promise for the treatment of intractable pediatric epilepsy (9). Furthermore, it is perceived by some that the marijuana user's community prefer, or use, materials that have reasonably high levels of CBD along with THC. Examining the CBD content in the cannabis samples over the years does not support this notion. As shown in Figure 2, the CBD concentration has declined from approximately 0.5% in 2004 to < 0.2% in 2014. Figure 5 shows the distribution of the number of cannabis samples by CBD content against the overall average by year. While generally speaking confiscated cannabis samples have low CBD content, its concentration has fallen off even lower in the last few years. Plotting the ratio of THC:CBD over time (Figure 6) shows the ratio went from approximately 15 to almost 80 over the study period. This indicates that the drug using community and the cannabis producers are breeding plants for the higher THC content.
Figure 5.
CBD concentration distribution in Cannabis samples confiscated by DEA and average CBD by year, 1995 – 2014.
Figure 6.
Ratio of the average concentration of THC to CBD in DEA specimens by year, 1995 – 2014.
For the other illicit cannabis preparations (hashish and hash oil), there has been only a small number of specimens of these preparations, reflecting the biased preference of the United States cannabis market towards the plant material (marijuana and sinsemilla).
Figure S1 shows the concentration of THC and other cannabinoids in confiscated hashish samples over time along with the number of specimens by year. While there is no consistent trend, it is obvious that there has been an increase in the number of hashish specimens over the last five years and also increase in the hashish potency over time. Beside THC, the only other cannabinoids with significant content are CBD (but generally less than 5%) and CBN of approximately 2-5%.
Figure S2 shows the same data for hash oil samples as for hashish. Again, over the last few years there has been an increase in the number of seizures as well as the THC concentration, reaching over 50% THC content in the last three years. It is important to note here that the second most significant cannabinoid is CBN, not CBD as in hashish. This indicated that, while intermediate variety of cannabis (with both THC and CBD) is used in the manufacture of hashish, it appears that hash oil has been prepared from drug type cannabis. With the increased demand for high potency marijuana, cannabis buds are trimmed where large leaves are removed. It is speculated that those leaves (usually referred to as the “shake” in the cannabis culture) are used to prepare hash oil which has a higher market value.
DISCUSSION
While there are several reports concerning the consequences of the use of marijuana, perhaps the most comprehensive is that by Volkow, et al (6). In this review, the authors detailed the negative health consequences associated with the use of marijuana (especially in early adolescence). These included effects on the brain and mental illness, school performance and lifetime achievement, risk of motor vehicle accidents, chronic inflammation of the lungs, and the effects on the vascular system. Furthermore, the authors showed that drug-related Emergency Department (ED) visits involving marijuana (either alone or in combination) has increased over time, corresponding to the increase in the potency of the drug over that period of time. The authors noted that with increase in THC content in confiscated marijuana samples from 3% in 1980 to 12% in 2012, the health consequences of marijuana use may be worse now than in the past. In adolescents (aged 15-17 years old) it has been reported that ED visits involving marijuana use has risen in both males and females by 53.6% and 42.9%, respectively, from 2005 to 2010 (10), which might be caused by the increase in cannabis potency over this time period.
While the rate of increase in ED admissions almost parallels the rate of increase in cannabis potency overtime might be coincidental or at least is empirical, that correlation points to the importance of having solid analytical data on cannabis products used by clinicians practicing with Medical Marijuana in the states that have laws allowing the use of these products.
Supplementary Material
ACKNOWLEDGMENTS
This work was supported in part by the National Institute on Drug Abuse (NIDA), National Institute of Health (NIH), Department of Health and Human Services, USA, Contract No. N01DA-10-7773.
Footnotes
Publisher's Disclaimer: This is a PDF file of an unedited manuscript that has been accepted for publication. As a service to our customers we are providing this early version of the manuscript. The manuscript will undergo copyediting, typesetting, and review of the resulting proof before it is published in its final citable form. Please note that during the production process errors may be discovered which could affect the content, and all legal disclaimers that apply to the journal pertain.
DISCLOSURES
The authors report no biomedical financial interests or potential conflicts of interest.
REFERENCES
- 1.ElSohly MA, Holley JH, Lewis GS, Russell MH, Turner CE. Constituents of cannabis sativa L. XXIV: the potency of confiscated marijuana, hashish, and hash oil over a ten-year period. J Forensic Sci. 1984;29(2):500–514. [Google Scholar]
- 2.ElSohly MA, Ross SA, Mehmedic Z, Arafat R, Yi B, Banahan BF. Potency trends of Δ9-THC and other cannabinoids in confiscated marijuana from 1980-1997. J Forensic Sci. 2000;45(1):24–30. [PubMed] [Google Scholar]
- 3.Mehmedic Z, Chandra S, Slade D, Denham H, Foster S, Patel AS, et al. Potency trends of Δ9-THC and other cannabinoids in confiscated cannabis preparations from 1993 to 2008. J Forensic Sci. 2010;55(5):1209–1217. doi: 10.1111/j.1556-4029.2010.01441.x. [DOI] [PubMed] [Google Scholar]
- 4.Slade D, Mehmedic Z, Chandra S, ElSohly M. Is cannabis becoming more potent? In: Castle D, Murray RM, D'Souza DC, editors. Marijuana and Madness. 2nd ed. Cambridge University Press; 2012. pp. 35–54. [Google Scholar]
- 5.ElSohly M, Gul W. Constituents of cannabis sativa. In: Pertwee RG, editor. Handbook of Cannabis. Oxford University Press; 2014. pp. 3–22. [Google Scholar]
- 6.Volkow ND, Baler RD, Compton WM, Weiss SRB. Adverse health effects of marijuana use. N Engl J Med. 2014;370(23):2219–2227. doi: 10.1056/NEJMra1402309. [DOI] [PMC free article] [PubMed] [Google Scholar]
- 7.Mechoulam R, Carlini E. Toward drugs derived from cannabis. Naturwissenschaften. 1978;65:174–179. doi: 10.1007/BF00450585. [DOI] [PubMed] [Google Scholar]
- 8.Cunha JM, Carlini EA, Pereira AE, et al. Chronic administration of cannabidiol to healthy volunteers and epileptic patients. Pharmacology. 1980;21:175–185. doi: 10.1159/000137430. [DOI] [PubMed] [Google Scholar]
- 9.Noonan D. Marijuana's medical future. Sci Am. 2015;312(2):32–34. [Google Scholar]
- 10.Data Spotlight. Center for Behavioral Health Statistics and Quality. Drug Abuse Warning Network; Nov 13, 2012. Emergency department visits involving marijuana among adolescents aged 15 to 17: increase from 2005 to 2010 varied by gender. [Google Scholar]
Associated Data
This section collects any data citations, data availability statements, or supplementary materials included in this article.


