

Abstract
The reduction and oxidation of the flavin system is an important electron transfer reaction in biological systems. Several reaction pathways exist to connect oxidized to fully reduced riboflavin, each with unique intermediates including a semi-quinone radical. By performing surface-enhanced Raman scattering (SERS) with simultaneous electrochemical detection of riboflavin at different pH values, we are able to correlate reversible changes in spectral features to the current changes observed in the cyclic voltammetry. Multivariate curve resolution analysis of the SERS spectra indicates that three distinct components were present at the SERS electrode at each pH during the potential sweep. To verify and better understand the variations in Raman bands across the voltammogram, density functional theory (DFT) calculations were performed to model the effect of pH and oxidation state on the riboflavin Raman spectrum. The calculated spectra show qualitative agreement with the species identified in the chemometric analysis. This combination of results indicates the presence of the oxidized, semi-quinone, and reduced forms of riboflavin and provides insight into the mechanism of the flavin redox system.
Introduction
The reduction and oxidation (redox) of isoalloxazine ring systems mediate electron transfer reactions by enzymes and play a key role in numerous biological systems. Riboflavin, vitamin B2 shown in Figure 1, is a nutrient source for the isoalloxazine ring system. In the mitochondria, riboflavin is phosphorylated to form flavin mononucleotide (FMN) by riboflavin kinase that is then further converted to flavin adenine dinucleotide (FAD). FMN and FAD are important cofactors in cellular processes. These cofactors are unique due to their ability to undergo one- and two-electron redox processes and their reactivity with oxygen, both characteristics many other cofactors do not possess.1, 2
Figure 1.

The structure of riboflavin is shown with the atom numbering of the isoalloxazine ring.
All forms of flavin can exist in three different oxidation states (Figure 2), including oxidized, radical semi-quinone, and fully reduced Flavin, as well as in different protonation states depending on the pH of the solution.3, 4 The pKas of oxidized riboflavin are approximately 0 and 10, such that the cationic form is not expected under typical experimental conditions. N5 and N10 of the isoalloxazine ring (Figure 1) are the imides that are protonated upon reduction. Proton-coupled electron transfer is known to alter the ring conjugation. Several possible reaction pathways exist by which proton-coupled electron transfer can occur, each with unique intermediates, to connect oxidized to reduced Flavin. The semi-quinone radical is the intermediate of the one-electron transfer, and the stabilization of this radical is critical to accept or donate either one or two electrons at a time. In the unbound state, in situ, the semi-quinone is believed to be a short lived species.5-7 However, the radical is stabilized in flavoproteins by hydrogen-bonding from the protein, resulting in a greater equilibrium concentration of the radical, and enabling the flavin to either accept or donate one electron at a time.8-10
Figure 2.
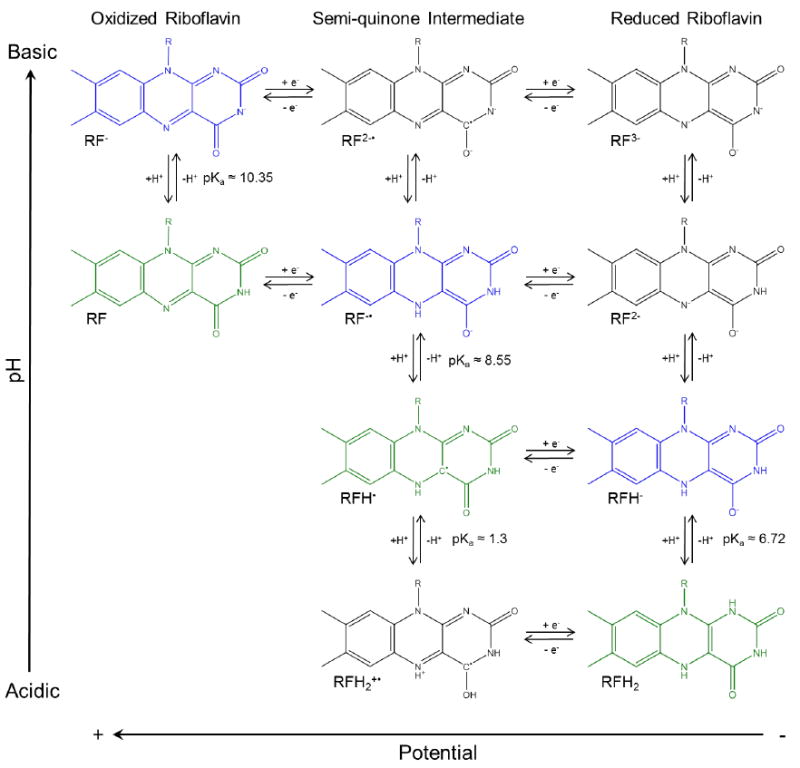
The riboflavin redox system is shown. The occurrence of each species is dependent on the pH of the solution and the potential applied. Reported pKa values are indicated.4, 46 The cationic form of riboflavin is not expected to occur at the pH values used in this text. The expected pathway at each pH examined is indicated by the green (pH 4 and 7) and the blue (pH 12) highlighted species.17, 18
The unique redox characteristics of the flavins have been the focus of several electrochemical investigations. Potentiometry6, 11, 12, polarography4, 12, 13, cyclic voltammetry12, 14-18, and simultaneous electrochemistry and electron paramagnetic resonance19 all have been used to study these properties in both aqueous and organic solutions. The solution properties determine whether the reaction takes place via a two-electron and two-proton process, or through the semi-quinone radical in separate one-electron processes. Similarly, the isoalloxazine ring system exhibits differences in UV-Vis3, 20-24 and emission20, 22, 25-29 spectra based on the solution properties and the applied potential. Some of these studies have demonstrated the oxidation state dependent absorbance16, 17, 20-23 and fluorescence20, 22, 27-29 which have been used to monitor enzyme turn-over via single molecule studies27 and the ability to monitor single-molecule electrochemical and fluorescence events of FMN and FAD.28, 29 While gaining valuable information, the major drawback of these studies is the inability to gain structural information about the flavin at the electrode surface.
Raman spectroscopy has been widely used to study the structure of these flavins and flavoproteins due to the ability to identify analytes from unique Raman signatures. Resonance Raman (RR) spectroscopy was the first technique employed to study these molecules because it can selectively excite the flavin moiety without interference from the surrounding protein.5, 30-35 Combining this technique with normal mode analysis, the flavin structure and its interaction with the protein have been studied.36, 37 The main downside of RR is the intense fluorescence of the isoalloxazine group that can obscure the spectra. Surface enhanced Raman spectroscopy (SERS) can avoid the fluorescence interference and the flavin system has been studied utilizing both silver colloids38, 39 and roughened silver electrodes.18, 24, 40 Under potential control, the studies on silver electrodes observed the semi-quinone intermediate, but neither detected fully reduced flavin.18, 40 Both of those studies suffered from long acquisition times where the spectrum could be the average of the ensemble, missing some short lived species. In one case, the species was immobilized on the SERS electrode.40
Our lab has recently shown the ability to do combined SERS and electrochemical experiments on the millisecond time scale to gain complimentary information about analytes.41, 42 The Raman bands of riboflavin are sensitive to the redox and protonation state, and in this study we use SERS with cyclic voltammetry to study the spectroscopic signature associated with the reversible oxidation and reduction of this species at different pH values, simultaneously. Chemometric analysis, performed using multivariate curve resolution, determined the number of components at the SERS electrode during the potential sweep, which provides insight into which chemical species are present. The Raman results were interpreted with respect to DFT calculations of the different pH and oxidation states of riboflavin to better understand the potential dependent speciation.
Experimental Methods
Materials and Reagents
A commercial silver plating solution (1025 RTU @ Troy/gallon, Technic Inc.) was used for all electro-depositions. Riboflavin (≥98%) and sodium hydroxide (NaOH) (99.99%) were purchased from Sigma-Aldrich. Ultrapure water (18.2 MΩ cm) was obtained from a Barnstead Nanopure filtration system. Buffers were made using sodium phosphate monobasic dihydrate (>99.9%, Sigma-Aldrich) and sodium phosphate dibasic (Electron Microscopy Sciences). The pH was adjusted by adding NaOH or H2SO4 while monitoring with an Accumet Basic AB15+ pH Meter. Polydimethyslsiloxane (PDMS) devices were made using Sylgard 184 elastomer base (Ellsworth Adhesives, Germantown, WI, USA) from masters fabricated with SU-8 50 photoresist and Nano SU-8 developer (Microchem, Newton, MA, USA). All other chemicals were analytical grade and used without any further purification. Polystyrene bases were made with polystyrene powder (250 μm particle size, Goodfellow, Huntingdon, England) and a gold array made from 3 mm 200 mesh regular grid (SPI supplies, West Chester, PA, USA).
Device and Electrode Fabrication
The fabrication of the polystyrene-encapsulated electrode arrays were performed as previously reported.43 The encapsulated gold (Au) electrode array was made SERS-active by electrodepositing silver (Ag) onto the surface. A PDMS well was positioned around the polystyrene-encapsulated electrode and the Ag plating solution placed inside. -1.2 V vs. silver-silver chloride (Ag/AgCl) was applied for 200 seconds to form the roughened surface. In situ Raman measurements were performed in the steady-state by placing a PDMS well around the SERS-active array, filling with degassed solution, and acquiring signal with a water dipping objective.
Raman Measurements
All experiments were performed on a lab-built Raman microscope as previously reported.42 The key components are a 17 mW (cw) 632.8 nm HeNe laser, a spectrograph (Shamrock 303i, Andor) with a 600 gr/mm grating, and a EMCCD (Newton 970, Andor). A 40x water immersion objective (Olympus, NA=0.8) was used for excitation and collection of the Raman signal. The laser power measured at the sample was 1 mW.
Electrochemical Measurements
Electrochemical measurements were made using a CH Instrument Model 660D Potentiostat. The embedded Ag array functions as the working electrode. A platinum wire is the counter electrode and Ag/AgCl is the reference electrode. All potentials in this manuscript are referenced versus Ag/AgCl. A phosphate buffer with varying pH values was used as the supporting electrolytes.
Chemometric Analysis
Multivariate analysis was performed using PLS Toolbox (Eigenvector Research Inc., Wenatchee, WA, Version 7.0.2) working in MATLAB R2013b (The Mathworks Inc., Natick, MA). No preprocessing was done before separating the pure components through analysis of the SERS data during the potential sweep using multi-variant curve resolution (MCR).
Gaussian Calculations
Theoretical frequency calculations were performed using Gaussian 09 (Gaussian, Inc., Wallingford, CT). Energy minimization and frequency analysis were performed using a B3LYP density functional theory with a 6-31G(D,p) basis set. Frequency analysis was done to obtain the normal Raman spectra of the riboflavin molecule in each state. All calculated wavenumbers were scaled by a factor of 0.975 by comparing the solid Raman spectrum of riboflavin to the calculated oxidized form of riboflavin (Figure S-1).
Results
In situ spectro-electrochemical experiments were done to study the spectroscopic signature associated with the reversible oxidation and reduction of riboflavin as a function of pH. Figure 3A shows cyclic voltammograms of 100 μM riboflavin in 0.1 M phosphate buffer (pH = 7.15) where the scan rate was increased from 0.1 to 1.0 V/s. The voltammograms show well defined cathodic and anodic peaks, which correlate to the reversible reduction and oxidation of riboflavin. On the forward sweep there is one cathodic peak that begins at -0.48 V, has an Epc = -0.64 V, and ends at -0.8 V. The reverse scan shows two anodic peaks with potentials of -0.43 and -0.3 V respectively. The broad oxidation peak spans from -0.53 to -0.17 V. The peak separation increases with the faster scan rate, indicating a quasi-reversible system. The observed voltammetry agrees with previous reports.15, 17, 18
Figure 3.
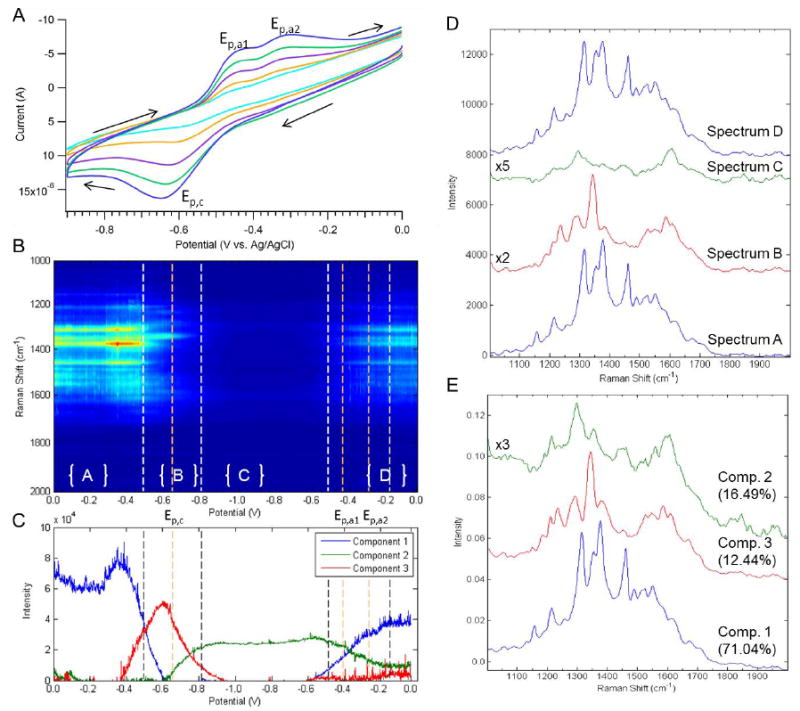
(A) Cyclic voltammogram of the pH 7.15 riboflavin solution, (B) Heatmap showing the SERS intensity with respect to potential and Raman shift where Epc, Epa1, and Epa2 are highlighted, (C) Plot showing the intensity of each component calculated using MCR versus the applied potential, and (D) Shows the spectrum corresponding to the highlighted regions in the heatmap. (E) MCR calculated pure components from SERS data are shown.
Figure 3B shows a heatmap of the SERS intensity as a function of Raman shift and potential, of the same solution of riboflavin used in the voltammetry. The potential was swept from 0.0 to -1.0 V and back at a scan rate of 1 mV/s. A Raman spectrum was taken every 0.25 seconds, corresponding to approximately four spectra every 1 mV. A consistent spectrum is observed for the first 450 mV, but distinct fluctuations begin to occur at -0.5 V which corresponds closely to the increase in faradaic current from the cathodic peak. There are spectral changes observed between -0.55 and -0.75 V, after which the SERS signal intensity drops considerably when fully reduced riboflavin should be present. On the reverse scan, the diminished signal persists until the beginning of the anodic peak at -0.5 V, when signal intensity returns. At potentials positive of -0.3 V, Raman bands similar to the initial spectrum are observed. The intensities observed at positive potentials on the reverse scan are lower than the initial intensities at the same potentials, a characteristic commonly observed in electrochemically roughened SERS substrates. The spectroscopic changes shown in the heatmap occur at potentials that correlate well with the peaks observed in the cyclic voltammogram.
Representative spectra from the regions indicated in the heatmap (Figure 3C) are displayed in Figure 3D to illustrate which Raman bands are changing. Table S-1 lists the observed Raman bands for each spectrum, along with peak assignments. As shown in spectrum A, oxidized riboflavin is present at the initial potential of 0.0 V.37, 39 There are no changes in the vibrational bands until -0.5 V, which correlates with the beginning of the cathodic peak in the voltammogram. Spectrum B highlights those changes. Comparison with the Raman spectrum of reduced flavin and the semi-quinone intermediate from the literature indicate that the peaks observed correspond most closely to the semi-quinone. In particular 1610 cm-1 that is localized in Ring 1 with contributions from v(C4-C3), 1590 cm-1 that includes v(N5-C6-C7), and 1289 cm-1 band that includes v(C11-C6-C7).18, 40 These vibrations correlate to the area where the electron density will shift during the protonation of the nitrogen atom and the formation of the radical. Spectrum C shows the species present after the reduction peak in the voltammogram, and how the signal decreases considerably. At this point fully reduced riboflavin is expected.
Multivariate Curve Resolution (MCR) was performed to help elucidate the number of distinct components at the SERS electrode during the CV. Figure 3C shows the intensity of each component as a function of potential. Component 1 persists until -0.45 V when riboflavin begins to be reduced and returns at -0.53 V at the beginning of the anodic peak. Component 2 is present between the cathodic and second anodic peaks, in the potential region fully reduced riboflavin is expected to be present. Component 3 is only present during the large reduction peak seen on the forward scan. The changes in intensity of the various components determined thru MCR correlate well with the cyclic voltammogram and SERS heatmap of the same solution. In Figure 3E, the 3 MCR components are compared to the representative spectrum taken out of the SERS heatmap (Figure 3D), and they are very similar, indicating the ability to separate out three separate components.
Figure 4 shows the experimental results when the pH of the riboflavin solution was increased to 12.55. In Figure 4A, cyclic voltammogram of 100 μM riboflavin is plotted as the scan rate was increased from 0.1 to 1.0 V/s. At basic pH, two peaks are observed in the cathodic scan, Ep,c1 = -0.67 V and Ep,c2 = -0.86 V. Upon reversing the potential, two anodic peaks are observed at Ep,a1 = -0.65 V and Ep,a2 = -0.54 V. Unlike at neutral pH, the voltammogram at basic pH displays two clearly resolved cathodic peaks, suggesting that both of the one electron transfer steps in the reduction reaction can be observed. The peak separation increases with the faster scan rate, again indicating a quasi-reversible system. The change in the peak potentials is consistent with the shift expected from changing the pH during the redox of riboflavin.4
Figure 4.

(A) Cyclic voltammogram of the pH 12.55 riboflavin solution, (B) Heatmap showing the SERS intensity with respect to potential and Raman shift where Epc1, Epc2, Epa1, and Epa2 are highlighted, (C) Plot showing the intensity of each component calculated using MCR versus the applied potential, and (D) Shows the spectrum corresponding to the highlighted regions in the heatmap. (E) MCR calculated pure components from SERS data are shown.
Figure 4B shows the heatmap of the combined spectro-electrochemical data of the same solution with a potential sweep from 0.0 to -1.1 V and back. A consistent spectrum is present from the outset until -0.6 V, which corresponds to the onset of the first cathodic peak in the voltammogram. There are distinct spectral changes observed between -0.6 and -0.85 V, after which the SERS signal drops considerably when fully reduced riboflavin should be present. On the reverse scan, there is still an absence of signal until in between the two anodic peaks at -0.6 V, when the SERS signal intensity returns (comparable with the initial intensity) and features similar to the initial spectrum are observed, indicating the reversibility of the signal.
Figure 4D shows representative average spectra pulled out along the potential sweep and Table S2 lists the observed Raman bands for each spectrum with the assignments. The oxidized form of riboflavin is present in spectrum A, and returns in D at the end of the voltammogram. When comparing the oxidized forms of the analyte (Figure 6) the differences between the neutral and anionic forms are apparent. Changes in the bands associated with the N10-C11-C6-N5 system due to the protonation of the analyte are evident in B which indicates the semi-quinone is present. Spectrum C shows the species existing after the reduction peak in the voltammogram at the point where fully reduced riboflavin should be present. The signal for this species is much lower in intensity than the oxidized and semi-quinone form, suggesting either a lack of affinity for the surface42, 44 or significantly lower cross-section.45
Figure 6.
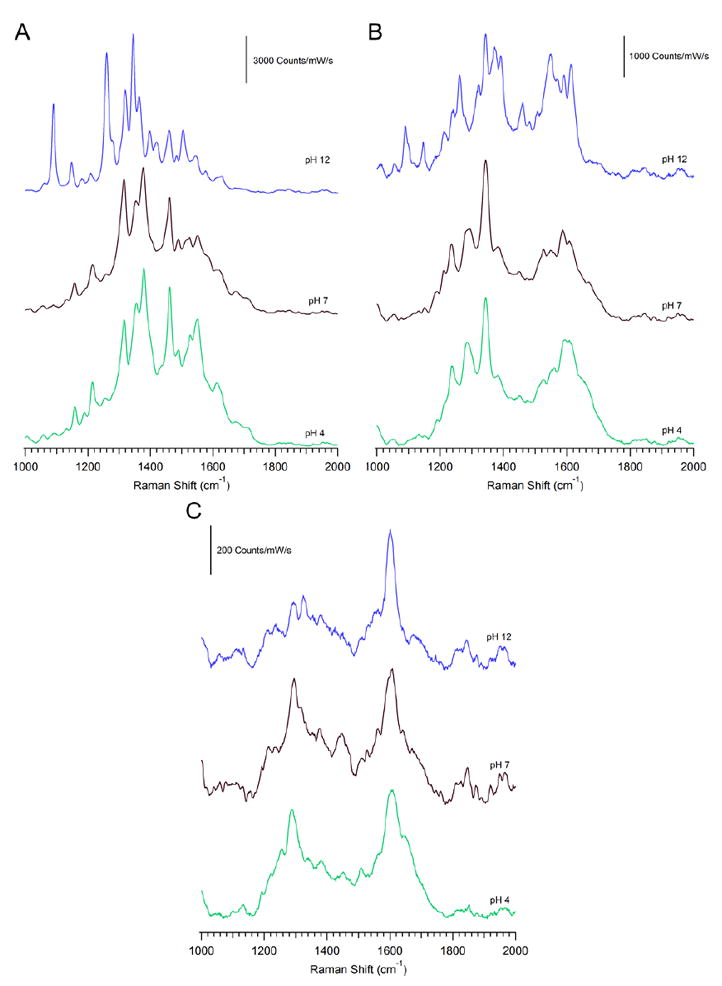
Comparison of the representative spectra taken from the heatmap at each pH value. Shown is (A) Spectrum A, (B) Spectrum B, and (C) Spectrum C from each pH.
The spectra observed during the voltammogram at basic pH were again analyzed by MCR. Figure 4C shows how the intensity of the 3 components changes with potential. Component 3 arises after the first cathodic peak at -0.67 V and goes away on the reverse scan after the first anodic peak at -0.65 V. Component 1 is present from the start of the scan until -0.55 V when riboflavin reduction occurs, but returns at -0.5 V on the reverse scan after the second anodic peak. Component 2 is present during the reduction peak, and comes back in between the two anodic peaks, indicating an intermediate species during the electron transfer reaction. Figure 4E highlights the 3 components and their contribution during the potential sweep experiment. When compared to the representative SERS spectra in Figure 4D, component 1 is identical to the oxidized form of riboflavin in spectrum A and D, while component 3 is very similar to spectrum B and component 2 to spectrum C. Thus, the MCR components are representative of the SERS spectra observed during the voltammetry.
To verify and better understand the variations of Raman vibrational bands across the voltammetric sweep, DFT calculations were performed. Frequency analysis was done to obtain the normal Raman spectra of each species of the proton-coupled electron transfer reduction of riboflavin shown in Figure 2. Figure 5 shows the results. All calculated wavenumbers were scaled by a factor of 0.975 by comparing the solid Raman spectrum of riboflavin to the theoretical Raman spectra of oxidized riboflavin (Figure S-1). The calculated oxidized riboflavin spectra, shown in Figure 5A, correlate well to the solid Raman spectrum, as well as the SERS spectrum taken in situ at the potential where the oxidized riboflavin should be present. Not all bands are present in the SERS spectrum, which is expected due to the selection rules of SERS. Also some bands have different intensities, but that is expected when comparing a DFT normal Raman calculation to a SERS spectrum of a molecule adsorbed to a metal surface. Despite the expected differences, the calculated spectra show good qualitative agreement with the observed SERS data.
Figure 5.

Comparison of the different forms of (A) oxidized, (B) semi-quinone radical, and (C) reduced riboflavin during the proton-coupled electron transfer reaction. The theoretical frequency calculations were scaled by a factor of 0.975.
Figure 5B compares the calculated Raman spectrum of the different semi-quinone intermediate forms of riboflavin, respectively. The neutral semi-quinone calculation agrees well with spectrum B at pH 7.15 with respect to the main bands at 1610, 1560, 1340, and 1289 cm-1, shown in Figure S-3. When the pH is increased to 12.55, the anionic form is expected to be the dominate species based on the pKa. Figure S-4 compares the calculated anionic semi-quinone that calculated species to spectrum B at the basic pH, and the main bands at 1611, 1550, 1390, 1324, 1303, and 1256 cm-1 correlate well. The comparison of the calculated spectra with the experimental result indicates spectrum B arises from the pH dependent semi-quinone species.
Spectrum C for both pH 7.15 and 12.55, which are at potentials where reduced riboflavin is expected to be present, have features similar to the calculated spectrum for the reduced molecule (Figure 5C). Fully reduced flavin has bands at 1296 and 1605 cm-1 that agree well with spectrum C at pH 7.15. Figure S-4 shows anionic fully reduced Flavin compared to spectrum C at pH 12.55, and the main peaks at 1293, 1328, and 1602 cm-1 suggest that the reduced species is detected.
Figure 6 shows a comparison of the representative spectrum taken from the heatmap at each pH value. The oxidized (Figure 6A) and semi-quinone (Figure 6B) species are clearly present, as discussed earlier, with the variations of the spectra at each pH being associated with the protonation of the imide’s based on the pKa of riboflavin (Figure 2). While much weaker in intensity, Figure 6C demonstrates the presence of another species that is only seen at potentials where reduced riboflavin is expected and the spectra are attributed to that form. Changes in the SERS lineshape match frequency shifts calculated at different pH. The higher energy shoulder at pH 4 and the differences in low energy features from pH 7 can be explained by ratio of species expected when the pH approaches the pKa value, which is close to 7 in the reduced form.46
Discussion
Riboflavin exists in different forms in situ based on the pH and the applied potential, as illustrated in Figure 2. The data illustrates the reversible oxidation and reduction of riboflavin correlating the spectral changes to the peak potentials in the cyclic voltammogram. By combining potential controlled Raman spectroscopy with electronic structure calculations, the results provide insight into the specific redox species present during the electrochemical conversion.
The potential dependent SERS spectra (Figures 3B, 4B, and S-2B) all exhibit changes in spectral features that correlate to the current observed in the cyclic voltammetry. The spectroscopic changes are observed to be reversible, such that the initial spectrum returns following oxidation and reduction in the cyclic voltammogram. Three ionic forms of riboflavin can exist in solution, and at pH 4.11 and 7.15 (Figures 3B and S2B, spectrum A), the initial species in solution at the beginning of the potential sweep is consistent with the neutral, oxidized form. However, at pH 12.55 the imide proton, N5, will be lost because the pH is greater than the pKa, and comparing spectrum A in Figure 4B to Figure S-4 the theoretical calculations, indicates the anionic oxidized species is observed. These findings agree with previous fluorescence and absorbance experiments of riboflavin at different pH values that demonstrate the neutral form is present from pH 3 to 9 and the anionic at a pH greater than 11.17, 22
As the potential is made sufficiently negative, reduction current in the voltammetry is observed that correlates to changes in spectral features. Several different proton-coupled electron transfer pathways precede fully reduced riboflavin (Figure 2). Each pathway has its own unique intermediates, including the radical semi-quinone. The chemometric analysis indicates that there are three distinct components observed at each pH, one being oxidized riboflavin.
The third component correlates to the cathodic peak in the voltammograms at pH 7.55 and 12.55, and matches each spectrum B, which has bands correlating to the semi-quinone intermediate.18, 40 At pH 12.55, the third component returns between the two anodic peaks in the CV, indicating that basic pH alters the electron transfer kinetics by stabilizing the semi-quinone intermediate. The observation of the semi-quinone here is of interest because in bulk solution it is very unstable and undergoes rapid dismutation. However, it is known to stabilize in certain biological environments,8-10 and adsorption to the metal surface could act in a similar manner.
The simplest interpretation is to associate the other two factors with an intermediate semi-quinone and the fully reduced species. In Figure 2 and 5, the predicted pathway at each pH is highlighted in green (pH < pKa) and blue (pH > pKa). The calculated spectra for these species show the highest qualitative agreement with the experimental SERS spectra.
The observation of reduced riboflavin has not been reported previously. Spectrum C, matching the second component identified by MCR, in each pH example occurs at potentials where reduced riboflavin is expected to be present. At these potentials the observed spectra are very weak; however, they have similar features to that of the theoretical frequency calculations of the reduced form. Other studies have demonstrated that the absorbance maximum for that species at approximately 450 nm and an emission maximum at 550 nm, both decrease and blue shift upon reduction.16, 17, 20-23, 27-29 These observations suggest a change in the cross-section of riboflavin upon reduction. 3, 17, 23, 47 This lower cross-section may explain previous challenges detecting the reduced species. These fluorescent and absorbance properties of the different redox states of riboflavin indicate a change in the electronic structure that would, in turn, also affect the observed SERS signal. While our experiments are performed at 633nm, where resonance enhancement is not expected, other studies have shown long pre-resonant enhancements in SERS experiments of fluorescent molecules.48 The change in cross-section is supported by Figure 6, where we observe both frequency changes as well decreasing signal intensity in the SERS spectra of the oxidized, semi-quinone, and reduced species.
The potential dependent fluorescence of the isoalloxazine ring system has been debated with respect to the species observed. Flavin is brightly fluorescent in the oxidized state and dim in the reduced state, while the semi-quinone is somewhere in between.20, 28 Chronofluorometry experiments of FMN showed the ability to cycle between the bright (oxidized) and dark (reduced) states of the molecule. However, cyclic potential sweep fluorescence of the same species showed a scan rate dependence wherein at fast scan rates the emission spectra is similar to the bulk solution measurement, while at slow scan rates distinct intermediates states are observed between the oxidized and reduced species.28 It was hypothesized that this appearance was a result of the stabilization of the semi-quinone in the zero-mode waveguide nanopore. The speciation observed in our experiments agrees with this hypothesis.
It is worth noting that in SERS experiments, the signal intensity arises from a number of factors, including the Raman cross-section45 and the affinity of the molecule for the SERS surface.42, 44 SERS discriminates between the large number of molecules in the bulk solution in favor of the small number located in “hotspots” in the focal volume on the electrode surface. The affinity between the analyte and substrate is crucial, and signal arises from molecules that show a favorable interaction with the surface.44 When the potential is sufficiently negative, N5 and N10 of the isoalloxazine ring are protonated. The combination of protonation and loss of electrons from the conjugated ring system may affect adsorption to the SERS surface, which would also result in a lower SERS signal for the reduced species.
Conclusions
The combination of in situ cyclic potential sweep SERS, chemometric analysis, and theoretical frequency calculations demonstrate the ability to correlate reversible changes in spectral features to the current observed at different pH values and provide new insights into the proton-coupled electron transfer pathway of riboflavin. Our results identify three distinct species present at the electrode surface during the voltammogram, indicative of the oxidized, semi-quinone, and reduced forms of riboflavin. The observation of the semi-quinone suggests it is stabilized on the metal surface and at basic pH, allowing it to accept or donate one electron at a time. Additionally, our results show how the change in electronic structure upon the reduction of riboflavin affects the cross section, and in-turn the SERS signal of the oxidized, semi-quinone, and reduced species. Overall, the ability to detect the speciation of the reversible redox of the riboflavin system based on applied potential is demonstrated.
Supplementary Material
Acknowledgments
The authors acknowledge support from the National Institutes of Health, National Institute of General Medical Sciences award R21 GM107893. We thank R. Scott Martin for assistance with fabricating the gold mesh electrode embedded in polystyrene.
References
- 1.Walsh C. Accounts of Chemical Research. 1980;13:148–155. [Google Scholar]
- 2.Ghisla S, Massey V. European Journal of Biochemistry. 1989;181:1–17. doi: 10.1111/j.1432-1033.1989.tb14688.x. [DOI] [PubMed] [Google Scholar]
- 3.Hemmerich P, Veeger C, Wood HCS. Angew Chem-Int Edit. 1965;4:671–687. doi: 10.1002/anie.196506711. [DOI] [PubMed] [Google Scholar]
- 4.Janik B, Elving PJ. Chemical Reviews. 1968;68:295–319. doi: 10.1021/cr60253a003. [DOI] [PubMed] [Google Scholar]
- 5.Su Y, Tripathi GNR. Journal of the American Chemical Society. 1994;116:4405–4407. [Google Scholar]
- 6.Michaelis L, Schubert MP, Smythe CV. Journal of Biological Chemistry. 1936;116:587–607. [Google Scholar]
- 7.Land EJ, Swallow AJ. Biochemistry. 1969;8:2117–2125. doi: 10.1021/bi00833a050. [DOI] [PubMed] [Google Scholar]
- 8.MASSEY V, HEMMERICH P. Biochemical Society Transactions. 1980;8:246–257. doi: 10.1042/bst0080246. [DOI] [PubMed] [Google Scholar]
- 9.Iyanagi T. Biochemistry. 1977;16:2725–2730. doi: 10.1021/bi00631a021. [DOI] [PubMed] [Google Scholar]
- 10.Paulsen KE, Stankovich MT, Stockman BJ, Markley JL. Archives of Biochemistry and Biophysics. 1990;280:68–73. doi: 10.1016/0003-9861(90)90519-5. [DOI] [PubMed] [Google Scholar]
- 11.Draper RD, Ingraham LL. Archives of Biochemistry and Biophysics. 1968;125:802–808. doi: 10.1016/0003-9861(68)90517-1. [DOI] [PubMed] [Google Scholar]
- 12.Hartley AM, Wilson GS. Analytical Chemistry. 1966;38:681–687. doi: 10.1021/ac60238a004. [DOI] [PubMed] [Google Scholar]
- 13.Sasaki K, Kitani A, Kunai A, Miyake H. Bulletin of the Chemical Society of Japan. 1980;53:3424–3429. [Google Scholar]
- 14.Tatwawadi SV, Santhanam KSV, Bard AJ. Journal of Electroanalytical Chemistry and Interfacial Electrochemistry. 1968;17:411–420. [Google Scholar]
- 15.Ksenzhek OS, Petrova SA, Pinielle ID. Journal of Electroanalytical Chemistry and Interfacial Electrochemistry. 1979;104:405–412. [Google Scholar]
- 16.Tan SLJ, Webster RD. Journal of the American Chemical Society. 2012;134:5954–5964. doi: 10.1021/ja300191u. [DOI] [PubMed] [Google Scholar]
- 17.Tan SLJ, Kan JM, Webster RD. The Journal of Physical Chemistry B. 2013;117:13755–13766. doi: 10.1021/jp4069619. [DOI] [PubMed] [Google Scholar]
- 18.Xu J, Birke RL, Lombardi JR. Journal of the American Chemical Society. 1987;109:5645–5649. [Google Scholar]
- 19.Male R, Samotowka MA, Allendoerfer RD. Electroanalysis. 1989;1:333–339. [Google Scholar]
- 20.Chen W, Chen J-J, Lu R, Qian C, Li W-W, Yu H-Q. Bioelectrochemistry. 2014;98:103–108. doi: 10.1016/j.bioelechem.2014.03.010. [DOI] [PubMed] [Google Scholar]
- 21.Wang X-M, Chen H-Y. Spectrochimica Acta Part A: Molecular and Biomolecular Spectroscopy. 1996;52:599–605. [Google Scholar]
- 22.Drössler P, Holzer W, Penzkofer A, Hegemann P. Chemical Physics. 2002;282:429–439. [Google Scholar]
- 23.Malinowski ER, Barber MJ, Whitaker GT, Smith ET. Journal of Chemometrics. 2007;21:520–528. [Google Scholar]
- 24.Wang X-m, Yan M-d, Zhu J-j, Chen H-Y. Journal of Electroanalytical Chemistry. 1998;451:187–192. [Google Scholar]
- 25.Sengupta A, Khade RV, Hazra P. Journal of Photochemistry and Photobiology A: Chemistry. 2011;221:105–112. [Google Scholar]
- 26.Islam SDM, Susdorf T, Penzkofer A, Hegemann P. Chemical Physics. 2003;295:137–149. [Google Scholar]
- 27.Zhao J, Branagan SP, Bohn PW. Appl Spectrosc. 2012;66:163–169. doi: 10.1366/11-06464. [DOI] [PubMed] [Google Scholar]
- 28.Zaino LP, Grismer DA, Han D, Crouch GM, Bohn PW. Faraday Discussions. 2015;184:101–115. doi: 10.1039/c5fd00072f. [DOI] [PubMed] [Google Scholar]
- 29.Zhao J, Zaino LP, Bohn PW. Faraday Discussions. 2013;164:57–69. doi: 10.1039/c3fd00013c. [DOI] [PubMed] [Google Scholar]
- 30.Sugiyama T, Nisimoto Y, Mason HS, Loehr TM. Biochemistry. 1985;24:3012–3019. doi: 10.1021/bi00333a031. [DOI] [PubMed] [Google Scholar]
- 31.Schelvis JPM, Ramsey M, Sokolova O, Tavares C, Cecala C, Connell K, Wagner S, Gindt YM. The Journal of Physical Chemistry B. 2003;107:12352–12362. [Google Scholar]
- 32.Li J, Uchida T, Ohta T, Todo T, Kitagawa T. The Journal of Physical Chemistry B. 2006;110:16724–16732. doi: 10.1021/jp062998b. [DOI] [PubMed] [Google Scholar]
- 33.Murgida DH, Schleicher E, Bacher A, Richter G, Hildebrandt P. Journal of Raman Spectroscopy. 2001;32:551–556. [Google Scholar]
- 34.Nishina Y, Sato K, Miura R, Matsui K, Shiga K. Journal of Biochemistry. 1998;124:200–208. doi: 10.1093/oxfordjournals.jbchem.a022081. [DOI] [PubMed] [Google Scholar]
- 35.Nishina Y, Sato K, Shi R, Setoyama C, Miura R, Shiga K. Journal of Biochemistry. 2001;130:637–647. doi: 10.1093/oxfordjournals.jbchem.a003029. [DOI] [PubMed] [Google Scholar]
- 36.Abe M, Kyogoku Y. Spectrochimica Acta Part A: Molecular Spectroscopy. 1987;43:1027–1037. [Google Scholar]
- 37.Bowman WD, Spiro TG. Biochemistry. 1981;20:3313–3318. doi: 10.1021/bi00514a051. [DOI] [PubMed] [Google Scholar]
- 38.Copeland RA, Fodor SPA, Spiro TG. Journal of the American Chemical Society. 1984;106:3872–3874. [Google Scholar]
- 39.Lee NS, Sheng RS, Morris MD, Schopfer LM. Journal of the American Chemical Society. 1986;108:6179–6183. [Google Scholar]
- 40.Abdelsalam M, Bartlett PN, Russell AE, Baumberg JJ, Calvo EJ, Tognalli NG, Fainstein A. Langmuir. 2008;24:7018–7023. doi: 10.1021/la800410x. [DOI] [PubMed] [Google Scholar]
- 41.Bailey MR, Pentecost AM, Selimovic A, Martin RS, Schultz ZD. Analytical Chemistry. 2015;87:4347–4355. doi: 10.1021/acs.analchem.5b00075. [DOI] [PMC free article] [PubMed] [Google Scholar]
- 42.Bailey MR, Martin RS, Schultz ZD. The Journal of Physical Chemistry C. 2016 doi: 10.1021/acs.jpcc.6b01196. [DOI] [Google Scholar]
- 43.Selimovic A, Erkal JL, Spence DM, Martin RS. Analyst. 2014;139:5686–5694. doi: 10.1039/c4an01062k. [DOI] [PMC free article] [PubMed] [Google Scholar]
- 44.Asiala SM, Schultz ZD. Analytical Chemistry. 2014;86:2625–2632. doi: 10.1021/ac403882h. [DOI] [PMC free article] [PubMed] [Google Scholar]
- 45.Zrimsek AB, Wong NL, Van Duyne RP. The Journal of Physical Chemistry C. 2016;120:5133–5142. [Google Scholar]
- 46.Mayhew SG. European Journal of Biochemistry. 1999;265:698–702. doi: 10.1046/j.1432-1327.1999.00767.x. [DOI] [PubMed] [Google Scholar]
- 47.Dudley KH, Ehrenberg A, Hemmerich P, Müller F. Helvetica Chimica Acta. 1964;47:1354–1383. [Google Scholar]
- 48.McNay G, Eustace D, Smith WE, Faulds K, Graham D. Appl Spectrosc. 2011;65:825–837. doi: 10.1366/11-06365. [DOI] [PubMed] [Google Scholar]
Associated Data
This section collects any data citations, data availability statements, or supplementary materials included in this article.