Abstract
Objective
The influence of eosinophilic oesophagitis (EoE)-associated inflammation upon oesophageal epithelial biology remains poorly understood. We investigated the functional role of autophagy in oesophageal epithelial cells (keratinocytes) exposed to the inflammatory EoE milieu.
Design
Functional consequences of genetic or pharmacological autophagy inhibition were assessed in endoscopic oesophageal biopsies, human oesophageal keratinocytes, single cell-derived ex vivo murine oesophageal organoids as well as a murine model recapitulating EoE-like inflammation and basal cell hyperplasia. Gene expression, morphological and functional characterization of autophagy and oxidative stress were performed by transmission electron microscopy, immunostaining, immunoblotting, live cell imaging and flow cytometry.
Results
EoE-relevant inflammatory conditions promoted autophagy and basal cell hyperplasia in three independent murine EoE models and oesophageal organoids. Inhibition of autophagic flux via chloroquine treatment augmented basal cell hyperplasia in these model systems. Oesophageal keratinocytes stimulated with EoE-relevant cytokines, including tumor necrosis factor-α and interleukin-13 exhibited activation of autophagic flux in a reactive oxygen species-dependent manner. Autophagy inhibition via chloroquine treatment or depletion of Beclin-1 or ATG-7, augmented oxidative stress induced by EoE-relevant stimuli in murine EoE, oesophageal organoids and human oesophageal keratinocytes. Oesophageal epithelia of pediatric EoE patients with active inflammation displayed increased autophagic vesicle content compared to normal and EoE remission subjects. Functional flow cytometric analysis revealed autophagic flux in human oesophageal biopsies.
Conclusions
Our findings reveal for the first time that autophagy may function as a cytoprotective mechanism to maintain epithelial redox balance and homeostasis under EoE inflammation-associated stress, providing mechanistic insights into the role of autophagy in EoE pathogenesis.
Keywords: Autophagy, Eosinophilic Oesophagitis, EoE, epithelial homeostasis, basal cell, oxidative stress
Introduction
Eosinophilic oesophagitis (EoE) is a food allergen-induced inflammatory disorder, characterized by oesophageal eosinophil infiltration and basal cell hyperplasia (BCH).1,2,3 Altered epithelial barrier function has been implicated in EoE, though notably often normalizes upon disease remission,4,5 suggesting that epithelial homeostatic mechanisms may be activated during EoE inflammation. Understanding how oesophageal epithelial cells (keratinocytes) cope with the EoE-associated inflammatory milieu may promote optimal disease management.
Autophagy (macroautophagy) is a catabolic process that degrades intracellular components via autophagic vesicles (AVs).6 Autophagy-related (ATG) proteins, including Beclin-1 (ATG-6), Microtubule-associated Protein 1 Light Chain 3 (LC3; ATG-8) and ATG-7, mediate AV biogenesis. Beclin-1 is required for induction of isolation membranes, AV precursors that surround autophagic cargo. LC3 regulates isolation membrane elongation and closure. LC3 cleavage is triggered to promote autophagy in response to stimuli including oxidative stress.7 Cleaved LC3 (LC3-I) is then lipidated (LC3-II) through a ubiquitin-like reaction involving ATG-7 and incorporated into AVs. Subsequent AV-lysosome fusion facilitates degradation of autophagic substrates via lysosomal hydrolases.
Autophagy may be activated as an adaptive response to physiologic stressors, including inflammation. Autophagy-deficient mice exhibit oxidative stress and cell death, supporting a homeostatic role for this process.8,9 Additionally, impairment of autophagic flux contributes to human pathologies, including Crohn disease in which autophagy defects have a broad impact upon innate and adaptive immune functions.10–12 By contrast, activation of autophagic flux may promote disease progression in cancer and systemic lupus erythematosus (SLE), by facilitating chemotherapeutic resistance13 and auto-reactive B cell survival,14 respectively. Thus, autophagy may exert protective or pathologic effects in a context-dependent manner.
Here, we investigated the functional role of autophagy in oesophageal keratinocyte biology using murine models recapitulating EoE inflammation and BCH, an ex vivo murine oesophageal organoid system, in vitro assessment of autophagic flux and human oesophageal biopsy specimens. We delineate a dynamic interplay between autophagy and oxidative stress in the context of EoE-associated inflammation and suggest that oxidative stress induced by EoE-relevant cytokines activates epithelial autophagy as a protective mechanism to regulate basal cell proliferation and redox balance. These studies provide novel mechanistic insight into the role of autophagy in gut mucosal homeostasis and EoE pathogenesis.
Materials and Methods
Patients and Oesophageal Biopsies
Patients (Supplementary Table S1) subjected to endoscopic biopsies under a protocol approved by the Institutional Review Board at Children’s Hospital of Philadelphia were classified as “active EoE”, “EoE remission” and “normal” as defined in Supplementary Information.
Transmission Electron Microscopy (TEM)
Tissues were processed as described previously4 to evaluate AVs quantitatively as detailed in Supplementary Information.
Histology and Immunohistochemistry
Hematoxylin and Eosin (H&E) staining and immunohistochemistry (IHC) were performed as described previously.15 Details regarding antibodies, staining conditions and scoring methods are provided in Supplementary Information. To validate antibody specificity, isotype controls or blocking peptides were used (Supplementary Figure S1) as detailed in Supplementary Information.
Cell Culture
Immortalized normal human oesophageal keratinocytes EPC2-hTERT, a derivative expressing green fluorescent protein (GFP)-LC3 (a gift from Dr. John P. Lynch, University of Pennsylvania) and primary oesophageal keratinocytes (EPC425, normal pediatric mucosa; EPC185-5, active EoE mucosa; passages 2–5) were grown as described previously.16–18 Subconfluent cells were subjected to live cell imaging or other analyses with or without additional treatment or small interfering RNA (siRNA) transfection as detailed in Supplementary Information.
Immunoblot Analysis
Western blotting was performed as described previously19 with antibodies and conditions listed in Supplementary Information.
Flow Cytometry
Flow cytometry was performed to determine AV content (Cyto-ID) and ROS (2’, 7’-dichlorodihydrofluorescein diacetate; DCF) as described previously19 and detailed in Supplementary Information.
Ex Vivo Oesophageal Organoid Culture
Oesophageal keratinocytes were isolated from C57B6/129SV mice under an Institutional Animal Care and Use Committee (IACUC)-approved protocol as described previously.16 Oesophageal organoids were generated and analyzed as previously described20 with modifications detailed in Supplementary Information.
Murine EoE Models
MC903/ovalbumin (OVA),21 L2-IL5/Oxazolone (OXA)22 and Krt5-rtTA tetO-IL13/Doxycycline (DOX)23 murine EoE models were utilized, as detailed in Supplementary Information, under IACUC approval. To inhibit autophagic flux, mice with oesophagitis were treated daily for 14 days with 60 mg/kg hydroxychloroquine sulfate (Spectrum Chemicals & Laboratory Products, New Brunswick, NJ) or vehicle Dulbecco’s Phosphate-Buffered Saline (DPBS) via intraperitoneal (i.p.) injection.
Statistics
Data are presented as mean ± standard error. Student’s t test was used to compare two groups. One-way ANOVA was used to compare more than two groups.. Linear correlation analysis was used to determine relationships between independent variables. P<0.05 was considered significant.
Results
Autophagy suppresses inflammation and BCH in murine EoE models
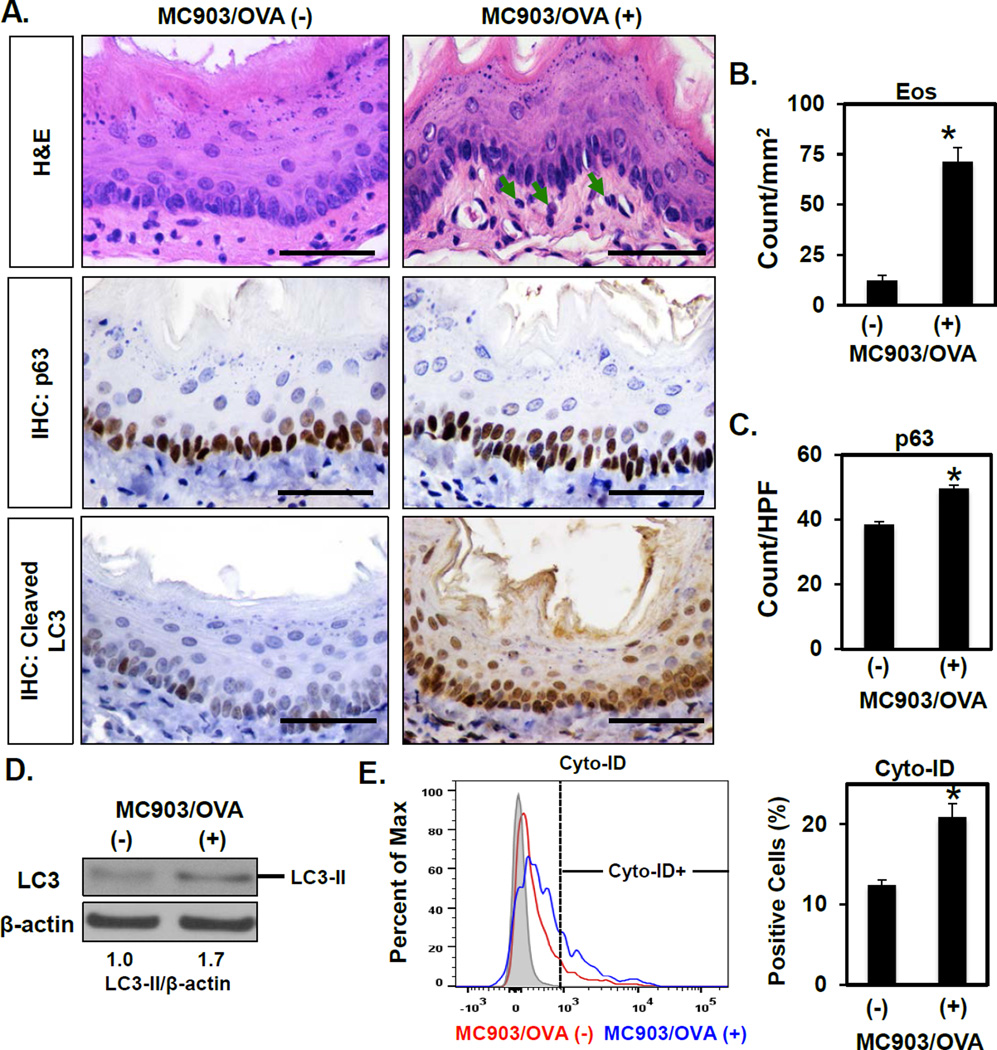
To investigate the role of autophagy in EoE, we first assessed AV content in oesophagi of mice with EoE-like inflammation. In the MC903/OVA EoE model, exposure to the food allergen OVA induces oesophagitis featuring eosinophil-rich inflammatory infiltrate (Figure 1A, B) and BCH,21 the latter evidenced by an increase in cells expressing the basal cell marker p63 (Figure 1A, C). Cleaved LC3 expression was also augmented in oesophageal epithelia of MC903/OVA-treated mice as compared to that of untreated controls or animals treated with MC903 or OVA alone (Figure 1A and Supplementary Figure S2). We then evaluated cleaved LC3 expression in two additional murine EoE models driven by cytokine overexpression in oesophageal epithelia. Both L2-IL5 and Krt5-rtTA tetO-IL13 mice display EoE-like inflammation, characterized by intraepithelial eosinophil accumulation and BCH, upon challenge with OXA or DOX-mediated transgene induction, respectively.22,23 In these model systems, robust induction of cleaved LC3 expression was documented in oesophageal epithelia of animals with EoE-like inflammation as compared to their control counterparts (Supplementary Figure S3). Notably, cleaved LC3 staining was detected in both the cytosol and nuclei of keratinocytes in each of the three EoE models evaluated. While this staining pattern is consistent with emerging evidence demonstrating a role for nuclear LC3 in autophagy regulation24,25, we further confirmed AV content upregulation in oesophageal epithelia with MC903/OVA-induced EoE-like inflammation via immunoblotting for LC3-II (Figure 1D) and flow cytometric analysis of the AV-identifying dye Cyto-ID (Figure 1E).
Figure 1. AV content is increased in a food allergy-induced murine model of EoE-like oesophageal inflammation.
BALB/c mice were treated with MC903 and OVA for 18 days (n=3) or untreated as controls (n=4). (A) Oesophageal tissues were evaluated by H&E staining (arrows, eosinophils) and IHC for p63 (basal cells) and cleaved LC3 (autophagy). Scale bars, 50 µm. (B and C) Eos and p63-positive basal cells were determined. Oesophageal epithelial sheets were peeled in (D and E). (D) Immunoblot determined LC3-II (densitometry shown at bottom) with β-actin as a loading control. (E) Flow cytometry determined the Cyto-ID-positive fraction with representative histogram plot (Left) and average (Right) displayed for each condition. *p<0.05 vs. MC903/OVA (−).
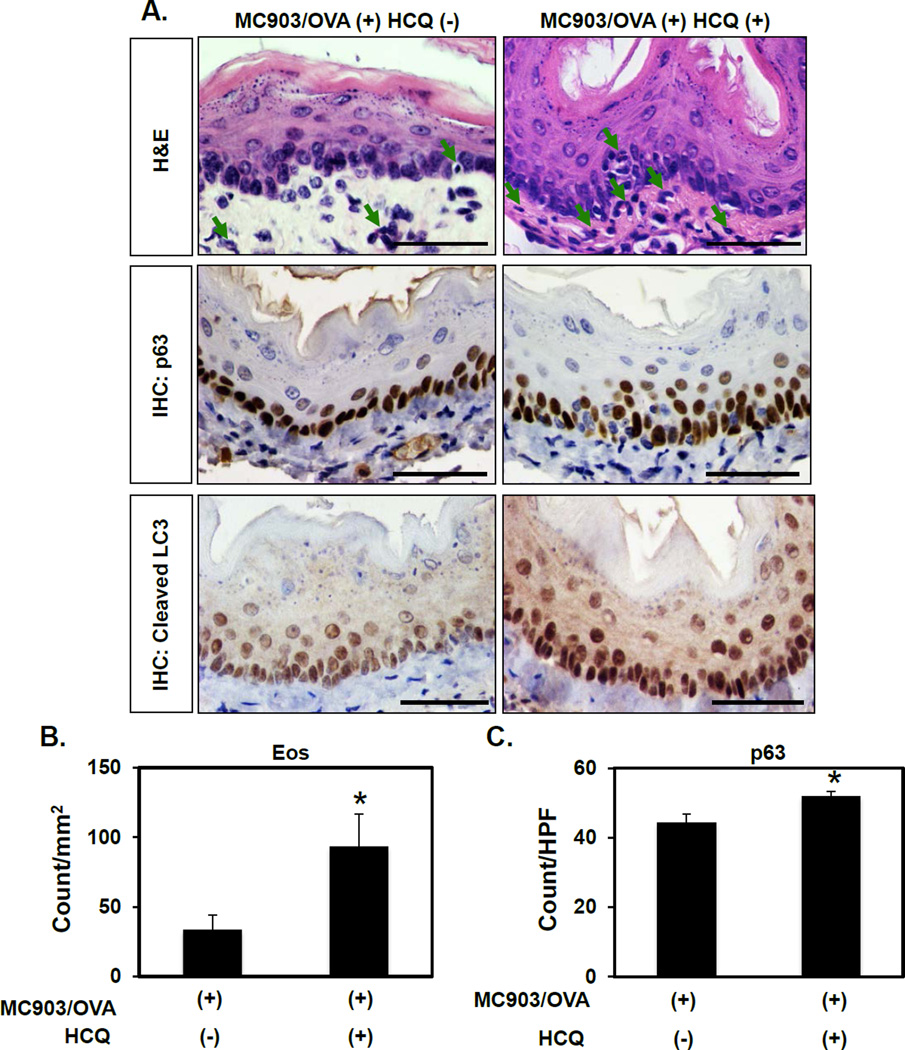
As increased AV content may be reflective of enhanced autophagic flux or a defect in AV clearance, we next sought to distinguish between these possibilities in the context of EoE. Mice with MC903/OVA-mediated EoE-like inflammation were treated with hydroxychloroquine (HCQ), a lysosomotropic agent that prevents autophagic flux by impairing AV-lysosome fusion. HCQ treatment enhanced cleaved LC3 expression in mice with EoE-like inflammation (Figure 2A), suggesting that autophagic flux is activated rather than stalled in oesophageal keratinocytes exposed to EoE inflammation. HCQ-treated animals also exhibited increased eosinophil infiltrate and BCH as compared to vehicle-treated controls (Figure 2), suggesting that autophagic flux limits disease activity in EoE.
Figure 2. Pharmacological inhibition of autophagy promotes eosinophil infiltration and basal cell hyperplasia in a murine EoE model.
BALB/c mice were treated with MC903 and OVA for 32 days. From days 18–32, HCQ (60 mg/kg) (n=4) or vehicle (PBS) (n=7) were delivered via daily i.p. injection. (A) Oesophageal tissues were evaluated by H&E (arrows, eosinophils) as well as IHC for p63 (basal cells) and cleaved LC3 (autophagy). Scale bars, 50 µm. (B and C) Eos and p63-positive basal cells were determined. *p<0.05 vs. MC903/OVA (+) HCQ (−).
Autophagy inhibits cytokine-mediated BCH in oesophageal organoids
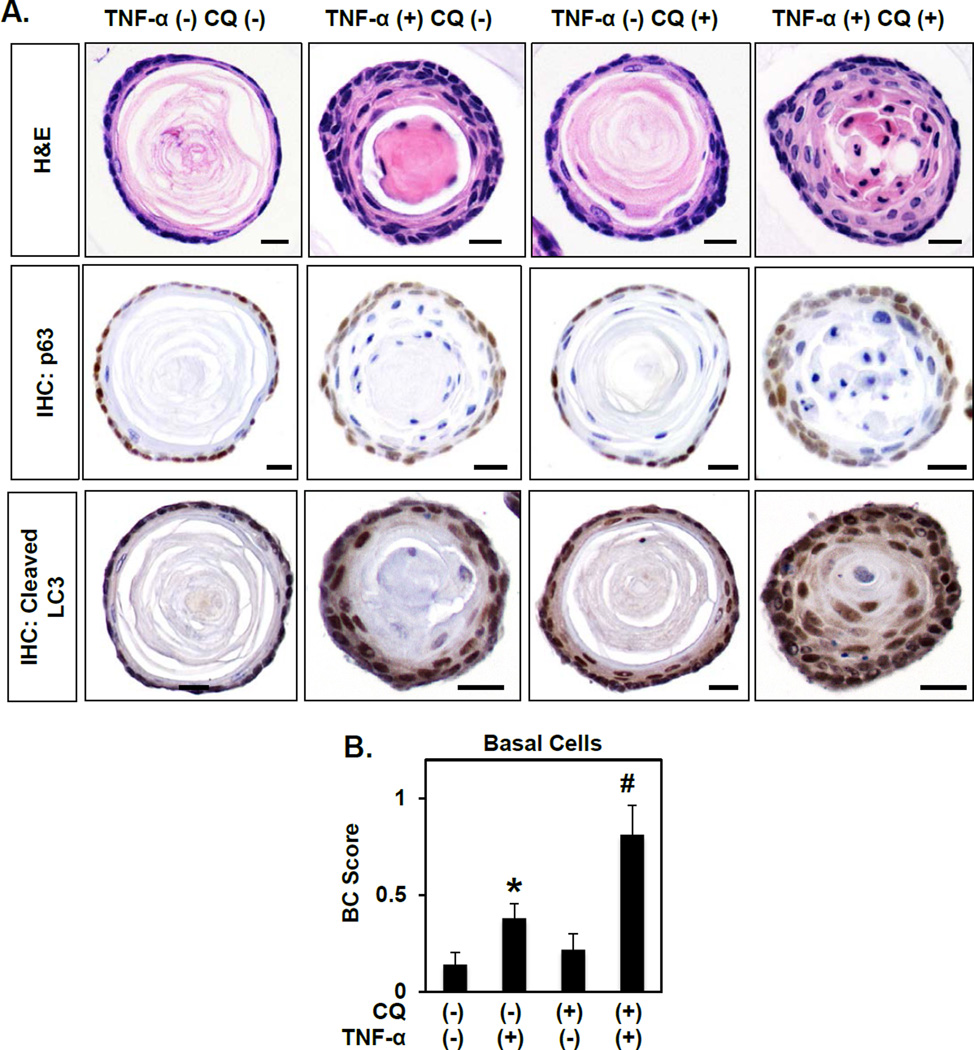
As AV accumulation was apparent in the epithelial compartment of mice with EoE-like inflammation (Figures 1 and 2; Supplementary Figures S2 and S3), we next utilized single cell-derived ex vivo organoid culture to investigate effects of autophagy modulation specifically in oesophageal epithelia. In this three-dimensional (3D) platform, freshly isolated murine oesophageal keratinocytes generate structures with histological features comparable to normal oesophageal epithelia (Figure 3A; Supplementary Figure S4). Specifically, oesophageal organoids comprise a single outer layer of keratinocytes expressing p63 surrounding both adjacent p63-negative cell layers with flattened morphology and a central keratin-filled lumen (Figure 3A). Stimulation with tumor necrosis factor (TNF)-α, an EoE-relevant T helper (Th)1 cytokine, increased the number of cell layers in organoids while concomitantly decreasing the luminal space (Figure 3A and Supplementary Figure S4) suggesting dysregulation of the normal keratinocyte proliferation-differentiation gradient. Basal cell expansion, reminiscent of BCH as found in EoE patients, was documented in TNF-α-stimulated organoids by p63 staining (Figure 3A) and morphology-based scoring (Figure 3B). TNF-α-treated organoids also exhibited increased cleaved LC3 expression compared to their unstimulated counterparts (Figure 3A). To determine if enhanced BCH and cleaved LC3 expression in oesophageal organoids is specific to TNF-α exposure, we evaluated the effects of the Th2 cytokine Interleukin (IL)-13 in this model system. As compared to controls, IL-13-treated structures exhibited a remarkable increase in cell layer number and basal cell content concomitant with enhanced cleaved LC3 expression (Supplementary Figure S5).
Figure 3. Autophagy suppresses TNF-α-mediated basal cell proliferation in oesophageal organoids.
Murine oesophageal 3D organoids were grown ex vivo and treated from days 4–11 with 40 ng/ml TNF-α and/or 1 µg/ml CQ as indicated and subjected to H&E staining or IHC for p63 (basal cells) and cleaved LC3 (autophagy). (A) Representative images. Scale bars, 25 µm. (B) Quantification of basal cell (BC) score based upon morphology. *, p<0.05; vs. TNF-α (−) CQ (−); #, p<0.05; vs. TNF-α (+) CQ (−) and TNF-α (−) CQ (+).
Oesophageal organoids were then cultured in the presence or absence of chloroquine (CQ), a potent inhibitor of AV-lysosome fusion, to evaluate the impact of impaired autophagic flux upon keratinocyte biology and tissue architecture. CQ effectively enhanced cleaved LC3 expression in oesophageal organoids, as expected, but had no significant impact upon organoid structure or basal cell content (Figure 3A, B and Supplementary Figure S4). Combined treatment with CQ and TNF-α resulted in accumulation of cleaved LC3 expression beyond that seen with TNF-α alone (Figure 3A), suggesting that TNF-α promotes autophagy in oesophageal organoids. Co-treatment with CQ and TNF-α exacerbated phenotypes observed with TNF-α treatment alone, resulting in further increases in cell layer number and basal cell expansion with >80% of organoids lacking an identifiable lumen (Figure 3A, B and data not shown). In agreement with our findings in vivo, these studies in oesophageal organoids indicate that epithelial autophagy may serve as a mechanism to suppress excessive basal cell proliferation under conditions of EoE inflammation.
Autophagy is activated in oesophageal keratinocytes responding to EoE-associated inflammatory signals
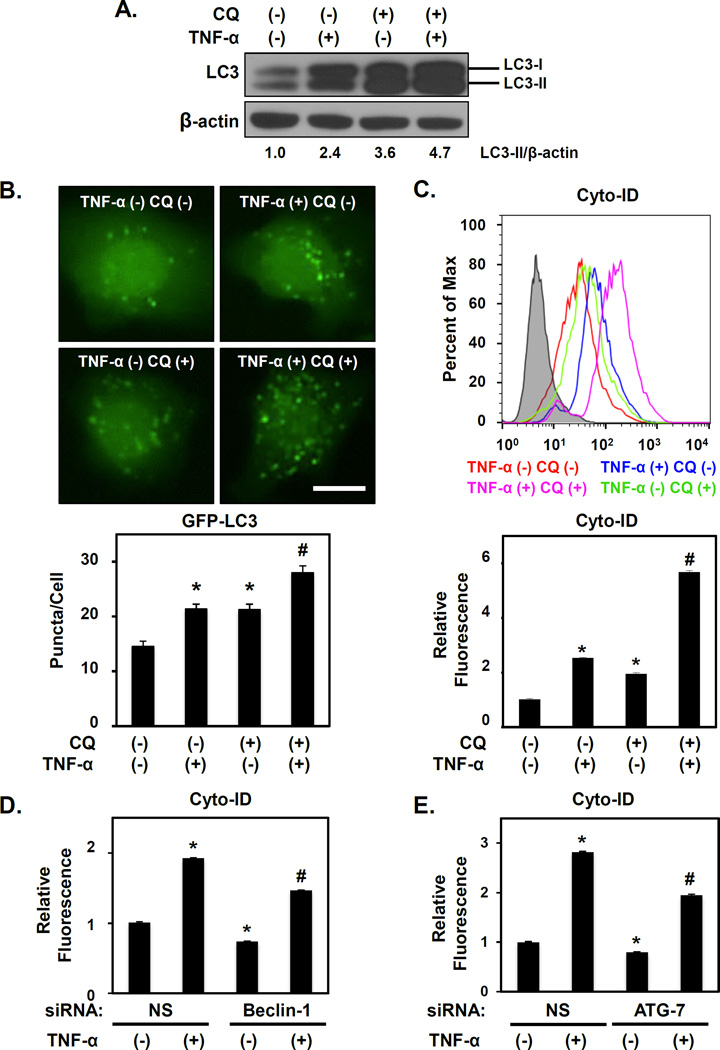
To further investigate the functional role of autophagy in oesophageal keratinocytes responding to EoE-associated inflammation, we stimulated normal immortalized (EPC2-hTERT) as well as normal and active EoE mucosa-derived primary oesophageal keratinocytes with TNF-α. Immunoblot analysis detected a basal level of autophagy in untreated cells, as evidenced by the presence of LC3-II (Figure 4A), LC3-GFP puncta (Figure 4B) and cyto-ID fluorescence (Figure 4C), all indicative of AVs. TNF-α stimulation resulted in robust LC3-II expression (Figure 4A) with concurrent increases in GFP-LC3 puncta (Figure 4B) and cyto-ID fluorescence (Figure 4C). TNF-α also promoted AV accumulation in primary human oesophageal keratinocytes derived from normal (EPC425) and active EoE mucosa (EPC185-5) (Supplementary Figure S6). CQ treatment stalled autophagic flux as indicated by increased LC3-II levels in EPC2-hTERT cells (Figure 4A). TNF-α-mediated LC3-II induction was further augmented in the presence of CQ, (Figure 4A), indicating that TNF-α promotes autophagic flux in oesophageal keratinocytes in vitro, consistent with our findings in murine EoE models and oesophageal organoids (Figure 2 and 3). CQ treatments coupled with GFP-LC3 and Cyto-ID assays confirmed TNF-α-mediated activation of autophagic flux (Figure 4B, C). Moreover, siRNA-mediated depletion of Beclin-1 or ATG7 in EPC2-hTERT cells limited LC3-II accumulation and Cyto-ID fluorescence under basal conditions and in response to TNF-α (Figure 4D, E and Supplementary Figure S7).
Figure 4. TNF-α activates autophagic flux in normal human oesophageal keratinocytes.
EPC2-hTERT cells were treated with 40 ng/ml TNF-α and/or 1 µg/ml CQ as indicated for 72 hours in (A)–(C); and for 72 hours following transfection with Beclin-1 siRNA, ATG-7 siRNA or non-silencing (NS) control siRNA in (D and E). Immunoblot determined LC3 (densitometry shown at bottom) with β-actin as a loading control in (A). Live cell imaging determined GFP-LC3 puncta in (B) with representative cell images (Top, Scale bar, 20µm) and average puncta/cell (Bottom). Flow cytometry determined Cyto-ID in (C–E) with representative histogram plot for each condition (Top in C) and relative Cyto-ID levels (average geometric mean)(Bottom in C). D and E. *, p<0.05; vs. TNF-α (−) CQ (−); #, p<0.05; vs. TNF-α (+) CQ (−) and TNF-α (−) CQ (+);(n=3) in (B) and (C). *p<0.05 vs. NS and TNF-α (−); #, p<0.05 vs. NS and TNF-α (+);(n=3) in (D, E). All data represent 3–5 independent experiments with similar results.
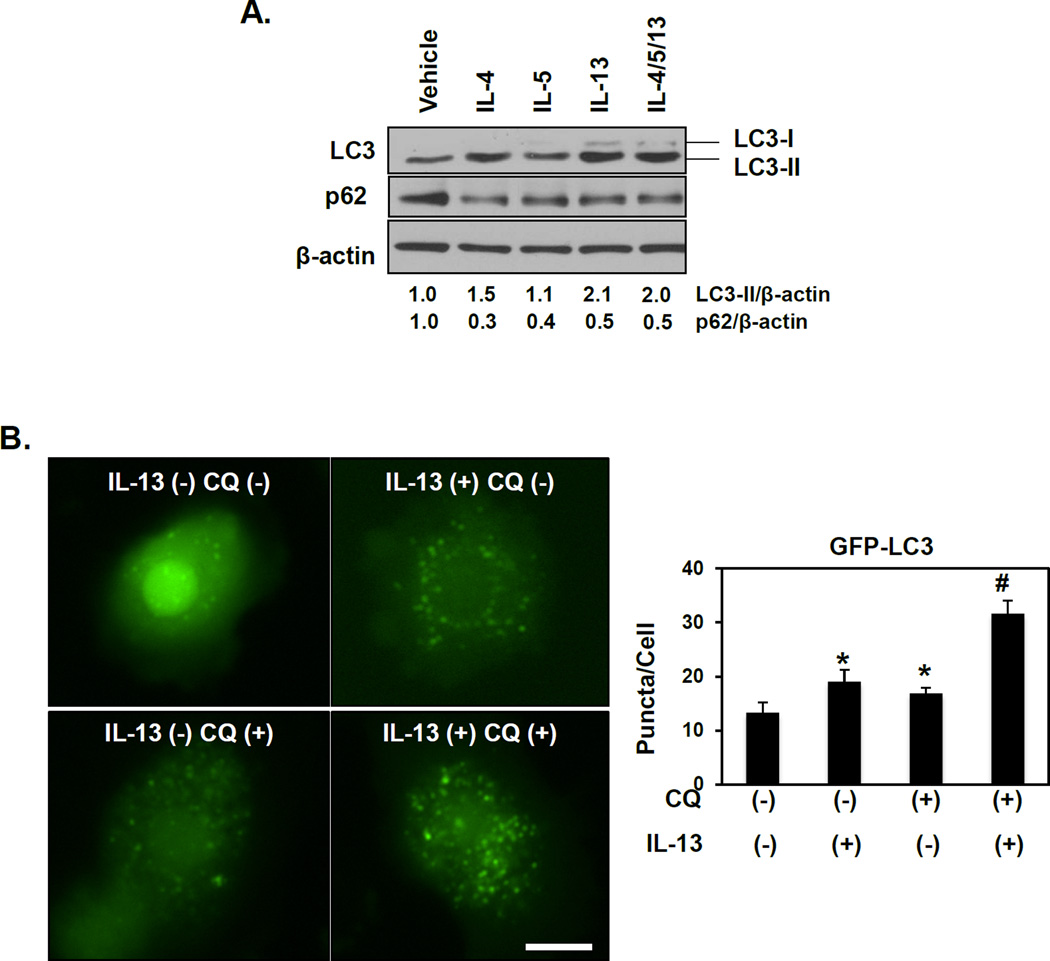
We then evaluated autophagic flux in response to EoE-relevant Th2 cytokines. Treatment of EPC2-hTERT cells with IL-4, IL-5, IL-13 or a combination of these cytokines increased LC3-II expression to a varying degree (Figure 5A). A concurrent decrease in expression of p62/SQSTM1 (p62), an autophagy cargo-identifying protein that is degraded upon AV-lysosome fusion, was documented upon stimulation with IL-4, IL-5 or IL-13 alone or in combination (Figure 5A), suggesting activation of autophagic flux in response to EoE inflammatory stimuli. To confirm activation of flux, GFP-LC3 expressing EPC2-hTERT cells were treated with IL-13 alone or in combination with CQ. Indeed, IL-13 stimulation increased GFP-LC3 puncta level with further enhancement upon CQ co-treatment (Figure 5B). Thus, IL-13, like TNF-α, activates autophagic flux in oesophageal keratinocytes. Taken together, these findings suggest that autophagy is activated in oesophageal keratinocytes upon exposure to EoE-relevant inflammatory cues.
Figure 5. EoE-relevant Th2 cytokines promote autophagic flux in oesophageal keratinocytes.
EPC2-hTERT cells were stimulated with 10 ng/ml IL-4, IL-5 and IL-13 in the presence or absence of 1 µg/ml CQ as indicated. (A) After 24 hours, immunoblot determined LC3-II and p62 (densitometry shown at bottom) with β-actin as a loading control. (B) After 72 hours, live cell imaging determined GFP-LC3 puncta with representative cell images (Left, Scale bar, 20 µm) and average GFP-LC3 puncta/cell (Right). *, p<0.05 vs. IL-13 (−) CQ (−); #, p<0.05 vs. IL-13 (+) CQ (−) and IL-13 (−) CQ (+); n=3.
Reactive oxygen species mediate epithelial autophagy activation in response to EoE-associated inflammatory stimuli
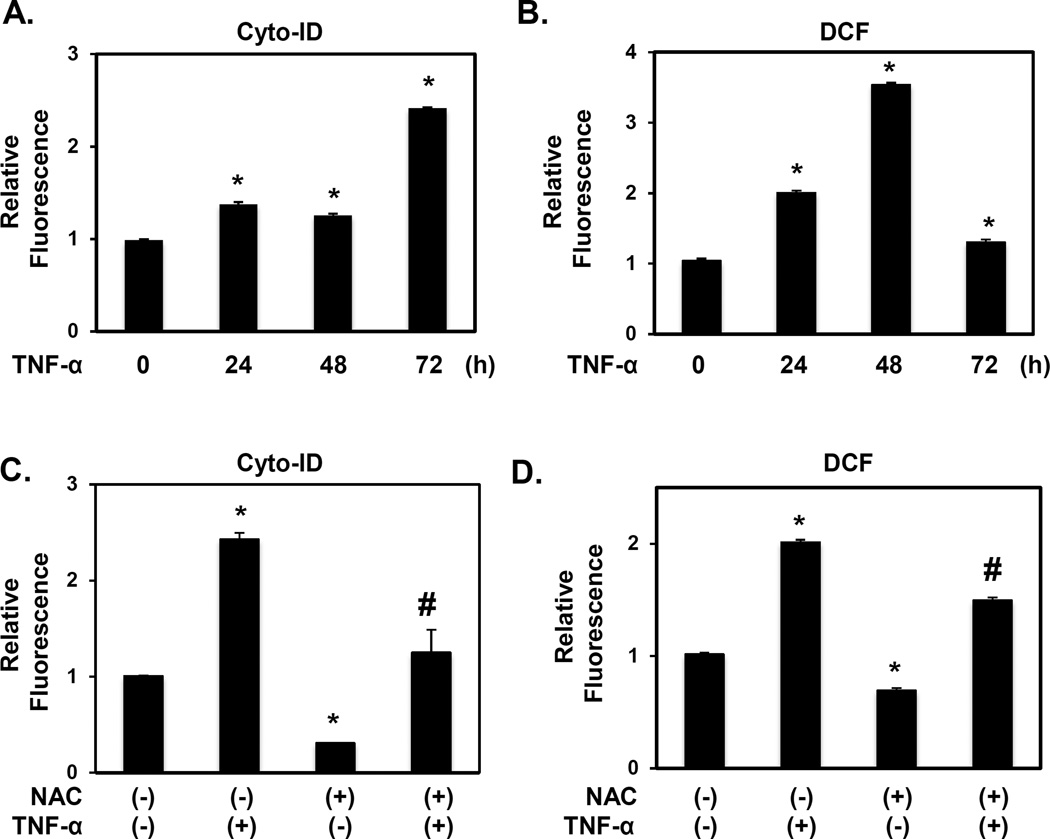
Given the robust induction of keratinocyte autophagy by EoE-relevant cytokines in vitro (Figures 4 and 5; Supplementary Figures S6), we next investigated potential mechanisms supporting epithelial autophagy activation. In EPC2-hTERT cells, TNF-α stimulation resulted in approximately 1.5-fold AV induction, as measured by Cyto-ID fluorescence, within 24–48 hours followed by a more apparent (2.5-fold) increase after 72 hours (Figure 6A). TNF-α and IL-13 induced reactive oxygen species (ROS), within 24–72 hours in EPC2-hTERT and EPC425 as indicated by accumulation of DCF fluorescence and protein oxidation (Figure 6B, Supplementary Figure S8). Since ROS stimulate autophagy in other systems, we assessed the temporal kinetics of ROS induction in TNF-α-treated EPC2-hTERT cells. Interestingly, ROS accumulation preceded maximal autophagy induction (Figure 6A, B), suggesting that activation of autophagy in response to EoE-relevant cytokines may be ROS-dependent. Indeed, pretreatment of EPC2-hTERT cells with the ROS scavenger N-acetyl-L-cysteine (NAC) blunted induction of autophagy by either TNF-α or IL-13 with concurrent suppression of ROS (Figure 6C, D and Supplementary Figure S9). Thus, oxidative stress in oesophageal keratinocytes exposed to EoE-relevant inflammatory stimuli may act as a signal to activate autophagy.
Figure 6. TNF-α-mediated autophagy activation in oesophageal keratinocytes is ROS dependent.
EPC2-hTERT cells were stimulated with 40 ng/ml TNF-α for indicated time periods in (A and B); or 72 hours following 10 mM NAC pretreatment for 1 hour (C and D). Cells were subjected to flow cytometry for Cyto-ID (A and C) or DCF (B, D) to determine relative AV and ROS levels, respectively. *, p<0.05 vs. 0 h in (A and B); vs. TNF-α (−) and NAC (−) in (C and D); n=3. #, p<0.05; vs. TNF-α (+) and NAC (−) in (C and D); n=3. All data represent at least three independent experiments with similar results.
Epithelial autophagy mitigates oxidative stress induced by EoE-associated inflammation
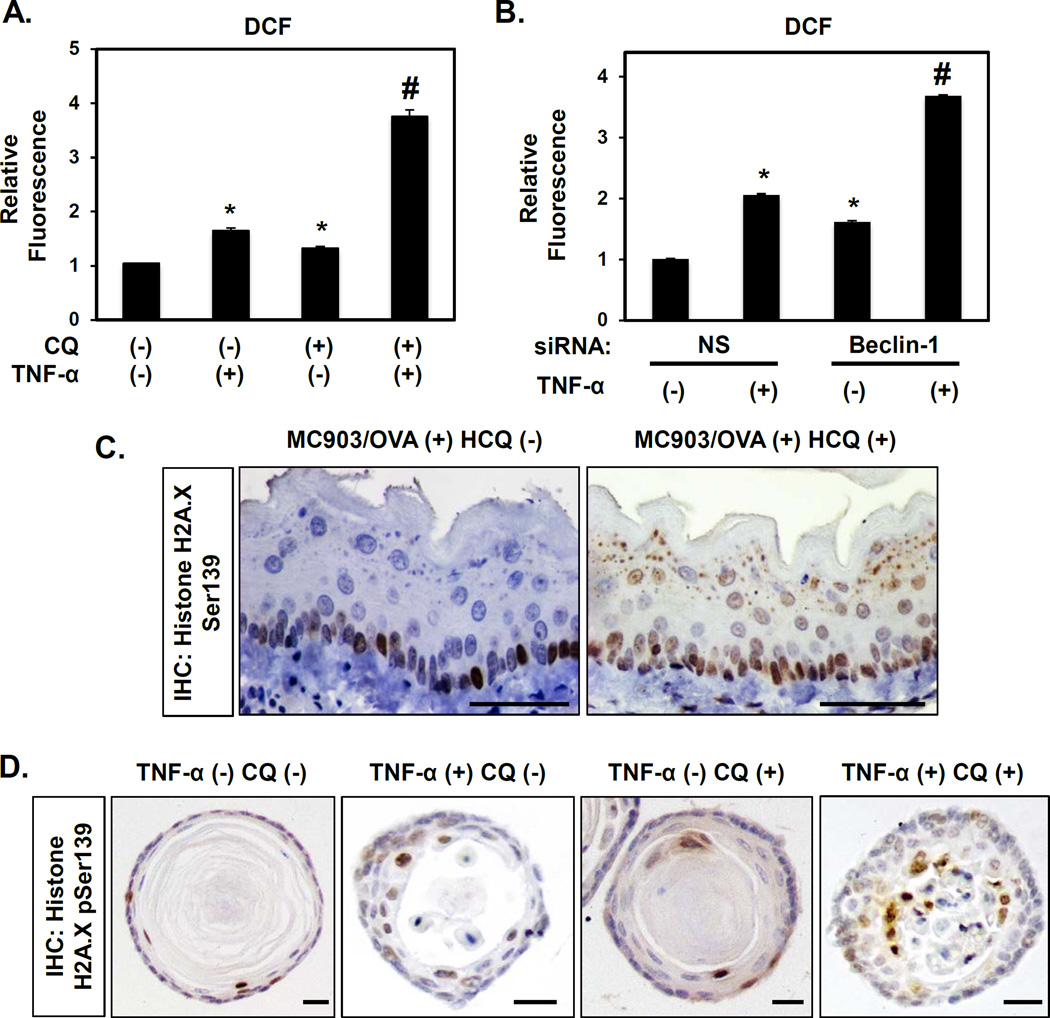
TNF-α promoted maximal autophagy in EPC2-hTERT cells at 72 hours post-treatment (Figure 6A), the time point at which TNF-α-mediated ROS level exhibited recovery following a peak at 48 hours post-stimulation (Figure 6B). Based upon this observation, we hypothesized that autophagy alleviates oxidative stress in oesophageal keratinocytes exposed to EoE inflammation. In support of this notion, inhibition of autophagy by either CQ or siRNA targeting Beclin-1 was sufficient to sustain ROS in EPC2-hTERT cells (Figure 7A, B). These in vitro findings support the premise that EoE-relevant cytokines activate autophagy to restore keratinocyte redox homeostasis.
Figure 7. Autophagy inhibition promotes oxidative stress in oesophageal keratinocytes exposed to EoE-relevant inflammatory stimuli.
EPC2-hTERT cells were stimulated for 72 hours with or without concurrent 1 µg/ml CQ treatment in (A); or 72 hours following transfection with Beclin-1 siRNA or non-silencing (NS) control siRNA in (B). (A and B) Flow cytometry for DCF determined relative ROS levels. *, p<0.05 vs. TNF-α (−) and CQ (−); (n=3) in (A); and vs. NS and TNF-α (−); (n=3) in (B). #, p<0.05 vs. TNF-α (+) and CQ (−) or TNF-α (−) and CQ (+); (n=3) in (A); vs. NS and TNF-α (+); (n=3) in (B). (C) BALB/c mice were treated with MC903 and OVA for 32 days. From days 18–32, HCQ (60 mg/kg) (n=4) or vehicle (PBS) (n=7) was delivered via daily i.p. injection. Oesophageal tissues were evaluated by IHC for Histone H2A.X pSer139 (oxidative stress). Scale bars, 50 µm. (D) Murine oesophageal 3D organoids treated with or without 40 ng/ml TNF-α and/or 1 µg/ml CQ were subjected to IHC for Histone H2A.X pSer139 (oxidative stress). Scale bars, 25 µm.
We then continued to investigate the relationship between ROS and autophagy in murine models of EoE and found that expression of Histone H2A.X phosphorylated at Serine139 (p-H2A.XSer139), a surrogate marker of oxidative stress, was enhanced in oesophageal epithelia of mice with EoE-like inflammation as compared to control animals (Supplementary Figure S10). In MC903/OVA-induced EoE, inhibition of autophagic flux via HCQ administration further augmented oxidative stress (Figure 7C). Furthermore, TNF-α and IL-13 promoted oxidative stress in oesophageal organoids (Figure 7D and Supplementary Figure S5) and inhibition of autophagic flux with CQ exacerbated oxidative stress induced by TNF-α (Figure 7D).
Evidence of active autophagy in active EoE patients
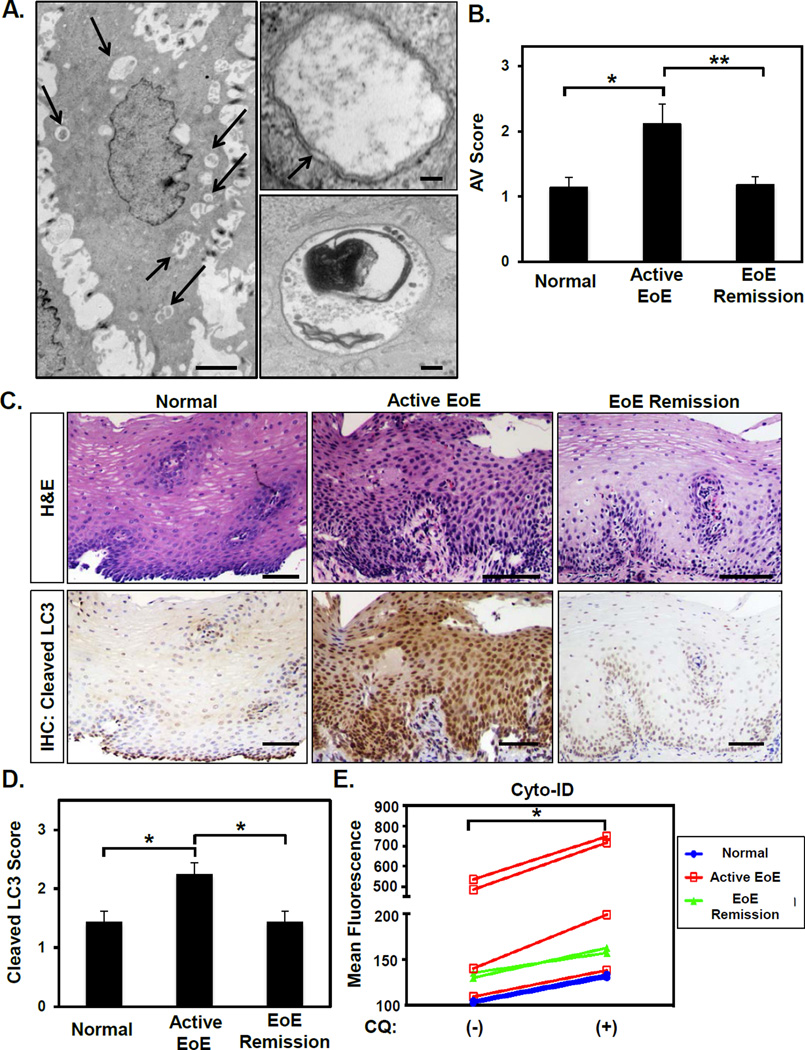
We next evaluated AV content in oesophageal biopsies from human pediatric EoE and normal patients (Supplementary Table S1). Ultrastructural evaluation of oesophageal epithelia with active EoE inflammation by TEM revealed intraepithelial eosinophils (Supplementary Figure S11) and intracellular double-membrane structures surrounding cytoplasmic material consistent with AVs (Figure 8A). Of 9 active EoE subjects, 6 (66.7%) displayed AV positivity in >10% of oesophageal keratinocytes with AV-positive cells extending from the basal to the spinous layers (Supplementary Figure S11; Supplementary Table S1). By contrast, 6 of 7 subjects (85.7%) in the normal group and 9 of 11 subjects (81.8%) in the EoE remission group exhibited limited AV-positive keratinocytes (<10%) with AVs largely confined to basal and parabasal layers (Supplementary Figure S11; Supplementary Table S1). Overall, TEM scoring indicated that AV content is increased in oesophageal epithelium of patients with active EoE (n=9) as compared to normal (n=7; p=0.016) and EoE remission subjects (n=11; p=0.009)(Figure 8B). Additionally, TEM analysis identified both early and late AVs in oesophageal epithelia of active EoE subjects (Figure 8A), suggesting activation of keratinocyte autophagy via AV maturation in the EoE inflammatory microenvironment.
Figure 8. Oesophageal epithelial AV content and LC3 cleavage are increased in pediatric active EoE patients where autophagic flux is present.
TEM (A and B), cleaved LC3 IHC (C and D) and Cyto-ID flow cytometry (E) in oesophageal biopsies. (A), Left, An oesophageal keratinocyte from active EoE containing AVs (arrows). Scale bar, 2 µm Right, Early AV with double-membrane (arrow) containing cytosolic material (top) and late AV containing electron dense material indicating digested cellular components (bottom). Scale bars, 100 nm. (B) Average AV score for indicated patient groups: normal (n=7), active EoE (n=9) and EoE remission (n=11). *, p<0.05; **, p<0.01. (C) H&E (top) and cleaved LC3 (bottom, autophagy) staining for indicated patient groups. Scale bars, 100µm. (D) Average epithelial cleaved LC3 score in indicated patient groups: normal (n=10), active EoE (n=14) and EoE remission (n=8). *, p<0.01. (E) Oesophageal biopsies from normal (n=2), active EoE (n=4) and EoE remission (n=2) patients were dissociated. Cyto-ID fluorescence in live cells was measured by flow cytometry following ex vivo treatment with or without CQ (50 µg/ml) for 3 hours. *, p<0.05.
We continued to assess AV content in human biopsies utilizing IHC for cleaved LC3 expression. Cleaved LC3 staining was detected throughout oesophageal epithelium in 12 of 14 active EoE patients (85.7%)(Figure 8C; Supplementary Table S1). By contrast, 6 of the 10 normal (60.0%) and 5 of the 8 EoE remission patients (62.5%) exhibited cleaved LC3 expression confined to the basal and parabasal layers (Figure 8C; Supplementary Table S1). Cytosolic LC3 puncta indicating AVs were documented in ≥20% of oesophageal keratinocytes in specimens with intense cleaved LC3 staining (Supplementary Figure S12A). In accordance with our TEM findings, comprehensive IHC scoring (Supplementary Figure S12B) revealed elevated cleaved LC3 staining in active EoE (n=14) as compared to normal (n=10; p=0.003) or EoE remission (n=8; p=0.006) subjects (Figure 8D). Notably, AV content as measured by either TEM or cleaved LC3 IHC correlated significantly with basal cell content in human oesophageal epithelia (Supplementary Figure S13), implying autophagy in BCH associated with active EoE.
Finally, we aimed to assess autophagic flux in normal and EoE patient biopsies. Flow cytometric analysis revealed that normal (n=2) and EoE remission (n=2) patients exhibited Cyto-ID positivity ranging from 2.8–6.5%. Cyto-ID positivity in active EoE patients (n=4) ranged from 4.7% to 32.4% with 3 of the 4 evaluated patients displaying greater Cyto-ID positivity and fluorescence than that noted in normal or EoE remission mucosa (Supplementary Table S1 and Figure 8E). Across all patients, ex vivo CQ treatment increased Cyto-ID fluorescence (p=0.03)(Figure 8E), indicating the presence of autophagic flux. In sum, these findings suggest that normal oesophageal epithelia maintain a basal level of autophagy that is increased during EoE inflammation then restored to baseline upon remission.
Discussion
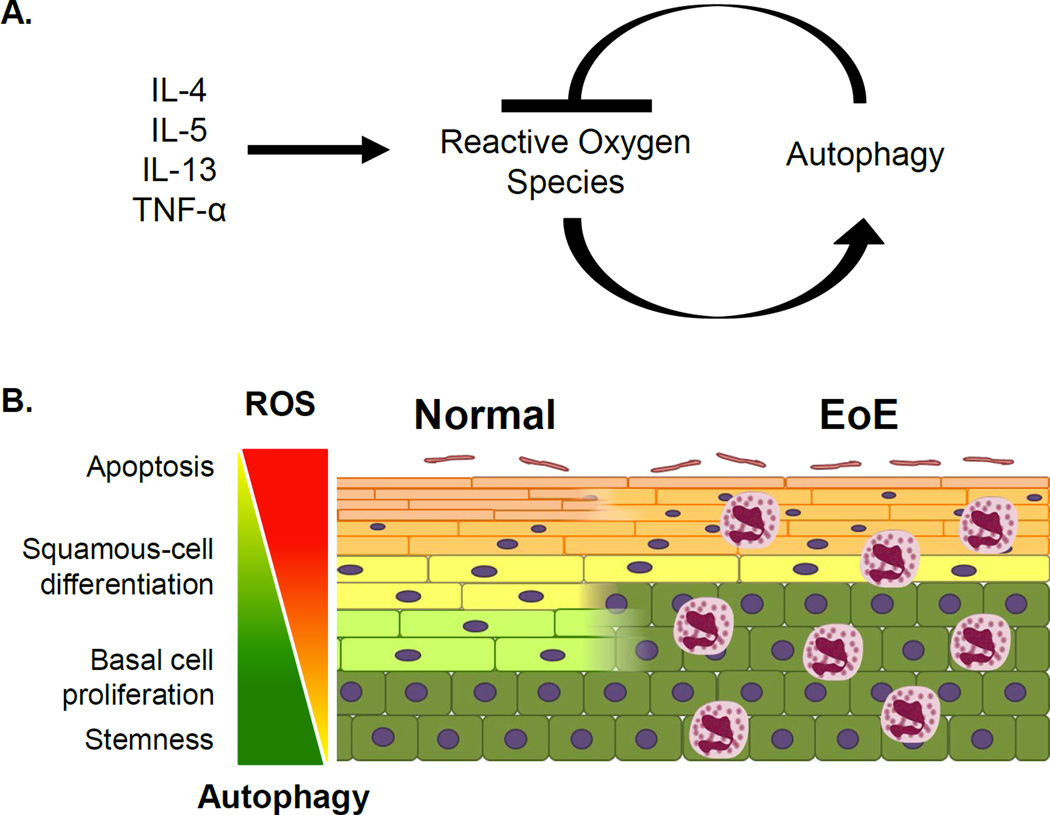
Our studies suggest that oxidative stress-mediated autophagy in oesophageal keratinocytes acts to maintain redox balance and epithelial homeostasis upon exposure to EoE inflammation (Figure 9). In normal human oesophageal epithelia, complementary analyses of AVs and cleaved LC3 distribution suggest that autophagy is predominantly present in basal keratinocytes (Figure 8A–D and Supplementary Figures S11 and S12). Emerging evidence indicates that basal oesophageal keratinocytes exhibit heterogeneity with regard to self-renewal and differentiation capabilities.20,26,27 Autophagy maintains self-renewal capacity of hematopoietic stem cells;28 therefore, it is plausible that autophagy may regulate stem cell dynamics in oesophageal epithelia. The majority of basal oesophageal keratinocytes express cleaved LC3 in the nucleus in tissues from human patients (Figure 8C) and murine models (Figures 1A and 2A and Supplementary Figure S2) as well as in ex vivo oesophageal organoids (Figure 3A, Supplementary Figure S5). As LC3 is deacetylated in the nucleus prior to incorporation into cytosolic AVs during starvation-induced autophagy,24,25 it is possible that basal keratinocytes may be primed to execute autophagy upon perturbation of homeostasis. As nuclear LC3 undergoes redistribution into the cytosol upon autophagy activation in vitro (Figures 4B and 5B), the rather elevated nuclear LC3 expression in situ may be reflective of decreased autophagic flux in the tissue context as compared to that found in vitro.
Figure 9. Model depicting the dynamic interplay between autophagy and ROS in the context of EoE inflammation.
(A) EoE-relevant cytokines promote ROS accumulation to activate autophagy which subsequently suppresses ROS. (B) The balance between autophagy and ROS may be a critical determinant of oesophageal keratinocyte cell fate. In EoE, the inflammatory milieu promotes BCH as squamous cell differentiation is impaired. Under these conditions, autophagy may act as a homeostatic mechanism to maintain cellular redox balance and prevent excessive basal cell proliferation as well as cell death.
Extrapolating upon our findings, we postulate that the balance between autophagy and ROS is a critical determinant of oesophageal keratinocyte cell fate (Figure 9B). Under normal conditions, active autophagy in a subset of basal keratinocytes may maintain low ROS to preserve cells with quiescent stem-like properties. In actively proliferating basal keratinocytes, autophagy flux is present at a level that is permissive for ROS-mediated mitotic signaling. As cells move from the basal cell layer, autophagic activity may then decline to allow ROS accumulation and terminal differentiation23. Under conditions of EoE inflammation, BCH prevails while squamous cell differentiation is suppressed.23,29 We hypothesize that epithelial autophagy in EoE serves as a mechanism to maintain keratinocyte redox balance, thereby minimizing EoE-associated BCH while preventing deleterious effects of excessive ROS, including cell death.
Our data suggest that multiple cytokines activate epithelial autophagy in EoE. Experiments utilizing CQ confirmed induction of autophagic flux rather than defective AV clearance in oesophageal keratinocytes exposed to EoE inflammation (Figures 2–4 and 8). Moreover, genetic autophagy depletion via siRNA targeting Beclin-1 or ATG-7 inhibited basal and cytokine-induced autophagy, albeit not completely (Figure 4D, E and Supplementary Figure S7). Oesophageal keratinocytes isolated from ATG-7 deficient mice or CRISPR/Cas9-mediated ablation of ATG-7 or Beclin-1 will help to better define the role of autophagy in oesophageal biology and EoE pathogenesis in future studies. Expression of receptors for IL-4, IL-5 and IL-13 has been documented in oesophageal keratinocytes;30,31 however, the influence of these cytokines upon epithelial biology is still emerging. IL-4 and IL-13 suppress autophagy in epithelial and immune cells responding to starvation and M. Tuberculosis infection, respectively.32,33 The current study, along with a recent report demonstrating that IL-13 activates autophagy in airway epithelial cells to promote mucus secretion,34 indicates that regulation of autophagy by Th2 cytokines may be cell type- and/or context-dependent. As primary oesophageal keratinocytes from normal and active EoE mucosa display similar autophagy level at baseline and in response to TNF-α in vitro (Supplementary Figure S6), we propose that autophagy activation in EoE patients results from exposure to the inflammatory milieu rather than from any intrinsic alteration in oesophageal keratinocytes. These observations are in keeping with previous studies demonstrating that non-EoE and EoE-derived primary oesophageal keratinocytes exhibit similar growth characteristics and gene expression in response to IL-4, IL-13 or acid exposure.35,36 TNF-α and IL-13 also promoted cleaved LC3 expression concurrent with basal cell proliferation in ex vivo 3D oesophageal organoids (Figure 3 and Supplementary Figure S5).
We identify a dynamic interplay between ROS and autophagy in EoE whereby EoE-relevant cytokines induce ROS in oesophageal keratinocytes in which autophagy is subsequently activated to modulate oxidative stress. Autophagy inhibition in mice with EoE-like inflammation enhances oxidative stress as well as eosinophil infiltration (Figures 2 and 7). While ROS have been implicated in immune cell mobilization, eosinophils are also known to generate ROS.37 As expression of histone H2A.X pSer139 and cleaved LC3 are comparable in MC903/OVA-treated mice with eosinophilia that is largely confined to the lamina propria (Figure 1 and Supplementary Figure S10A) and L2-IL5/OXA mice exhibiting robust intraepithelial eosinophilia (Supplementary Figures S3 and S10B)22, induction of epithelial oxidative stress and autophagy under conditions of EoE inflammation may be influenced by factors beyond the extent and localization of eosinophilic infiltrates in oesophageal mucosa. Thus, additional studies are required to define the relationship between epithelial autophagy and eosinophil recruitment in EoE. We have previously demonstrated that ROS-scavenging enzymes regulate epithelial-mesenchymal transition (EMT).38 As EMT has been implicated in EoE pathogenesis,39,40 it will be interesting to investigate roles for antioxidants in maintaining epithelial homeostasis in response to EoE inflammation.
We demonstrate for the first time that human patients with active EoE display active autophagy (Figure 8). Given the marked difference in AV content between active EoE patients and both normal and EoE remission subjects, evaluation of autophagy markers may unveil novel biomarkers for EoE diagnosis, monitoring and prognosis. Indeed, we have recently identified ATG7 as a tissue biomarker distinguishing active EoE from normal, EoE remission and proton pump inhibitor (PPI)-treated gastro-oesophageal reflux disease (GORD) in pediatric patients (Merves, et al. Am J Gastroenterol. In Press). Like EoE, GORD involves cytokine-mediated tissue injury and oxidative stress41. PPI usage prior to endoscopy in 65 of the 67 human subjects in the current study precludes evaluation of the influence of reflux-associated inflammation upon autophagy; however, we find that autophagy facilitates survival in the context of acid stress in EPC2-hTERT cells and Barrett’s oesophagus (BE)-derived cell lines.42 Moreover, AV content is increased in oesophagi of mice with IL-1β-mediated inflammation prior to the onset of columnar metaplasia as well as in oesophageal biopsies from BE patients.42,43 Thus, it is plausible that keratinocyte autophagy is activated in response to a diverse spectrum of stress signals, potentially contributing to the pathogenesis of multiple oesophageal disorders.
Unlike in Crohn Disease, our findings did not support stalled epithelial autophagy in pediatric EoE; however, as autophagy diminishes with age,44 dysregulation of this process in oesophageal epithelia of older patients may contribute to development of EoE-associated complications, including stricture formation.45 Although emerging evidence indicates that epithelial cells are essential effectors of fibrotic remodeling in the subepithelial space,18,39,46 what role, if any, autophagy plays in this process has yet to be elucidated. Moreover, while TEM, cleaved LC3 IHC and flow cytometric analyses indicate that autophagy activity is largely present in oesophageal epithelia (Figure 8 and data not shown), as corroborated by our finding in oesophageal organoid culture in the absence of non-epithelial cells (Figure 3 and Supplementary Figure S5), more rigorous studies are required to evaluate autophagy activity in other cell types, including fibroblasts and immune cells. This is the first study to apply 3D oesophageal organoids as an experimental platform to model EoE with recapitulation of human pathology. As oesophageal organoid culture is further developed to include biochemical and functional analyses of human and murine keratinocytes, this approach may be used to complement in vivo and in vitro model systems for future studies into keratinocyte biology and preclinical testing of therapeutic agents under broader conditions of health and disease.
Based upon the apparent cytoprotective nature of autophagy in EoE, we plan to investigate the therapeutic utility of autophagy activation. Rapamycin, an autophagy-promoting agent with immunosuppressant activity, attenuates food allergy in a murine model,47 warranting investigation of this agent’s effects upon EoE. Furthermore, our study suggests that autophagy inhibitors (e.g. CQ) should be used with caution for prevention or treatment of conditions such as malaria and SLE, respectively, to avoid disease exacerbation in EoE patients.
Supplementary Material
Significance of this study.
What is already known about this subject?
EoE is characterized by an eosinophil-rich inflammatory infiltrate in oesophageal epithelium leading to tissue remodeling and fibrotic stricture.
Autophagy may exert either protective or disease-promoting effects on cellular biology in a context-dependent manner.
Dysregulation of autophagic flux may contribute to gastrointestinal pathologies, most notably Crohn disease.
What are the new findings?
Autophagic flux suppresses eosinophil infiltration, basal cell hyperplasia and oxidative stress in a murine model of EoE.
EoE-relevant cytokines, including TNF-α and IL-13, activate autophagic flux in oesophageal keratinocytes in vitro.
In a novel ex vivo oesophageal organoid model, stimulation with TNF-α or IL-13 recapitulates EoE-associated basal cell hyperplasia and activates autophagic flux to suppress basal cell proliferation and oxidative stress.
In oesophageal epithelia of patients with active EoE, autophagic vesicle content is increased and autophagic flux is present.
How might it impact on clinical practice in the foreseeable future?
Activation of autophagy may provide epithelial cytoprotection and a novel therapeutic avenue in EoE.
Investigation of the autophagy pathway may identify novel biomarkers for EoE diagnosis, monitoring and prognosis.
Drugs inhibiting autophagic flux (e.g. chloroquine) may aggravate EoE disease activity.
Acknowledgments
We appreciate the support of Dr. Anil K. Rustgi and the members of his laboratory. We thank Ben Rhoades and Hiroki Okumura for technical support. We acknowledge Mrs. Sally Derr for assistance with Electron Microscopy as well as the staff at the Electron Microscopy Resource Laboratory, the Flow Cytometry and Cell Sorting Resource Laboratory. Prasanna Chandramouleeswaran is currently in the Graduate program in Cell Biology, Physiology, and Metabolism at the University of Pennsylvania.
Funding This study was supported by the following NIH Grants: P01CA098101 (HN, KAW, KT, AKS, VG) K26RR032714 (HN), R01DK100342 (JQ), R01DK087789 (MLW, HN, JMS), K24DK100303 (GTF), K01DK103953 (KAW), F32CA174176 (KAW), K08DK106444 (ABM), F32DK100088 (ABM), K01 DK100485 (KEH), T32DK007066 (KAW, JFM, BCG), NIH/NIDDK P30-DK050306 Center of Molecular Studies in Digestive and Liver Diseases, The Molecular Pathology and Imaging, Molecular Biology/Gene Expression and Cell Culture Core Facilities. Additional support was provided by NASPGHAN Foundation/Takeda Pharmaceutical Products Inc. Research Innovation Award (HN), American Partnership For Eosinophilic Disorders Hope Award (ABM), Abbott Nutrition (MLW), Joint Penn-CHOP Center in Digestive, Liver and Pancreatic Medicine at The Perelman School of Medicine, University of Pennsylvania (ABM, HN), Fonds de Recherche en Santé du Québec (P-Giroux-27692 to VG).
Abbreviations
- ATG
autophagy-related
- AV(s)
autophagic vesicle(s)
- BE
Barrett’s oesophagus
- BC
basal cell
- BCH
basal cell hyperplasia
- CQ
chloroquine
- DAPI
4',6-diamidino-2-phenylindole
- DCF
2’, 7’-dichlorodihydrofluorescein diacetate
- DOX
Doxycycline
- DPBS
Dulbecco’s Phosphate-Buffered Saline
- EGD
oesophagogastroduodenoscopy
- EMT
epithelial-mesenchymal transition
- EoE
eosinophilic oesophagitis
- Eos
eosinophils
- GORD
gastro-oesophageal reflux disease
- GFP
green fluorescent protein
- H&E
Hematoxylin and Eosin
- hpf
high-powered field
- HCQ
hydroxychloroquine
- IACUC
Institutional Animal Care and Use Committee
- IHC
Immunohistochemistry
- IL
Interleukin
- i.p.
intraperitoneal
- KSFM
keratinocyte serum free medium
- LC3
light chain 3
- NAC
N-acetyl-L-cysteine
- OVA
ovalbumin
- OXA
oxazolone
- p-H2AXSer139
phospho-Histone H2A.X Serine139
- PPI
proton pump inhibitor
- ROS
reactive oxygen species
- siRNA
small interfering RNA
- SLE
systemic lupus erythematosus
- Th
T Helper; 3D, three-dimensional
- TEM
transmission electron microscopy
- TNF
tumor necrosis factor
Footnotes
Contributors Experimental design (HN, KAW, JM, VG, ABM, GTF, MLW, JMS, GWF); experimental execution (KAW, JM, VG, ABM, KD, KT, SC, AJB, AG, PMC, JCM, SDF, BCG); data analysis and interpretation (KAW, JM, AG, KT, VG, SDF, GTF, GWF, HN, KEH,JMS, MLW, AJB, AKS); reagents/materials/analysis tool contributions (AJB, HN, MLW, JQ, AKS, KC, EDR); manuscript writing/editing (KAW, JM, ABM, JMS, JQ, KEH, MLW, HN, GWF).
Provenance and peer review Not commissioned; externally peer reviewed.
Ethics approval Human patient studies were approved by the Institutional Review Board at Children’s Hospital of Philadelphia. Murine studies were approved by the Institutional Animal Care and Use Committee at the University of Pennsylvania.
Competing interests The authors have no competing interests to declare.
References
- 1.Dellon ES, Liacouras CA. Advances in clinical management of eosinophilic esophagitis. Gastroenterology. 2014;147(6):1238–1254. doi: 10.1053/j.gastro.2014.07.055. [DOI] [PMC free article] [PubMed] [Google Scholar]
- 2.Merves J, Muir A, Modayur Chandramouleeswaran P, et al. Eosinophilic esophagitis. Ann Allergy Asthma Immunol. 2014;112(5):397–403. doi: 10.1016/j.anai.2014.01.023. [DOI] [PMC free article] [PubMed] [Google Scholar]
- 3.Cianferoni A, Spergel JM, Muir A. Recent advances in the pathological understanding of eosinophilic esophagitis. Expert Rev Gastroenterol Hepatol. 2015;9(12):1501–1510. doi: 10.1586/17474124.2015.1094372. [DOI] [PMC free article] [PubMed] [Google Scholar]
- 4.Capocelli KE, Fernando SD, Menard-Katcher C, et al. Ultrastructural features of eosinophilic oesophagitis: impact of treatment on desmosomes. J Clin Pathol. 2015;68(1):51–56. doi: 10.1136/jclinpath-2014-202586. [DOI] [PMC free article] [PubMed] [Google Scholar]
- 5.Katzka DA, Ravi K, Geno DM, et al. Endoscopic Mucosal Impedance Measurements Correlate With Eosinophilia and Dilation of Intercellular Spaces in Patients With Eosinophilic Esophagitis. Clin Gastroenterol Hepatol. 2015;13(7):1242–1248. e1. doi: 10.1016/j.cgh.2014.12.032. [DOI] [PubMed] [Google Scholar]
- 6.Mizushima N. Autophagy: process and function. Genes & development. 2007;21(22):2861–2873. doi: 10.1101/gad.1599207. [DOI] [PubMed] [Google Scholar]
- 7.Scherz-Shouval R, Shvets E, Fass E, et al. Reactive oxygen species are essential for autophagy and specifically regulate the activity of Atg4. The EMBO journal. 2007;26(7):1749–1760. doi: 10.1038/sj.emboj.7601623. [DOI] [PMC free article] [PubMed] [Google Scholar]
- 8.Komatsu M, Waguri S, Ueno T, et al. Impairment of starvation-induced and constitutive autophagy in Atg7-deficient mice. The Journal of cell biology. 2005;169(3):425–434. doi: 10.1083/jcb.200412022. [DOI] [PMC free article] [PubMed] [Google Scholar]
- 9.Diakopoulos KN, Lesina M, Wormann S, et al. Impaired autophagy induces chronic atrophic pancreatitis in mice via sex- and nutrition-dependent processes. Gastroenterology. 2015;148(3):626–638. e17. doi: 10.1053/j.gastro.2014.12.003. [DOI] [PubMed] [Google Scholar]
- 10.Adolph TE, Tomczak MF, Niederreiter L, et al. Paneth cells as a site of origin for intestinal inflammation. Nature. 2013;503(7475):272–276. doi: 10.1038/nature12599. [DOI] [PMC free article] [PubMed] [Google Scholar]
- 11.Cadwell K, Liu JY, Brown SL, et al. A key role for autophagy and the autophagy gene Atg16l1 in mouse and human intestinal Paneth cells. Nature. 2008;456(7219):259–263. doi: 10.1038/nature07416. [DOI] [PMC free article] [PubMed] [Google Scholar]
- 12.Liu B, Gulati AS, Cantillana V, et al. Irgm1-deficient mice exhibit Paneth cell abnormalities and increased susceptibility to acute intestinal inflammation. American journal of physiology Gastrointestinal and liver physiology. 2013;305(8):G573–G584. doi: 10.1152/ajpgi.00071.2013. [DOI] [PMC free article] [PubMed] [Google Scholar]
- 13.Choi AM, Ryter SW, Levine B. Autophagy in human health and disease. N Engl J Med. 2013;368(7):651–662. doi: 10.1056/NEJMra1205406. [DOI] [PubMed] [Google Scholar]
- 14.Clarke AJ, Ellinghaus U, Cortini A, et al. Autophagy is activated in systemic lupus erythematosus and required for plasmablast development. Ann Rheum Dis. 2015;74(5):912–920. doi: 10.1136/annrheumdis-2013-204343. [DOI] [PMC free article] [PubMed] [Google Scholar]
- 15.Ohashi S, Natsuizaka M, Yashiro-Ohtani Y, et al. NOTCH1 and NOTCH3 coordinate esophageal squamous differentiation through a CSL-dependent transcriptional network. Gastroenterology. 2010;139(6):2113–2123. doi: 10.1053/j.gastro.2010.08.040. [DOI] [PMC free article] [PubMed] [Google Scholar]
- 16.Kalabis J, Wong GS, Vega ME, et al. Isolation and characterization of mouse and human esophageal epithelial cells in 3D organotypic culture. Nat Protoc. 2012;7(2):235–246. doi: 10.1038/nprot.2011.437. [DOI] [PMC free article] [PubMed] [Google Scholar]
- 17.Harada H, Nakagawa H, Oyama K, et al. Telomerase induces immortalization of human esophageal keratinocytes without p16INK4a inactivation. Mol Cancer Res. 2003;1(10):729–738. [PubMed] [Google Scholar]
- 18.Muir AB, Lim DM, Benitez AJ, et al. Esophageal epithelial and mesenchymal cross-talk leads to features of epithelial to mesenchymal transition in vitro. Exp Cell Res. 2013;319(6):850–859. doi: 10.1016/j.yexcr.2012.12.002. [DOI] [PMC free article] [PubMed] [Google Scholar]
- 19.Kinugasa H, Whelan KA, Tanaka K, et al. Mitochondrial SOD2 regulates epithelial-mesenchymal transition and cell populations defined by differential CD44 expression. Oncogene. 2015 doi: 10.1038/onc.2014.449. [DOI] [PMC free article] [PubMed] [Google Scholar]
- 20.DeWard AD, Cramer J, Lagasse E. Cellular heterogeneity in the mouse esophagus implicates the presence of a nonquiescent epithelial stem cell population. Cell Rep. 2014;9(2):701–711. doi: 10.1016/j.celrep.2014.09.027. [DOI] [PMC free article] [PubMed] [Google Scholar]
- 21.Noti M, Wojno ED, Kim BS, et al. Thymic stromal lymphopoietin-elicited basophil responses promote eosinophilic esophagitis. Nat Med. 2013;19(8):1005–1013. doi: 10.1038/nm.3281. [DOI] [PMC free article] [PubMed] [Google Scholar]
- 22.Masterson JC, McNamee EN, Hosford L, et al. Local hypersensitivity reaction in transgenic mice with squamous epithelial IL-5 overexpression provides a novel model of eosinophilic oesophagitis. Gut. 2014;63(1):43–53. doi: 10.1136/gutjnl-2012-303631. [DOI] [PMC free article] [PubMed] [Google Scholar]
- 23.Jiang M, Ku WY, Zhou Z, et al. BMP-driven NRF2 activation in esophageal basal cell differentiation and eosinophilic esophagitis. J Clin Invest. 2015;125(4):1557–1568. doi: 10.1172/JCI78850. [DOI] [PMC free article] [PubMed] [Google Scholar]
- 24.Drake KR, Kang M, Kenworthy AK. Nucleocytoplasmic distribution and dynamics of the autophagosome marker EGFP-LC3. PLoS One. 2010;5(3):e9806. doi: 10.1371/journal.pone.0009806. [DOI] [PMC free article] [PubMed] [Google Scholar]
- 25.Huang R, Xu Y, Wan W, et al. Deacetylation of nuclear LC3 drives autophagy initiation under starvation. Mol Cell. 2015;57(3):456–466. doi: 10.1016/j.molcel.2014.12.013. [DOI] [PubMed] [Google Scholar]
- 26.Doupe DP, Alcolea MP, Roshan A, et al. A single progenitor population switches behavior to maintain and repair esophageal epithelium. Science. 2012;337(6098):1091–1093. doi: 10.1126/science.1218835. [DOI] [PMC free article] [PubMed] [Google Scholar]
- 27.Kalabis J, Oyama K, Okawa T, et al. A subpopulation of mouse esophageal basal cells has properties of stem cells with the capacity for self-renewal and lineage specification. J Clin Invest. 2008;118(12):3860–3869. doi: 10.1172/JCI35012. [DOI] [PMC free article] [PubMed] [Google Scholar]
- 28.Mortensen M, Soilleux EJ, Djordjevic G, et al. The autophagy protein Atg7 is essential for hematopoietic stem cell maintenance. J Exp Med. 2011;208(3):455–467. doi: 10.1084/jem.20101145. [DOI] [PMC free article] [PubMed] [Google Scholar]
- 29.Sherrill JD, Kc K, Wu D, et al. Desmoglein-1 regulates esophageal epithelial barrier function and immune responses in eosinophilic esophagitis. Mucosal Immunol. 2014;7(3):718–729. doi: 10.1038/mi.2013.90. [DOI] [PMC free article] [PubMed] [Google Scholar]
- 30.Howard TD, Koppelman GH, Xu J, et al. Gene-gene interaction in asthma: IL4RA and IL13 in a Dutch population with asthma. Am J Hum Genet. 2002;70(1):230–236. doi: 10.1086/338242. [DOI] [PMC free article] [PubMed] [Google Scholar]
- 31.Ohashi S, Natsuizaka M, Naganuma S, et al. A NOTCH3-mediated squamous cell differentiation program limits expansion of EMT-competent cells that express the ZEB transcription factors. Cancer Res. 2011;71(21):6836–6847. doi: 10.1158/0008-5472.CAN-11-0846. [DOI] [PMC free article] [PubMed] [Google Scholar]
- 32.Harris J, De Haro SA, Master SS, et al. T helper 2 cytokines inhibit autophagic control of intracellular Mycobacterium tuberculosis. Immunity. 2007;27(3):505–517. doi: 10.1016/j.immuni.2007.07.022. [DOI] [PubMed] [Google Scholar]
- 33.Petiot A, Ogier-Denis E, Blommaart EF, et al. Distinct classes of phosphatidylinositol 3'-kinases are involved in signaling pathways that control macroautophagy in HT-29 cells. J Biol Chem. 2000;275(2):992–998. doi: 10.1074/jbc.275.2.992. [DOI] [PubMed] [Google Scholar]
- 34.Dickinson JD, Alevy Y, Malvin NP, et al. IL13 activates autophagy to regulate secretion in airway epithelial cells. Autophagy. 2015:0. doi: 10.1080/15548627.2015.1056967. [DOI] [PMC free article] [PubMed] [Google Scholar]
- 35.Blanchard C, Stucke EM, Burwinkel K, et al. Coordinate interaction between IL-13 and epithelial differentiation cluster genes in eosinophilic esophagitis. J Immunol. 2010;184(7):4033–4041. doi: 10.4049/jimmunol.0903069. [DOI] [PMC free article] [PubMed] [Google Scholar]
- 36.Cheng E, Zhang X, Huo X, et al. Omeprazole blocks eotaxin-3 expression by oesophageal squamous cells from patients with eosinophilic oesophagitis and GORD. Gut. 2013;62(6):824–832. doi: 10.1136/gutjnl-2012-302250. [DOI] [PMC free article] [PubMed] [Google Scholar]
- 37.Moqbel R, Lacy P. Molecular mechanisms in eosinophil activation. Chem Immunol. 2000;78:189–198. doi: 10.1159/000058806. [DOI] [PubMed] [Google Scholar]
- 38.Kinugasa H, Whelan KA, Tanaka K, et al. Mitochondrial SOD2 regulates epithelial-mesenchymal transition and cell populations defined by differential CD44 expression. Oncogene. 2015;34(41):5229–5239. doi: 10.1038/onc.2014.449. [DOI] [PMC free article] [PubMed] [Google Scholar]
- 39.Muir AB, Dods K, Noah Y, et al. Esophageal epithelial cells acquire functional characteristics of activated myofibroblasts after undergoing an epithelial to mesenchymal transition. Exp Cell Res. 2015;330(1):102–110. doi: 10.1016/j.yexcr.2014.08.026. [DOI] [PMC free article] [PubMed] [Google Scholar]
- 40.Kagalwalla AF, Akhtar N, Woodruff SA, et al. Eosinophilic esophagitis: epithelial mesenchymal transition contributes to esophageal remodeling and reverses with treatment. J Allergy Clin Immunol. 2012;129(5):1387–1396. e7. doi: 10.1016/j.jaci.2012.03.005. [DOI] [PMC free article] [PubMed] [Google Scholar]
- 41.Souza RF, Huo X, Mittal V, et al. Gastroesophageal reflux might cause esophagitis through a cytokine-mediated mechanism rather than caustic acid injury. Gastroenterology. 2009;137(5):1776–1784. doi: 10.1053/j.gastro.2009.07.055. [DOI] [PubMed] [Google Scholar]
- 42.Kong J, Whelan KA, Laczko D, et al. Autophagy levels are elevated in barrett's esophagus and promote cell survival from acid and oxidative stress. Mol Carcinog. 2015 doi: 10.1002/mc.22406. [DOI] [PMC free article] [PubMed] [Google Scholar]
- 43.Roesly HB, Khan MR, Chen HD, et al. The decreased expression of Beclin-1 correlates with progression to esophageal adenocarcinoma: the role of deoxycholic acid. American journal of physiology Gastrointestinal and liver physiology. 2012;302(8):G864–G872. doi: 10.1152/ajpgi.00340.2011. [DOI] [PMC free article] [PubMed] [Google Scholar]
- 44.Cuervo AM. Autophagy and aging: keeping that old broom working. Trends in genetics : TIG. 2008;24(12):604–612. doi: 10.1016/j.tig.2008.10.002. [DOI] [PMC free article] [PubMed] [Google Scholar]
- 45.Schoepfer AM, Safroneeva E, Bussmann C, et al. Delay in diagnosis of eosinophilic esophagitis increases risk for stricture formation in a time-dependent manner. Gastroenterology. 2013;145(6):1230–1236. e1–e2. doi: 10.1053/j.gastro.2013.08.015. [DOI] [PubMed] [Google Scholar]
- 46.Yang J, Wheeler SE, Velikoff M, et al. Activated alveolar epithelial cells initiate fibrosis through secretion of mesenchymal proteins. Am J Pathol. 2013;183(5):1559–1570. doi: 10.1016/j.ajpath.2013.07.016. [DOI] [PMC free article] [PubMed] [Google Scholar]
- 47.Yamaki K, Yoshino S. Preventive and therapeutic effects of rapamycin, a mammalian target of rapamycin inhibitor, on food allergy in mice. Allergy. 2012;67(10):1259–1270. doi: 10.1111/all.12000. [DOI] [PubMed] [Google Scholar]
Associated Data
This section collects any data citations, data availability statements, or supplementary materials included in this article.


