

Abstract
The androgen receptor (AR) is a therapeutic target for the treatment of prostate cancer. Androgen receptor reactivation during the androgen-independent stage of prostate cancer is mediated by numerous mechanisms including expression of AR mutants and splice variants that become non-responsive to conventional anti-androgenic agents. Resveratrol and its natural analogs exhibit varying degrees of anti-androgenic effects on tumor growth suppression in prostate cancer. However, the structural basis for the observed differential activity remains unknown. Here, anti-androgenic activities of resveratrol and its natural analogs, namely, pterostilbene, piceatannol and trimethoxy-resveratrol were studied in LNCaP cells expressing T877A mutant AR and atomistic simulations were employed to establish the structure activity relationship. Interestingly, essential hydrogen bonding contacts and the binding energies of resveratrol analogs with AR ligand binding domain (LBD), emerge as key differentiating factors for varying anti-androgenic action. Among all the analogs, pterostilbene exhibited strongest anti-androgenic activity and its binding energy and hydrogen bonding interactions pattern closely resembled pure anti-androgen, flutamide. Principal component analysis of our simulation studies revealed that androgenic compounds bind more strongly to AR LBD compared to anti-androgenic compounds and provide conformational stabilization of the receptor in essential subspace. The present study provides critical insight into the structure-activity relationship of the anti-androgenic action of resveratrol analogs, which can be translated further to design novel highly potent anti-androgenic stilbenes.
Keywords: Resveratrol; Pterostilbene, Natural analogs; Androgen receptor; Anti-androgenic activity; Molecular Dynamics simulation; Binding free energy; Conformational dynamics
Introduction
The androgen receptor (AR) belongs to the steroid nuclear receptor superfamily of transcription factors, which upon binding with its natural ligand, androgen, translocates into the nucleus, dimerizes and binds to the DNA leading to the activation of its target genes1, 2. Structurally, AR consists of the N-terminal domain (NTD) that is involved in the transcriptional activation, the DNA-binding domain (DBD), the hinge region that contains the nuclear localization signal (NLS) and the ligand-binding domain (LBD) at the C-terminal that is involved in androgen binding and dimerization3-5.
AR and its associated signaling play an essential role in the development and progression of prostate cancer. AR continues to be expressed and active in metastatic prostate cancer, for which androgen deprivation therapy (ADT) is the best treatment option available. However, patients undergoing ADT after a significant clinical response regularly relapse with more aggressive form of prostate cancer known as castrate-resistant/hormone-refractory/androgen-independent prostate cancer, where AR exhibits its activity by utilizing alternative signaling pathways6-9. AR reactivation during the androgen-independent stage of prostate cancer is mediated by numerous mechanisms that include amplification and overexpression of the AR gene, expression of AR mutants and splice variants, all of which confer ligand promiscuity and/or androgen-independent activity leading to cancer cell proliferation and survival 10, 11. Due to the inability of the available anti-androgens to target canonical and alternative signaling by AR, which leads to advanced metastatic disease, the pursuit for a novel and potent AR antagonist is very important.
Plant-derived dietary polyphenols are an attractive candidate for prevention and treatment of prostate cancer. Resveratrol (RES) (trans-3,5,4′-trihydroxystilbene) is a polyphenol and stilbene phytoalexin that is synthesized by a wide variety of plants in response to infection and environmental stress 12 and is commonly found in grapes and red wine. Resveratrol has various health benefit effects such as cardiovascular, neuroprotective, anti-inflammatory, anti-oxidant, and anti-cancer 13-16. In recent years natural analogs of RES have attracted increasing attention and a number of studies have suggested that modifications to the chemical structure, such as methoxylation or hydroxylation could enhance its bioactivity 17-20. Natural analogs of RES such as pterostilbene (PTER) (trans-3,5-dimethoxy-4′-hydroxystilbene), and trimethoxy-resveratrol (3M-RES) (trans-3,5,4′-trimethoxystilbene) are commonly found in blueberries, grapes and Pterobolium hexapatallum (common name Indian Redwing), respectively 21, 22. Piceatannol (PIC) (trans-3,4,3′,5′-tetrahydroxystilbene), on the other hand, contains one extra hydroxyl group compared to RES and is commonly found in grapes and red wine 23. Chemical structures of RES and its natural analogs, considered in this study, are shown in Fig. 1.
Fig. 1.
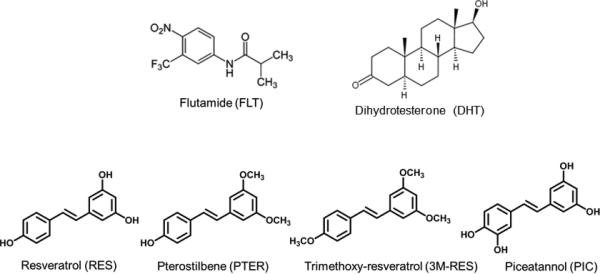
Chemical structures of compounds used in this study. Dihydrotestosterone (DHT), AR agonist; Flutamide (FLT), AR antagonist; Resveratrol (RES), trans-3,4,5’-trihydroxystilbene; Pterostilbene (PTER), trans-3,5-dimethoxystilbene; Piceatannol (PIC), trans-3,5,3’4’-tetrahydroxystilbene; Trimethoxy-Resveratrol (3M-RES), trans-3,5,4”-trimethoxystilbene.
Resveratrol, apart from the many other mechanisms responsible for its anti-cancer activity, inhibits AR signaling. Treatment of LNCaP cells, which express the T877A mutant AR, with RES, downregulates the expression of AR and its target genes 24. Down-regulation of AR by RES is partly attributable to a reduction in post-translational AR levels 25. Resveratrol also decreases the acetylation of AR and thereby prevents its accumulation in the nucleus and inhibits its DNA binding ability 26. Moreover, regulation of AR target genes by RES involves, at least in part, repression of the AR transcriptional activity 27. We too reported a reduction of AR levels, transcriptional activity and androgen-promoted growth in LNCaP cells upon treatment with RES 28. Anti-androgenic activity of the synthetic and natural analogs of RES is also reported and thought to be influenced by the hydroxyl groups in their structure 29. In addition, modulation of AR dimerization by stilbenes is also reported 30. Only recently, we showed that treatment of 22Rv1 prostate cancer cells, which express a full-length as well as a truncated form of AR, with RES and its analogs exhibited a significant decrease in AR levels with the reduction in truncated AR levels being more noticeable than the reduction in full-length AR levels 31. However, RES or its analogs bound AR structure has not yet been experimentally determined and also the dynamics of AR in complex with either RES or its analogs is not reported yet.
In the present study, we have investigated the structure-activity relationship between RES and analogs and their anti-androgenic activity using a combination of experimental and theoretical approaches. Conformational dynamics of the AR bound to RES, PTER, PIC, and 3M-RES has been correlated with the experimentally observed differential down-regulation of T877A mutant AR levels in LNCaP prostate cancer cells. Our results, for the first time, provide structural rationale for the differential anti-androgenic activity of RES and its analogs against T877A mutant AR.
Materials and methods
Reagents
Dihydrotestosterone, FLT, and RES were purchased from Sigma-Aldrich (St. Louis, MO, USA). Piceatannol was purchased from Calbiochem-Novabiochem (San Diego, CA, USA). Pterostilbene and 3M-RES were synthesized at the USDA, National Products Utilization Research Unit in Oxford, MS, USA as previously described 32, 33. Structures of the synthesized compounds were confirmed by nuclear magnetic resonance spectroscopy and mass spectroscopy. The purity of PTER and 3M-RES was determined to be > 99%. All compounds were dissolved in high purity DMSO (MP Biomedicals, Solon, OH, USA) and stored in the dark at 4°C.
Cell Culture
The LNCaP prostate cancer cells were grown in RPMI 1640 media (GIBCO, Grand island, NY, USA) containing 10% Fetal Bovine Serum and 1% antibiotic-antimycotic at 37°C and 5% CO2 as previously described 34. For experiments involving treatment with RES and analogs, media was replaced with phenol-red free RPMI 1640 containing 5% charcoal-stripped serum at least for 6-10 h prior to treatment to eliminate hormonal background.
Western blot analysis
Western blot analysis was performed as described previously 31, 34, 35. Briefly, LNCaP cells in phenol red-free media/ charcoal-stripped serum at 60-70% confluency were treated with compounds for 24 h, after which cell lysates were obtained using RIPA buffer (ThermoFisher Scientific, Waltham, MA, USA). Equal amounts of protein were resolved in 10% SDS-PAGE gel and transferred to a PVDF membrane. The membranes were probed with AR antibody (1:500) (Santa Cruz Biotechnology, Dallas, TX, USA). β-actin was used as a loading control. Signals were visualized using the SuperSignal West Dura chemiluminescence kit (ThermoFisher Scientific, Waltham, MA, USA) and imaged on a Chemidoc gel imager (Bio-Rad, Hercules, CA, USA). Images were quantified using the Image J software (NIH, Bethesda, MD, USA). Effective dose (ED50) values were calculated using the linear interpolation method in MS Excel software.
Modeling of the AR-ligand complexes
The 3-D co-ordinates of AR LBD was obtained from protein data bank (PDB ID: 1E3G) comprising of residues 669-918. To complement experimental data, modeling studies were carried out on T877A AR. Therefore, in the AR LBD structure THR at 877 was mutated to ALA. Molecular docking using AutoDock 4 36 was used initially to dock all the ligands within AR LBD to form the initial AR-ligand complexes. For AR LBD, all the hetero atoms were deleted. Kollman united-atom charge model was applied to the protein and non-polar hydrogens were merged. Atomic solvation parameters and fragmental volumes were added to the protein. All the ligand structures were built using HYPERCHEM 8.0 37 molecular builder module and optimized using AM1 semi-empirical method to a rms convergence of 0.001 kcal/ mol with Polak-Ribiere conjugate gradient algorithm implemented in the HYPERCHEM 8.0 37. Rotatable bonds were assigned and non-polar hydrogens were merged for the ligand after assigning partial atomic charges to each atom of the ligand using the Gasteiger-Marsili method. Grid maps were then generated by using the empirical free-energy scoring functions using a grid box dimension of 120 × 120 × 120 with a grid-point spacing of 0.375 Å. The box was centered such that it covered the entire LBD. 250 docking runs were performed and for each run, a maximum of 2,500,000 GA operations were carried out on a single population of 150 individuals. The default parameters of 0.8, 0.02 and 1 were used for crossover, mutation, and elitism weights, respectively. The lowest energy docked solution was considered as possible AR-ligand complex structure.
Molecular dynamics simulation
Each AR-ligand complex obtained from molecular docking was further subjected to molecular dynamics simulation using GROMACS 38, 39 molecular dynamics with the OPLS 40 force field. Parameters for the molecular dynamics simulation of all the ligands were developed according to the OPLS force-field. Each atom was assigned the proper atom type definition as per the OPLS-AA parameter set. The van der Waals and torsional parameters and the atomic partial charges for the ligand were obtained by group analogy in the OPLS-AA set. The atomic partial charges are readjusted to maintain the charge neutrality of the whole molecule. The parameters are tested by comparing the GROMACS 38, 39 energy minimized structures with the energy minimized structures obtained from plane wave based DFT calculations using CPMD 41.
Each AR-ligand complex was subjected to a preliminary short energy minimization in vacuo using the steepest descent algorithm. Then, the system was solvated with SPC explicit water model in a cubic box with periodic boundary condition. The box dimension was chosen such that all the protein atoms were at a distance equal to or greater than 1 nm from the box edges. The ionization states of the residues were set to be consistent with neutral pH and Cl− ions were added to make the system charge-neutral. The solvated system was then subjected to a second energy minimization with 500 steps of steepest descent algorithm to eliminate any bad contacts with water. After that, a 100 ps position restrained dynamics was carried out where the complex was restrained by restraining forces while the water molecules were allowed to move freely. It was then followed by 20 ps of NVT simulation at 300 K and 20 ps of NPT simulation to achieve proper equilibration of the system to be simulated. Final production simulations were performed in the isothermal-isobaric (NPT) ensemble at 300 K, using an external bath with a coupling constant of 0.1 ps. The pressure was kept constant (1 bar) by using pressure coupling with the time-constant set to 1 ps. The LINCS 42 algorithm was used to constrain the bond lengths involving hydrogen atoms, allowing the use of 2.0 fs time step. The van der Waals and coulomb interactions were truncated at 1.4 nm and the SHIFT algorithm as implemented in GROMACS was used to minimize the error from truncation. The trajectories were stored at every 5 ps.
Structural analysis was carried out by using the in-built tools of GROMACS and the secondary structure assignments were carried out with DSSP 43 module integrated with GROMACS.
Results and Discussion
Resveratrol and analogs inhibit AR protein levels in LNCaP cells
The AR in LNCaP prostate cancer cells harbors the T877A mutation, which falls in the LBD and lends promiscuous ligand binding property to it. We validated our earlier observations of AR antagonist activity by RES 28 and examined the effects of analogs on AR expression in LNCaP cells (Fig. 2A and B). To investigate the dose-dependent effect of RES and analogs on AR expression at protein level, we treated cells with different doses (5-100 μM) of RES, PTER, PIC and 3M-RES for 24 h and isolated protein for western blot. As shown in Fig. 2C there was a dose-dependent down-regulation of AR protein levels in cells treated with RES or its analogs. Densitometric analysis performed to calculate the ED50 for each compound revealed the lowest ED50 value for PTER (Fig. 2D), indicating that PTER could be the most potent AR antagonist among RES and its analogs (Fig. 2C and D).
Fig. 2.

Resveratrol and analogs inhibit T877A mutant AR protein expression in LNCaP prostate cancer cells. (A) Western blot analysis showing the AR antagonist property of RES, PTER, PIC and 3M-RES. (B) Densitometric analysis demonstrating normalized AR levels. (C) Western blot analysis showing the effect of various concentrations of RES, PTER, PIC and 3M-RES on AR protein levels. β-actin was a loading control. (D) Densitometric analysis demonstrating normalized AR levels. Control vehicle-treated cells (Ctrl) was set as 1 and AR levels are expressed relative to Ctrl. Data represent the mean ± SEM of three independent treatments. The ED50 was calculated using the linear interpolation method in MS Excel software.
Resveratrol and analogs bind to mutated AR in LNCaP cells
Molecular modeling studies were carried out to provide molecular insight into the observed anti-androgenic activity of RES and its analogs. To infer structural stability of AR LBD bound to DHT, FLT, RES, 3M-RES, PTER and PIC during molecular dynamics (MD) simulation, we have analyzed two global structural parameters, RMSD (root mean square deviation) and Rg (radius of gyration). RMSD profile of the protein over the simulation time has been used to analyze the stability of the simulated system. Fig. S1A shows that all the ligands irrespective of their activity, i.e., either agonist or antagonist, form stable complex with AR LBD. All the complexes undergo structural readjustment according to its environment and bound ligand within first nano-second (ns) of the simulation and thereafter reach the equilibration state as evident from a stable RMSD profile. On the other hand, Rg is the mass-weighted root mean square distance of a collection of atoms from their common center of mass. The parameter defines the overall shape and dimensions of the AR-ligand complexes. Supported by the RMSD profile, Rg profiles of all the AR-ligand complexes are also highly stable all throughout the simulation. Stable Rg profile of each AR-ligand complex indicates that binding of each ligand to AR LBD does not induce any structural perturbation/unfolding of the protein (Fig. S1B).
Pterostilbene and piceatannol exhibit mutated AR protein dynamics similar to flutamide
Although, RMSD and Rg provide global structural perspective of the simulation, critical analysis is needed to provide insight into the ligand specific response on AR dynamics. MD simulation visits numerous conformations during the simulation timescale. To identify ligand induced functional motion, we have performed principal component analysis (PCA) on MD trajectories. PCA is an efficient data reduction technique where the dimensionality of the essential subspace of the protein is defined by the reduced subspace represented by eigenvectors or principal components (PCs). Generally, first few components are more informative while the latter components carry very little information about the protein dynamics. Projection of first two PCs on the respective trajectory generates a bi-dimensional representation of the protein dynamics when a particular ligand is bound to AR LBD. Here, each point in the essential sub-space defines a unique conformation of the simulated system such that structurally similar conformations overlap in the essential sub-space. Interestingly, when androgenic DHT is bound to AR LBD, conformations are projected within a confined 2-D space signifying high stability of the complex. When anti-androgenic FLT is bound to AR LBD, the complex exhibits widespread projection in 2-D plot (Fig. 3A). Interestingly, among RES and its analogs, PIC and PTER exhibit similar widespread distribution as observed in case of FLT in essential sub-space defined by PC1 and PC2. Thus, in essential sub-space, behavior of AR LBD in presence of bound PIC and PTER is very similar with the dynamics of the protein in presence of anti-androgenic FLT, which induces more flexibility of the protein, compared to androgenic DHT.
Fig. 3.
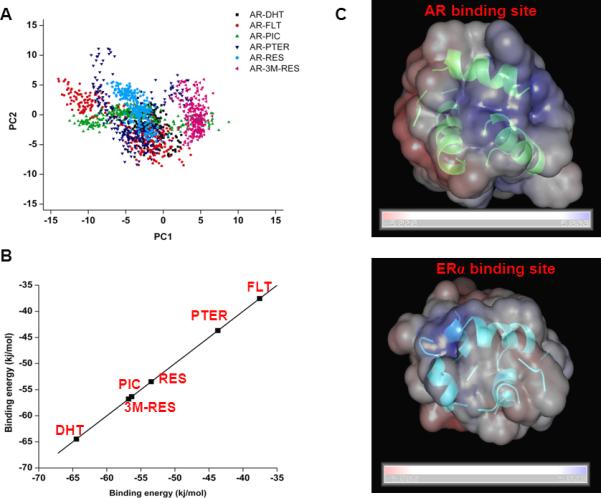
Conformational flexibility and binding energy analysis of AR-ligand complexes obtained from MD simulation. (A) Two-dimensional (2D) projection of first two principal components (PC1 & PC2) on the simulation trajectories of AR-ligand complexes. Different AR-ligand complex simulations are colored differently. (B) Estimation of binding free energy of DHT, FLT, RES, PIC, PTER, 3M-RES with AR LBD using linear interaction energy method and shown in scattered representation. (C) Electrostatic surface potential of AR and ERα active site. Blue and red colors are used to indicate the most positive and negative electrostatic potentials, respectively.
Free energy of binding of PTER to mutated AR is similar to flutamide
In addition to conformational flexibility, we have also assessed the binding affinity of all the ligands with AR LBD. Using the Linear interaction energy (LIE) method we have calculated the binding free energies of DHT, FLT, RES, PTER, PIC and 3M-RES with AR from the MD simulation (Fig. 3B). LIE calculates the free energy of binding of a ligand with its receptor by subtracting Lennard–Jones (LJ) and coulomb interaction energies with solvent molecules from the respective energy component of the ligand in its receptor bound state and averaged over the last 5 ns of the simulation. Subsequently, binding free energies (ΔG) were calculated by:
where, ELJ and ECoul denotes the LJ interaction energy and the coulomb interaction energy of the ligand when it is bound to the receptor (BOUND) and when it is free in solution (FREE), respectively. The parameters, α and β, used in this study were developed initially for ERα-ligand systems and used frequently to calculate the binding free energy of different ligands to estrogen receptor alpha (ERα). It is to be noted that both ERα and AR belong to the same steroid nuclear receptor superfamily of transcription factors and show very similar structural organization of the active site. Sequence similarity reveals that the LBD of both the protein share 61% sequence identity. Therefore, both α and β are transferable to AR-ligand systems. The LJ co-efficient, α, is highly dependent on the local hydrophobicity of the active site and varies from 0.1 to 0.9. For predominantly hydrophilic binding site, α value assumes to be 0.1 while 0.9 has been used for systems with highly hydrophobic binding site. LIE model developed for ERα-ligand systems, best fitting of experimental and computed binding energy leads to the value of 0.82 for α. We have calculated the electrostatic surface potential of the active site for both AR and ERα LBD and results are shown in Fig. 3C. Evident from the figure, active site for both the protein shows highly similar charge distribution, even the solvation free energy of both the protein's active site are highly similar. The calculated solvation free energies of the active site of AR and ERα are −1776 and −1808 kcal/mol, respectively. This similar nature of the binding site further supports the usage of α=0.82 for AR-ligand systems also. On the other hand, columbic energy co-efficient, β, is dependent on the number of OH group, i.e., hydrogen bonding groups. βOH=0 =0.5, βOH=1 =0.43 and βOH≥2 =0.2 were used to compute binding free energies, as originally derived by Lipzig et al. 44. It is to be noted that the carbonyl group can also participate in hydrogen bonding like OH group; therefore their number is also accounted for when considering the β values. Distribution of ligands according to their binding free energy reveals an interesting pattern (Fig. 3B), androgenic DHT shows highest binding affinity with AR-LBD while anti-androgenic FLT has the least binding free energy. Wang et al. recently showed that the endogenous hormones DHT and 17β-estradiol showed the strongest binding affinity while phytoestrogens and xeno-estrogens showed comparatively weak binding affinity to AR using molecular docking 45. We propose binding energy as a discriminatory criterion of androgenic/anti-androgenic activity. Interestingly, RES and all its analogs fall within the binding energy limit framed by DHT and FLT. Importantly, PTER again shows the lowest binding energy with AR among RES analogs, which is comparable to FLT. The other analogs, PIC and 3M-RES clubbed together with RES within the moderate binding energy region. Remarkably, this order in the binding energy pattern corresponds well with the experimentally derived ED50 value against T877A mutant AR expressed in LNCaP cells (Fig. 2).
Pterostilbene forms more stable hydrogen bonds than flutamide with AR LBD
We then assessed the specific interactions involved in AR-ligand complexes to gain further insight into the observed biological activity on AR. Hydrogen bonding pattern comes out to be another discriminating factor on the observed bioactivity of AR ligands, summarized in Fig. 4 and Table 1.
Fig. 4.
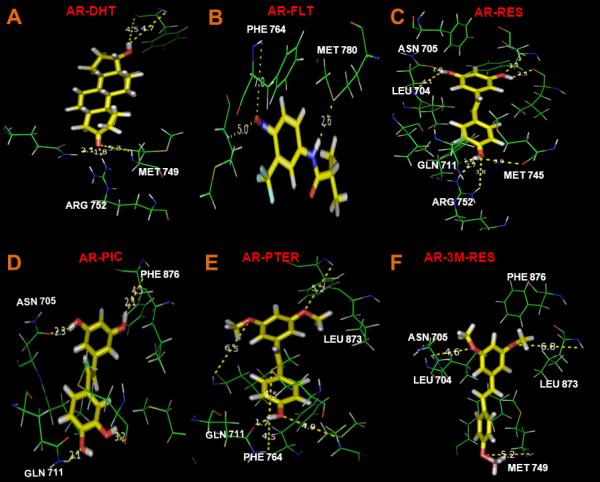
Details of the hydrogen bonding interactions observed in different AR-ligand complexes as is evident from MD simulation. Stick representations of important hydrogen bonding interactions observed in each AR-ligand complex. (A) AR-DHT complex; (B) AR-FLT; (C) AR-RES; (D) AR-PIC; (E) AR-PTER; (F) AR-3M-RES. Bound ligands are shown in yellow stick while hydrogen bonding interacting residues of AR is shown in green line representation.
Table 1.
Hydrogen bonding interactions and its stability during MD simulation.
| Residue ID | Residue | Hydrogen bonding stability (% of total simulation time)* | |||||
|---|---|---|---|---|---|---|---|
| DHT | FLT | PIC | PTER | RES | 3M-RES | ||
| 701 | LEU | 1.0 | 7.5 | 0.5 | |||
| 704 | LEU | 1.0 | 4.0 | 38.3 | 21.0 | 28.4 | 24.9 |
| 705 | ASN | 3.0 | 72.6 | 72.0 | 9.0 | ||
| 707 | LEU | 1.0 | 4.0 | 7.0 | 1.5 | ||
| 708 | GLY | 2.5 | |||||
| 711 | GLN | 2.5 | 4.0 | 80.5 | 32.0 | 37.8 | |
| 741 | TRP | 1.0 | |||||
| 742 | MET | 0.5 | 0.5 | 1.0 | |||
| 745 | MET | 0.5 | 5.0 | 30.4 | 18.4 | 14.5 | 0.5 |
| 746 | VAL | 4.5 | 0.5 | ||||
| 749 | MET | 11.0 | 4.5 | 3.5 | 11.0 | 1.0 | 3.0 |
| 752 | ARG | 71.6 | 0.5 | 46.3 | 6.0 | ||
| 764 | PHE | 4.0 | 13.0 | 3.0 | 28.0 | 4.5 | 7.0 |
| 780 | MET | 44.3 | 2.0 | ||||
| 787 | MET | 8.5 | |||||
| 873 | LEU | 0.5 | 26.4 | 23.9 | 7.0 | 8.0 | |
| 876 | PHE | 2.0 | 0.5 | 38.3 | 8.0 | 20.4 | 12.9 |
| 877 | ALA | 1.0 | 3.5 | 1.5 | 6.0 | ||
| 880 | LEU | 1.0 | 2.5 | ||||
| 891 | PHE | 2.5 | 2.0 | 4.5 | 4.5 | ||
| 895 | MET | 1.0 | 1.5 | 1.5 | |||
| Ligand Binding Free Energy (kj/mol) | −64.46 | −37.55 | −56.34 | −43.68 | −53.48 | −56.79 | |
Stability of the hydrogen bonding interactions observed in the simulations timescale for all the six ligands (DHT, FLT, RES, PIC, PTER, 3M-RES) are tabulated. Hydrogen bonding stability was considered as the percentage of conformation of the complex obtained from MD simulation where a particular hydrogen bonding interaction is evident between AR and each ligand.
Graphical representations of important hydrogen bonding interactions observed in each AR-ligand complex as evident from MD simulation are shown (Fig. 4A-F). All the hydrogen bonding interactions observed in 10 ns simulations timescale for all the six ligands (DHT, FLT, RES, PIC, PTER, 3M-RES) are tabulated in Table 1. Here hydrogen bonding stability was considered as percentage of conformation of the complex obtained from MD simulation, where a particular hydrogen bonding interaction is evident between AR and a ligand. Hydrogen bonding analysis revealed some interesting features. In general, RES and PIC form more number of hydrogen bonds compared to other two analogs, 3M-RES and PTER, which can be attributed to the presence of more OH groups. For androgenic DHT, most frequently observed interaction was observed with ARG 752 (71.6 % population) of AR LBD. Interestingly, this interaction was absent in case of anti-androgenic FLT. In case of RES, number of conformations where that particular hydrogen bonding interaction is observed, reduces significantly. Among RES analogs, this interaction was absent for most of the simulation time scale for PIC and 3M-RES but was completely absent during the simulation for PTER, one more time signifying its superior potency as an AR antagonist. Thus, this particular hydrogen bonding interaction with ARG 752 may be a signature of androgenic activity and is destabilized significantly by anti-androgenic ligands. Another interesting observation was the hydrogen bonding interaction with PHE 764. In case of DHT, this interaction was almost absent but for FLT, the population of conformations where the interaction was present increased to 13%. Moreover, only for PTER but not RES, PIC or 3M-RES, it further increased to 28%, thereby strengthening PTER's candidacy as the most potent AR antagonist among RES and its analogs. Thus, this interaction may play a dominant role in the anti-androgenic activity of ligands.
Conclusions
AR is a key molecular player in the development and progression of prostate cancer. AR is highly expressed and activated in metastatic prostate cancer utilizing alternative signaling pathways by numerous mechanisms leading to cancer cell proliferation and survival6-11. Therefore, there is an urgent need to identify novel potent anti-androgens. Phytochemicals are of particularly interest due to natural availability and wide range of functional diversity. Among them stilbenes are shown to be highly effective in the inhibition of prostate cancer cells in vitro 28, 46 and treatment of prostate cancer and spontaneous metastasis in xenografts 35, 47. Moreover, we recently demonstrated that pterostilbene treatment of prostate-specific Pten-loss mice had inhibitory effects on AR levels in both prostate luminal cells and reactive stroma 48. However, whether and how resveratrol or its natural analogs bind to AR is unclear. Here, we explored the structure-activity relationship between resveratrol/analogs and their anti-androgenic activity. We found that pterostilbene exhibits strongest anti-androgenic activity among RES analogs and its binding energy and hydrogen bonding interaction pattern closely resemble pure anti-androgen, flutamide. Moreover, principal component analysis of the simulation trajectories reveals pterostilbene induced functional dynamics of AR LBD to be similar to anti-androgenic flutamide induced dynamics. In summary, using an integrated experimental and in silico approach, the present study provides crucial insight into the structure-activity relationship of resveratrol analogs on the anti-androgenic activity, which paves the way to design more potent anti-androgenic compounds based on stilbene scaffold.
Supplementary Material
Acknowledgements
Authors gratefully acknowledge Dr. Soumalee Basu, Department of Microbiology, University of Calcutta, India for allowing the use of HYPERCHEM 8.0. The authors SC and PKB acknowledge financial support from MS-INBRE (USM-GR04015-05-9; NIH/NCRR P20RR016476) and EPSCoR (EPS-0903787; Sub-contract: 190200-362492-10); ASL acknowledges support from Office of Research, Vice Chancellor's Funds of UMMC.
Abbreviations
- RES
resveratrol
- PTER
pterostilbene
- 3M-RES
trimethoxy-resveratrol
- PIC
piceatannol
- DHT
dihydrotestosterone
- FLT
flutamide
- AR
androgen receptor
- ERα
estrogen receptor alpha
- LBD
ligand binding domain
- MD
molecular dynamics
- RMSD
root means square deviations
- RMSF
root mean square fluctuations
- LJ
Lennard-Jones
- CPMD
Car-Parrinello Molecular Dynamics
- DFT
Density Functional Theory
References
- 1.Tan MH, Li J, Xu HE, Melcher K, Yong EL. Acta Pharmacol Sin. 2015;36:3–23. doi: 10.1038/aps.2014.18. [DOI] [PMC free article] [PubMed] [Google Scholar]
- 2.Brinkmann AO. In: Endotext. De Groot LJ, Beck-Peccoz P, Chrousos G, Dungan K, Grossman A, Hershman JM, Koch C, McLachlan R, New M, Rebar R, Singer F, Vinik A, Weickert MO, editors. South Dartmouth (MA): 2000. [Google Scholar]
- 3.Claessens F, Denayer S, Van Tilborgh N, Kerkhofs S, Helsen C, Haelens A. Nucl Recept Signal. 2008;6:e008. doi: 10.1621/nrs.06008. [DOI] [PMC free article] [PubMed] [Google Scholar]
- 4.Lallous N, Dalal K, Cherkasov A, Rennie PS. Int J Mol Sci. 2013;14:12496–12519. doi: 10.3390/ijms140612496. [DOI] [PMC free article] [PubMed] [Google Scholar]
- 5.Aagaard MM, Siersbaek R, Mandrup S. Biochim Biophys Acta. 2011;1812:824–835. doi: 10.1016/j.bbadis.2010.12.018. [DOI] [PubMed] [Google Scholar]
- 6.Fletterick RJ. BJU Int. 2005;96(Suppl 2):2–9. doi: 10.1111/j.1464-410X.2005.05940.x. [DOI] [PubMed] [Google Scholar]
- 7.Agoulnik IU, Weigel NL. J Cell Biochem. 2006;99:362–372. doi: 10.1002/jcb.20811. [DOI] [PubMed] [Google Scholar]
- 8.Kageyama Y, Hyochi N, Kihara K, Sugiyama H. Recent Pat Anticancer Drug Discov. 2007;2:203–211. doi: 10.2174/157489207782497172. [DOI] [PubMed] [Google Scholar]
- 9.Chen S, Gao J, Halicka HD, Traganos F, Darzynkiewicz Z. Int J Oncol. 2008;32:405–411. [PMC free article] [PubMed] [Google Scholar]
- 10.Pienta KJ, Bradley D. Clin Cancer Res. 2006;12:1665–1671. doi: 10.1158/1078-0432.CCR-06-0067. [DOI] [PubMed] [Google Scholar]
- 11.Lonergan PE, Tindall DJ. J Carcinog. 2011;10:20. doi: 10.4103/1477-3163.83937. [DOI] [PMC free article] [PubMed] [Google Scholar]
- 12.Bhat KP, Pezzuto JM. Ann N Y Acad Sci. 2002;957:210–229. doi: 10.1111/j.1749-6632.2002.tb02918.x. [DOI] [PubMed] [Google Scholar]
- 13.Athar M, Back JH, Tang X, Kim KH, Kopelovich L, Bickers DR, Kim AL. Toxicol Appl Pharmacol. 2007;224:274–283. doi: 10.1016/j.taap.2006.12.025. [DOI] [PMC free article] [PubMed] [Google Scholar]
- 14.Harikumar KB, Aggarwal BB. Cell Cycle. 2008;7:1020–1035. doi: 10.4161/cc.7.8.5740. [DOI] [PubMed] [Google Scholar]
- 15.Markus MA, Morris BJ. Clin Interv Aging. 2008;3:331–339. [PMC free article] [PubMed] [Google Scholar]
- 16.Pirola L, Frojdo S. IUBMB Life. 2008;60:323–332. doi: 10.1002/iub.47. [DOI] [PubMed] [Google Scholar]
- 17.Kueck A, Opipari AW, Jr., Griffith KA, Tan L, Choi M, Huang J, Wahl H, Liu JR. Gynecol Oncol. 2007;107:450–457. doi: 10.1016/j.ygyno.2007.07.065. [DOI] [PubMed] [Google Scholar]
- 18.Kondratyuk TP, Park EJ, Marler LE, Ahn S, Yuan Y, Choi Y, Yu R, van Breemen RB, Sun B, Hoshino J, Cushman M, Jermihov KC, Mesecar AD, Grubbs CJ, Pezzuto JM. Mol Nutr Food Res. 2011;55:1249–1265. doi: 10.1002/mnfr.201100122. [DOI] [PMC free article] [PubMed] [Google Scholar]
- 19.Huang XF, Ruan BF, Wang XT, Xu C, Ge HM, Zhu HL, Tan RX. Eur J Med Chem. 2007;42:263–267. doi: 10.1016/j.ejmech.2006.08.006. [DOI] [PubMed] [Google Scholar]
- 20.Gosslau A, Pabbaraja S, Knapp S, Chen KY. Eur J Pharmacol. 2008;587:25–34. doi: 10.1016/j.ejphar.2008.03.027. [DOI] [PubMed] [Google Scholar]
- 21.Rimando AM, Kalt W, Magee JB, Dewey J, Ballington JR. J Agric Food Chem. 2004;52:4713–4719. doi: 10.1021/jf040095e. [DOI] [PubMed] [Google Scholar]
- 22.Wang W, Tang K, Yang HR, Wen PF, Zhang P, Wang HL, Huang WD. Plant Physiol Biochem. 2010;48:142–152. doi: 10.1016/j.plaphy.2009.12.002. [DOI] [PubMed] [Google Scholar]
- 23.Kang CH, Moon DO, Choi YH, Choi IW, Moon SK, Kim WJ, Kim GY. Toxicol In Vitro. 2011;25:605–612. doi: 10.1016/j.tiv.2010.12.006. [DOI] [PubMed] [Google Scholar]
- 24.Mitchell SH, Zhu W, Young CY. Cancer Res. 1999;59:5892–5895. [PubMed] [Google Scholar]
- 25.Harada N, Murata Y, Yamaji R, Miura T, Inui H, Nakano Y. J Nutr Sci Vitaminol (Tokyo) 2007;53:556–560. doi: 10.3177/jnsv.53.556. [DOI] [PubMed] [Google Scholar]
- 26.Harada N, Atarashi K, Murata Y, Yamaji R, Nakano Y, Inui H. J Steroid Biochem Mol Biol. 2011;123:65–70. doi: 10.1016/j.jsbmb.2010.11.002. [DOI] [PubMed] [Google Scholar]
- 27.Shi WF, Leong M, Cho E, Farrell J, Chen HC, Tian J, Zhang D. PLoS One. 2009;4:e7398. doi: 10.1371/journal.pone.0007398. [DOI] [PMC free article] [PubMed] [Google Scholar]
- 28.Kai L, Levenson AS. Anticancer Res. 2011;31:3323–3330. [PubMed] [Google Scholar]
- 29.Iguchi K, Toyama T, Ito T, Shakui T, Usui S, Oyama M, Iinuma M, Hirano K. J Androl. 2012;33:1208–1215. doi: 10.2164/jandrol.112.016782. [DOI] [PubMed] [Google Scholar]
- 30.Streicher W, Luedeke M, Azoitei A, Zengerling F, Herweg A, Genze F, Schrader MG, Schrader AJ, Cronauer MV. PLoS One. 2014;9:e98566. doi: 10.1371/journal.pone.0098566. [DOI] [PMC free article] [PubMed] [Google Scholar]
- 31.Kumar A LS, Dhar S, Rimando AM, Levenson AS. Journal of Medicinally Active Plants. 2014;3:1–8. [Google Scholar]
- 32.Paul S, DeCastro AJ, Lee HJ, Smolarek AK, So JY, Simi B, Wang CX, Zhou R, Rimando AM, Suh N. Carcinogenesis. 2010;31:1272–1278. doi: 10.1093/carcin/bgq004. [DOI] [PMC free article] [PubMed] [Google Scholar]
- 33.Rimando AM, Cuendet M, Desmarchelier C, Mehta RG, Pezzuto JM, Duke SO. J Agric Food Chem. 2002;50:3453–3457. doi: 10.1021/jf0116855. [DOI] [PubMed] [Google Scholar]
- 34.Dias SJ, Zhou X, Ivanovic M, Gailey MP, Dhar S, Zhang L, He Z, Penman AD, Vijayakumar S, Levenson AS. Sci Rep. 2013;3:2331. doi: 10.1038/srep02331. [DOI] [PMC free article] [PubMed] [Google Scholar]
- 35.Li K, Dias SJ, Rimando AM, Dhar S, Mizuno CS, Penman AD, Lewin JR, Levenson AS. PLoS One. 2013;8:e57542. doi: 10.1371/journal.pone.0057542. [DOI] [PMC free article] [PubMed] [Google Scholar]
- 36.Morris GM, Huey R, Lindstrom W, Sanner MF, Belew RK, Goodsell DS, Olson AJ. J Comput Chem. 2009;30:2785–2791. doi: 10.1002/jcc.21256. [DOI] [PMC free article] [PubMed] [Google Scholar]
- 37.Froimowitz M. Biotechniques. 1993;14:1010–1013. [PubMed] [Google Scholar]
- 38.Berendsen HJ, van der Spoel D, van Drunen R. Computer Physics Communications. 1995;91:43–56. [Google Scholar]
- 39.Van Der Spoel D, Lindahl E, Hess B, Groenhof G, Mark AE, Berendsen HJ. J Comput Chem. 2005;26:1701–1718. doi: 10.1002/jcc.20291. [DOI] [PubMed] [Google Scholar]
- 40.Kaminski GA, Friesner RA, Tirado-Rives J, Jorgensen WL. The Journal of Physical Chemistry B. 2001;105:6474–6487. [Google Scholar]
- 41.Car R, Parrinello M. Phys Rev Lett. 1985;55:2471–2474. doi: 10.1103/PhysRevLett.55.2471. [DOI] [PubMed] [Google Scholar]
- 42.Hess B. J Chem Theory Comput. 2008;4:116–122. doi: 10.1021/ct700200b. [DOI] [PubMed] [Google Scholar]
- 43.Kabsch W, Sander C. Biopolymers. 1983;22:2577–2637. doi: 10.1002/bip.360221211. [DOI] [PubMed] [Google Scholar]
- 44.van Lipzig MM, ter Laak AM, Jongejan A, Vermeulen NP, Wamelink M, Geerke D, Meerman JH. J Med Chem. 2004;47:1018–1030. doi: 10.1021/jm0309607. [DOI] [PubMed] [Google Scholar]
- 45.Wang H, Li J, Gao Y, Xu Y, Pan Y, Tsuji I, Sun ZJ, Li XM. Asian J Androl. 2010;12:535–547. doi: 10.1038/aja.2010.14. [DOI] [PMC free article] [PubMed] [Google Scholar]
- 46.Kumar A, Dhar S, Rimando AM, Lage JM, Lewin JR, Zhang X, Levenson AS. Ann N Y Acad Sci. 2015;1348:1–9. doi: 10.1111/nyas.12817. [DOI] [PubMed] [Google Scholar]
- 47.Dias SJ, Li K, Rimando AM, Dhar S, Mizuno CS, Penman AD, Levenson AS. Prostate. 2013;73:1135–1146. doi: 10.1002/pros.22657. [DOI] [PubMed] [Google Scholar]
- 48.Dhar S, Kumar A, Zhang L, Rimando AM, Lage J, Lewin J, Atfi A, Zhang X, Levenson AS. Oncotarget. 2016 doi: 10.18632/oncotarget.7841. 10.18632/oncotarget.7841. [DOI] [PMC free article] [PubMed] [Google Scholar]
Associated Data
This section collects any data citations, data availability statements, or supplementary materials included in this article.