

Abstract
Intergeneric microbial interactions may originate a significant fraction of secondary metabolic gene regulation in nature. Herein we expose a genomically characterized Nocardiopsis strain, with untapped polyketide biosynthetic potential, to intergeneric interactions via co-culture with low inoculum exposure to Escherichia, Bacillus, Tsukamurella and Rhodococcus. The challenge-induced responses of extracted metabolites were characterized via multivariate statistical and self-organizing map (SOM) analyses, revealing the magnitude and selectivity engendered by the limiting case of low inoculum exposure. The collected inventory of co-cultures revealed substantial metabolomic expansion in comparison to monocultures with nearly 14% of metabolomic features in co-cultures undetectable in monoculture conditions, and many features unique to co-culture genera. One set of SOM-identified responding features was isolated, structurally characterized by multidimensional NMR, and revealed to comprise previously unreported polyketides containing an unusual pyrrolidinol substructure and moderate and selective cytotoxicity. Designated ciromicin A and B, they are detected across mixed cultures with intergeneric preferences under co-culture conditions. The structural novelty of ciromicin A is highlighted by its ability to undergo a diastereoselective photochemical 12-π electron rearrangement to ciromicin B at visible wavelengths. This study shows how organizing trends in metabolomic responses under co-culture conditions can be harnessed to characterize multipartite cultures and identify previously silent secondary metabolism.
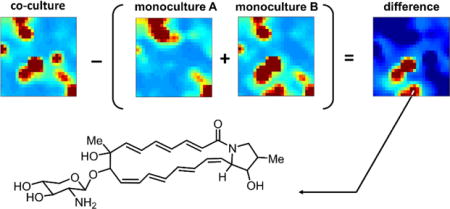
Graphical abstract
Largely untapped microbial secondary metabolism is evidenced by genomic sequence data,1–3 however converting the genetic ‘blueprints’ of secondary metabolism into purified molecules in useful quantities often remains a significant challenge. To address this challenge, an array of approaches has been developed to elicit transcription of targeted gene clusters of interest in native4–8 or heterologous hosts.9, 10 One attractive strategy is premised on the concept that a large fraction of secondary metabolite expression should ultimately be inducible in native encoding organisms via discrete chemical, biochemical, environmental, or biological stimuli.4 It may further be proposed that, given enough response data, such experimentally controlled stimuli can be used to link discrete host genetic regulatory elements to secondary metabolites that can be inferred from gene sequence data. Hence, the ultimate extrapolation of current native induction efforts is to translate the majority of cryptic or silent secondary metabolic gene clusters into molecules via rationally selected chemical and biological stimuli, unlocking cryptically regulated secondary metabolites for translation into drug discovery efforts.
Progress in linking native biological and biochemical induction to genomic determinants is dependent upon both identifying conditions suitable for activating secondary metabolism and identifying the desired products of activation within induced extracted metabolomes. Within the activation goal, there has been substantial recent progress in identifying chemical and/or biological stimuli connected to secondary metabolism. Vertically acquired antibiotic resistance,7 rare earth element exposure,11 natural and synthetic small molecule elicitors12 and microbial mixed culture13 constitute current examples of effective elicitors of secondary metabolism in microorganisms. Following stimulation, the identification of induced secondary metabolites within a stimulated organism’s metabolome is often nontrivial because stimulus-dependent metabolites must be detected, often in low abundance, within very complex metabolomic datasets. The development of analytical techniques and complementary high-dimensional chemometrics/bioinformatics strategies are essential to this process, and progress in the area has been recently demonstrated in microbes for several categories of stimulation.14–16
We have recently demonstrated that self-organizing map analytics can be used for metabolic phenotyping17 and to identify induced expression of secondary metabolites from organisms exposed to multiplexed chemical and biological stimuli.17, 18 Central to this approach is the hypothesis that microbial secondary metabolites are produced to respond to environmental stimuli and are detectable through patterns of metabolomic feature responses across multiple biochemical and biological stimulus conditions. This response-mapping approach has been applied to the well-characterized actinomycete Streptomyces coelicolor revealing that production of the majority of secondary metabolites in this strain can be induced by simple stimuli and subsequently identified by comparative metabolomics analysis.17 A subset of this approach has been applied to apoptolidin producer Nocardiopsis sp. FU40 ΔApoS19 to induce the production of a previously unreported aromatic polyketide family, the mutaxanthenes, produced subsequent to acquired antibiotic resistance.8
Herein we apply these tools to study the effects of intergeneric bipartite interactions on metabolic phenotype in microorganisms via multiplexed analysis of their extracted metabolomic inventories. We previously sequenced the genome of the apoptolidin producer Nocardiopsis sp. FU40 and major secondary metabolite gene clusters were identified by sequence searching the genome for genes with translated similarity to those diagnostic of secondary metabolism.19 A minimum of 20 putative gene clusters were identified as related to secondary metabolism including six putative polyketide synthase encoding gene clusters. Two of these, encoding type-I (reduced) polyketides, are relevant to this work. One encodes the cytotoxic macrolide apoptolidin, and the other an orphan polyene macrolactam with predicted structural relatedness to vicenistatin20 and incednine,21 via translated sequence similarity across the clusters. In order to obtain clean background for genome mining of new secondary metabolites from this strain, we have previously deactivated the biosynthetic gene cluster for the production of apoptolidins by replacing the terminal polyketide synthase ApoS8 with an apramycin resistance cassette.19 Exposure of Nocardiopsis sp FU40 ΔApoS to low inoculum competing Escherichia, Bacillus, Tsukamurella and Rhodococcus strains elicits significant metabolomic responses. A primary observation is that the metabolic inventory of co-culture is far greater than the sum of its monocultures. Exposure of Nocardiopsis ΔApoS to challenger strains stimulated the production of approximately 314/2288 (14%) detected metabolomic features not present in monocultures, and revealed the production of complex photochemically reactive macrolactam polyenes, ciromicin A (1) and its rearrangement product ciromicin B (2). In addition to facilitating discovery, comprehensively analyzing the consequences of bipartite interactions provide a basis for understanding the effects of multipartite interactions present in more complex microbiomes relevant to human biology and medicine.22
RESULTS
Self-organizing maps show consequences of co-culture
We have recently adapted self-organizing map (SOM) analytics for the study of microbial secondary metabolism, and have shown how this method can prioritize features and reveal trends in metabolite expression.17, 18 The application of molecular expression dynamics investigator (MEDI) to metabolomics datasets and the method by which SOM algorithms work to organize metabolomic features has already been described in detail.17, 18 Briefly, LC/MS based metabolomic analysis of culture extracts generally results in thousands of detectable features, where each feature represents an ion with a unique mass to charge ratio and a unique retention time. MEDI acts as an artificial neural network to organize these s features (m/z, retention time pairs) from complex multidimensional datasets into single tiles, or nodes, such that features with similar profiles (e.g. temporal intensity profiles, response to experimental conditions, etc.) will be localized in the same or adjacent space. The product of these SOM analyses are visually interpretable heat maps in which features are localized with regards to their intensity profile across experimental conditions, and tiles are colored by the centroid integrated intensity of features they contain.23 When applied to natural product discovery, MEDI has the added benefit of allowing users to rapidly screen sample conditions and identify stimuli which elicited the most profound metabolomic responses, even when the total abundance of the response may not be the most contributing factors to differences in variance as often highlighted in principle component analysis (PCA). In this work we use both complementary tools to answer two distinct questions. Firstly, what is the broad scale metabolic response to challenge for all components, irrespective of their abundances that is identifiable using MEDI. Secondly we use multivariate statistical analyses (MVSA) strategies (PCA) to rapidly identify the most abundant response changes for isolation. Collectively, these two approaches cross validate when MEDI results are ranked by intensity.
The results of the entire UPLC/IM-MS dataset of mono- and co-cultures, comprising 22.5 gigabytes of raw data in total, were converted into features via XCMS and processed in a single SOM analysis, and are displayed in Fig. 1 and Supplementary Results section A.1. Visual inspection of heat maps reveals the differences and similarities in organized metabolomic phenotypes within microbial genera. Of interest, mixed culture plots reveal that the mixed metabolomic phenotype is dominated by the Nocardiopsis culture, as expected due to low inoculum concentration of challenger organism. However, examination of the difference maps, which are generated by subtracting monoculture feature maps from co-cultures, reveals that mixed fermentations with TP and RW lead to significant metabolic activation, while competition with BS and EC elicits a lower new feature response from Nocardiopsis.
Figure 1. Metabolomic analysis of mono- and co-cultures.
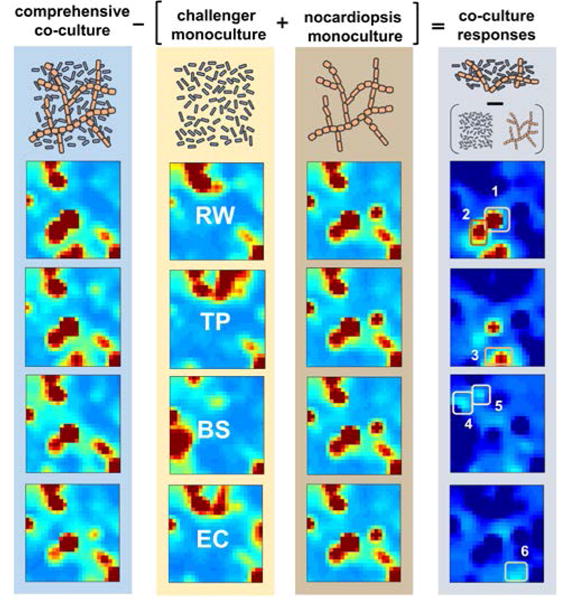
Self-organizing maps of features (m/z, retention time pairs) were generated from averaged UPLC/IM-MS chromatograms from four co-cultures and five monocultures and analyzed together using the MEDI algorithm. From left to right: column highlighted in blue contains metabolic heat maps from co-cultures of Nocardiopsis with a competitor, monocultures of competing organisms R. wratislaviensis (RW), T. pulmonis (TP), B. subtilis (BS), and E. coli (EC) are highlighted in yellow, and heat maps from Nocardiopsis ΔApoS monocultures are highlighted in brown. Difference maps show co-cultures after the subtraction of respective monocultures to identify unique and upregulated features. Hot spots are designated as regions of interest 1–6, and a list of intensity ranked features can be found in Supplementary Tables S1 – S9.
Apparent ‘hot spots’ within difference maps were designated as regions of interest (ROI)s and contained several features upregulated in co-cultures relative to monocultures. Ranking features within these ROI by intensity prioritized many new and abundant features with high agreement to prioritization via PCA (vide supra). A comprehensive layout of prioritized features can be seen in Supplementary Tables S1–S9, and a table of tentative identifications for abundant features is provided in Table S10 section A.2.
Co-culture induces large metabolomic changes
To assess the magnitude of changes in extracted microbial metabolomes, UPLC/IM-MS data were processed via XCMS and Meta-XCMS (Supplementary Results section A.3. and Figures S2–S5) to align chromatograms and identify feature commonalities and differences across samples. This comparative analysis revealed significant changes between the metabolomes of monoculture of Nocardiopsis ΔApoS and low inoculum challenger co-cultures. A total of 469 features out of 2288 detected (ca. 20%) were upregulated 2-fold or greater in at least one mixed fermentation in comparison to monocultures, and a great majority of these co-culture specific features (nearly 14% of the entire dataset) were not detectable in significant quantities in the monocultures, representing new metabolic features elicited by bipartite interactions. Venn diagrams of tripartite comparisons illustrate that for each co-culture, a large fraction of features appears in higher concentrations (Fig. 2 a–d). While some features are generally upregulated across mixed culture, there are a large number of features unique to a singular co-culture interaction (Fig. 2e). For instance, of the 469 newly produced or upregulated features, 52% were specific to a single co-culture condition, while 21% were shared by 3 or more of the co-cultures. Taken together, the demonstrated generic selectivity of microbial responses suggests that features accumulating in response to co-culture are not due solely to factors such as nutrient availability, but also to biochemical cues arising from discrete intergeneric interactions.
Figure 2. Distribution of metabolomics features between co-cultures.
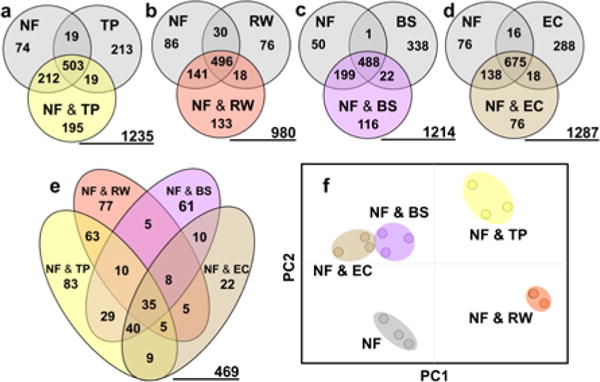
(a–d) Venn diagrams depicting the distribution of features separated by 2 fold intensity differences with the underlined number representing the total number of detected features from the multipartite analysis. (e) Composite Venn diagram showing the distributions between different co-cultures of the 469 total 2-fold or greater upregulated features. (f) PCA plot shows separation of co-cultures relative to monoculture Nocardiopsis (NF) along PC1 and PC2 which reflect 68 % of data variance. (51 % for PC 1 and 17 % for PC 2).
Response features identified by comparative metabolomics
Due to the size and complexity of metabolomics datasets acquired via UPLC/IM-MS, multivariate statistical analyses are often utilized to identify significant correlations within the data. Principal component analysis (PCA) functions to identify a subset of linear combinations of variables which summarize the entire dataset by identifying principal components that capture the majority of data variance. A PCA comparison of all features (Fig. 2f) shows that each generic condition elicits a unique set of extracted metabolomes clearly separable via unsupervised distribution along the first and second principal components. The analysis of co-culture data via PCA (Fig. 3a) demonstrates qualitatively how the extracted metabolomes of stationary phase co-cultures differ from their constituent organisms in monoculture. Mixed culture with RW demonstrated the largest degree of differences via MEDI analysis and we next evaluated these differences via exploring features contained within ROI (Fig. 3b). Ranking features within ROI by intensity reveals metabolites that are most detectably increasing as a result of co-culture. These rankings were cross-validated by principal component loadings analysis, and confirmed via inspection of extracted ion chromatograms of those abundant features which were predicted to be most unique to the co-cultures (Fig. 3c, d, and Supplementary section A.4.).
Figure 3. Comparison of principal component and MEDI analyses for feature prioritization.
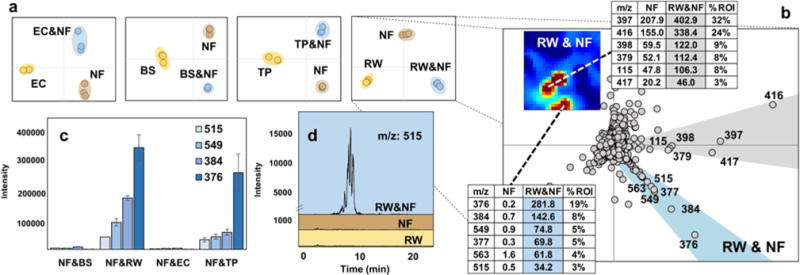
(a) PCA plots reveal group separation of co-cultures shown in blue from their respective monocultures with E. coli (EC), B. subtilis (BS), T. pulmonis (TP), and R. wratis (RW) shown in yellow, and Nocardiopsis FU40 (NF) shown in brown. The first and second principal components are aligned along the x-axis and y-axis respectively. (b) Comparison of principal component loadings plot vectors and their corresponding two regions of interest from MEDI analysis show similar results. Features aligned on the blue vector of the loadings plot are uniquely produced in mixed culture, while the grey vector holds features upregulated in the co-culture, but also present in Nocardiopsis monoculture. The distance from the origin reflects relative ion abundance as can be seen in the bar graphs in figure (c), which shows averaged integrated intensities of multiple co-culture specific features across all co-culture conditions to indicate competitor selectivity for metabolic activation in Nocardiopsis. (d) Extracted ion chromatograms of m/z: 515 from RW and Nocardiopsis co and monocultures colored in the manner of the PCA plots.
A polyene prioritized for structure elucidation
Considering the strong genomic evidence for a polyene macrolactam type polyketide, intensity ranked lead features prioritized in ROI were searched for expected extended chromophores. One of the features identified, a new apparent polyene (with a strong λmax of 290 nm) with an accurate mass of 515.275 Da) was upregulated in all mixed cultures and most highly upregulated in co-cultures with RW and TP. Also noted was an isobaric species with a different retention time, but lacking the characteristic polyene structure.
The Nocardiopsis/RW co-culture fermentation was scaled 20-fold (20 × 50 mL), and combined extracts were pre-fractionated by size exclusion chromatography in methanol followed by isolation using a water/acetonitrile gradient on C18 HPLC. Compound 1, which we named ciromicin A (after the Latin irregular verb for war/cite/disturb/invoke/), was isolated as a pale yellow solid with UV spectrum showing maxima at 207 and 290 nm. High resolution mass spectrometry identified the m/z of 515.275 [M+H] and indicated, along with NMR spectral data, a molecular formula of C28H38N2O7. Three partial structures of compound 1 were derived from COSY, TOCSY, HSQC, and HMBC spectral data (Fig. 4a, green) with two poly-unsaturated chains with three and four double bonds respectively and the residual spin system an unusual five carbon amino sugar. HMBC correlations from proton H-9 to quaternary carbon C-8 and from methylene protons H-21 to carbon C-1 merged the linear polyene substructures to form a cyclic polyene (Fig. 4a, compound 1). Interestingly, the HMBC correlation from proton H-18 to carbon C-1, which was observed only in elevated temperature (50 °C) confirmed the presence of an unusual pyrrolidinol moiety which we previously proposed on the basis of COSY and HSQC data. Finally, the HMBC correlation from proton H-1′ to carbon C-9 linked the amino sugar to aglycone yielding the complete structure of ciromicin A (1) (Fig. 4a, Supplementary Tables S11–S12 and Figures S6–S19 of section B). Ciromicin B (2), an isobar of ciromicin A (1) with a different retention time was originally observed in crude extract along with compound 1 however, due to a low level of abundance we were unable to obtain 2D NMR spectral data. Surprisingly, we later observed that pure ciromicin A (1) in methanol solution under ambient conditions, converted to a chromatographically distinct compound, which overlapped in retention time, UV and mass spectral data with ciromicin B (2). Isolating environmental variables, we observed that this isomerization was entirely dependent upon exposure to ambient visible light, and when ciromicin A (1) was exposed to ambient sunlight in a borosilicate glass tube for 2 hours, we observed almost full conversion to ciromicin B (2). Subsequently, we determined the wavelength dependence of the conversion of ciromicin A (1) via monochromatic UV/VIS exposure of varying wavelengths and analyzing for conversion via LC/MS. This further confirmed photochemical dependency and demonstrated wavelength dependency on product formation. Visible light (400 nm) yielded ciromicin B (2) as the major product. Maximum conversion to ciromicin B (2) was observed at 300 nm (Fig. 5c and Supplementary Figure S27 section C.1.), but lead to the formation of additional isomers. (Supplementary Figure S27, compound 3). Isolation, structure elucidation and analysis of these ciromicins will be described in a subsequent study. Ciromicin B (2) was isolated as pale yellow solid with UV spectrum showing maxima at 209 and 230 nm. The high resolution mass spectrometry yielded an m/z of 515.275 [M+H], identical to m/z of compound 1, indicating the same molecular formula of C28H38N2O7. By comparing the HSQC spectral data of compound 2 to compound 1, we noticed the presence of four additional methines and the absence of two double bonds. On the basis of COSY, TOCSY and HMBC correlations, one big encompassing spin system was assembled and linked to the quaternary carbons C-8 and C-1 yielding a structure of ciromicin B (2) which possess an unusual pyrrolizidinone moiety (Fig. 4a, compound 2).
Figure 4. Structures of ciromicins A (1) and B (2).
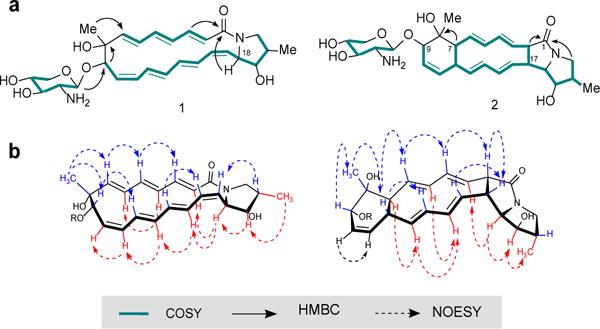
(a) Stuctures were generated from analysis of COSY, HSQC and HMBC spectral data. Ciromicin A (1) undergoes cyclization when exposed to ambient light yielding ciromicin B (2). (b) Major NOESY correlations and relative stereochemistry of ciromicins.
Figure 5.
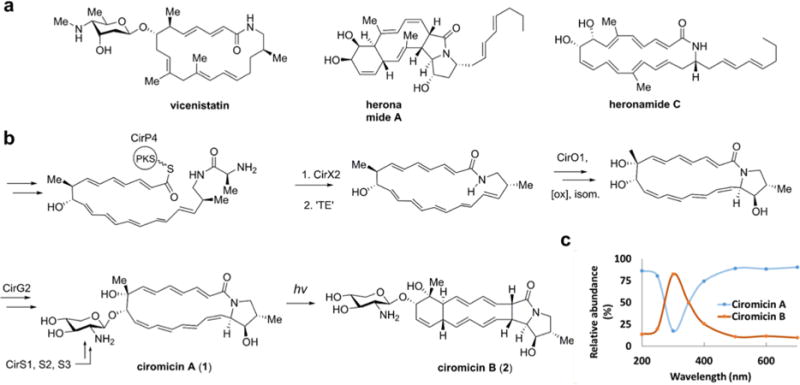
(a) Structurally related polyene macrolides. (b) Proposed biosynthesis of ciromicin A (1) and photochemical chemical conversion to ciromicin B (2). (c) Conversion of ciromicin A (1) to ciromicin B (2) after a 30 minute exposure at the indicated wavelength demonstrates selective conversion in the UV/VIS range.
The relative stereochemistry of ciromicins was determined Ω on the basis of proton coupling constants combined with careful evaluation of 2D NOESY NMR (Fig 4b). Stereochemical analysis was facilitated by the conformationally restrained tetracycle of ciromicin B (2). The geometry of double bonds was elucidated by analysis of proton coupling constants and further confirmed by NOESY experiment. The large couplings of J3,4 = 15 Hz, J5,6 = 15 Hz, J13,14 = 15.7 Hz and J15,16 = 16.2 Hz reveal a likely 3E, 5E, 13E and 15E geometry. The remaining double bond showed overlap in proton resonances but the presence of six- membered ring system strongly suggests a Z geometry, which was further confirmed by the NOE correlation between protons H-10 and H-11. The relative stereochemistry of the 9 chiral centers of aglycone was established on the basis of NOESY correlations. Starting with cyclohexenyl ring, we observed strong NOE from the 23-CH3 to H-6, H-9 and H-12 but not H-7 and NOE from H-7 to H-5 and H-13. This suggested a trans relative orientation of H-7 and H-12. For the hexahydro-3H-pyrrolizin-3-one moiety, we observed NOE correlations from H-2 to H-4 and H-17, and from H-17 to H-16 indicating that they were on the same face of the cyclic system with H-2 and H-17 in cis relative orientation. NOE correlations from the methine proton H-18 to H-3, H-15, H-19 and 22-methyl placed them all on the opposite face of the cyclic system.
We then attempted to relate the stereochemisty of the pyrrolidinol moiety in ciromicin B (2) to the cyclohexene ring. Beginning with proton H-2, because the NOESY data suggested that protons H-2 and H-4 were on the same face of the cyclic system, and the geometry of the double bonds was determined to be 3E, 5E, we deduced that protons H-2 and H-7 were on the opposite face of the cyclic system. The same approach was used to relate the stereocenters C-12 and C-17. Starting with proton H-12 and knowing that protons H-12 and H-14 were on the same face of the cyclic system, and double bonds showed 13E and 15E geometry, we determined that protons H-12 and H-17 were on the same face of the cyclic system. Taken together these data suggest the relative stereochemistry of ciromicin B (2) to be 2S, 7S, 8R, 9S, 12R, 17R, 18R, 19R, 20S. Since ciromicin B (2) is the product of chemical conversion of ciromicin A (1), the stereochemistries of five chiral methine centers of ciromicin A (1) were assumed to be the same: 8R, 9S, 18R, 19R, 20S. This was further confirmed by NOESY correlations, in which we observed NOE interactions from the 23-CH3 to the H-9 methine and H-7 double bond, placing them on the same face of the macrocyclic system. Furthermore, NOE from H-18 to H-19 and 22-methyl and from H-20 to H-17 supported previously proposed stereochemistry in these positions. The geometry of the double bonds for ciromicin A (1) was determined by the analysis of proton coupling constants and 2D NOESY NMR. The large couplings of J2,3 = 15 Hz, J4,5 = 15 Hz, J6,7 = 15 Hz, J12,13 = 15 Hz and J14,15 = 15 Hz revealed 2E, 4E, 6E, 12E, and 14E geometry for corresponding double bonds. For the remaining double bonds, due to partial overlap of proton resonances, we were unable to establish definite geometry, therefore we performed an additional NMR experiment in CD3OD, where the desired proton resonances fully separated. The coupling constants of J10,11 = 10 Hz and J16,17 = 10.5 Hz indicated 10Z and 16Z geometry in these positions. The stereochemistry of the amino sugar present in both ciromicins was deduced from the couplings extracted from the proton NMR of compound 2 due to less overlap in proton resonances. Large coupling constants of J1′,2′ = 8.5 Hz, J2′,3′ = 9 Hz, J3′,4′ = 9 Hz indicated that the connected carbon, nitrogen and oxygen were all likely equatorial. Moreover, NOE from H-1′ to H-9 of the aglycon suggested 1′R relative stereochemistry. Tables of all NMR correlations and NMR spectra may be found in Supplementary Tables S11–S13 section B.1. and Figures S6–S26 section B.2. Due to unsuccessful attempts to generate crystals of ciromicins for the x-ray analysis, the absolute stereo-chemistry of C-9 was putatively proposed by inference from analysis of the polyketide synthase (vide infra) (Supplementary Figure S29 section D.1.).
Biosynthesis of ciromicins is related but distinct to vicenistatin
The putative gene cluster encoding ciromicin biosynthesis was identified by locating a polyketide synthase with a modular organization consistent with the biosynthesis of ciromicins24, 25,26 and refined by closing sequencing gaps via PCR amplification (Supplementary Table S14 section D.1.). The analysis of putative open reading frames reveals a cluster similar to biosynthetic relative vicenistatin and wholly consistent with the proposed biosynthesis of ciromicin (Fig. 5). A complete set of genes for the biosynthesis of starter unit 3-amino-2-methylpropionate was evident, which is likely activated onto peptidyl carrier protein (CirA7) and coupled transiently to the characteristic L-alanine, which is unique to polyene macrolactams and serves as a biosynthetic ‘protective group’ that is cleaved prior to macrocyclization.27 CirX2 possesses 62% identity with VinJ, the analogous peptidase in vicenistatin. The translated polyketide sequence differs substantially and predicts nine active homologations, predominantly resulting in polyene extension, with only module 6 (CirP2) lacking a dehydratase domain and terminating catalytically with a ketoreductase (KR6), and thereby encoding the hydroxyl group at C-9, with a predicted ‘B-type’ (S, in this case) stereochemistry based on analysis of conserved amino acids in the ketoreductase catalytic site28, 29 (Supplementary Figures S28 and S29 section D.1.). Of the acyltranferase domains, only AT6 is predicted to activate methylmalonate, and is responsible for methyl substitution at C-8. An additional module directly upstream of the thioesterase is predicted to be nonfunctional as it lacks conserved active site residues in both AT and DH domains and is missing a KR domain. The resulting heptaene polyketide sequence predicts a structure bearing comparison to incednine30 and vicenistatin,31 and is entirely consistent with the 22-membered polyene macrolactam scaffold observed herein. Coupling of the macrolactam amide to C-18 may occur via addition to an epoxide precursor, which is speculative, but partially supported by the polyketide domain sequence, which predicts a double bond at C-18/19 in the biosynthetic precursor (Supplementary Table S14 and Figure S28). An additional oxidation is required at C-8, likely mediated by a cytochrome P450 (CirO1). Finally, a cassette of genes, CirS1/2/3, with high sequence similarity to IdnS1/2/3, encodes the biosynthesis of the appending sugar UDP-xylosamine from UDP-N-acetyl-D-glucosamine. CirG2, with 35% identity to VinC from vicenistatin, encodes the likely glycosyltranferase. (Supplementary Table S14).
Given the fact that ciromicins A (1) and B (2) are closely related to other polyene macrolactams like for example cytotoxic vicenistatin20, we tested them for in vitro cytotoxicity against MV-4-11 human leukemia cell line. Compared to vicenistatin (IC50 of 0.24 μM against HL-60 human leukemia), compounds 1 and 2 showed moderate activity with IC50 of 8.1 μM for compound 1 and 9.3 μM for compound 2. No antibacterial or antifungal activity was detected when tested against Bacillus, E. coli or Saccharomyces.
To the best of our knowledge, the pyrrolidinol substructure found in ciromicin A (1) has not been previously reported in the peer reviewed literature. However, a similar truncated tetracyclic cyclohexene/hexahydro-3H-pyrrolizin-3-one scaffold in ciromicin B (2) is found in one other reported secondary metabolite, heronamide A, which is co-purified with a putative biosynthetic progenitor heronamide C,32 a 20-membered polyene macrolactam likely biosynthetically divergent from incednine and vicenistain.33 Raju and coworkers propose a biosynthetic relationship between heronamide C and A via a conrotatory 4π+6π electrocyclic rearrangement. The observation herein of a wavelength-dependent chemical conversion of ciromicin A (1) to B (2), suggests that the mechanism of rearrangement of heronamides may be purely photochemical via a previously unreported labile pyrrolidinol-functional biosynthetic intermediate. Photochemical rearrangements of up to 8-π electrons in natural products are rare but not unknown.34 Notable examples include the 8π [4 + 4] conversion of alteramide A35 and the 8π−6π electrocyclization cascade implicated in enandrianic acid biosynthesis.36, 37 However, while the overall mechanism of photochemical conversion of ciromicin A (1) remains to be determined, the intriguing diastereoselective visible light-triggered 12-π rearrangement of ciromicin A (1) to B (2) appears to be unprecedented at this time.
DISCUSSION
Extrapolation of the costs of de novo genome sequencing suggests that sequence data for all potential secondary metabolite producers will become available soon,38, 39 and genome mining efforts will be fully potentiated from a genomic supply data perspective. However, generalizable tools to convert gene clusters of secondary metabolites of interest into molecules remain underdeveloped. Exciting progress is being made in expressing cryptic secondary metabolic gene clusters in heterologous hosts and/or endogenous refactoring of native regulatory elements.40–42 These powerful techniques use recombinant genetic manipulation, cloning, and/or gene synthesis to facilitate natural product discovery and will continue to be important methods to unlock repressed gene clusters of interest as technology continues to advance. Herein we demonstrate that utilization of native expression mechanisms, and enabling them with tools in comparative metabolomics such as SOM response analytics, has the potential to release a large fraction of native biosynthesis and fuel new molecular diversity generation for drug discovery efforts. Notably, while this study used genomic prescience of a polyene macrolactam to guide prioritization of feature response data for isolation, a wide variety of analytical techniques can be joined with stimulus response mapping to improve prioritization including molecular networking,43, 44 which is used to identify expected and precedented structural subclasses, in addition to other tandem mass spectrometric methods such as peptidogenomics,45–47 which identifies predicted peptidic secondary metabolites via molecular networking and MS/MS analysis. It is expected that as these gene cluster-linked expression studies accumulate, a database of correlated gene clusters and their promoter elements and stimulus conditions can potentially facilitate the targeted induction of gene clusters via promoter-specific stimuli. With this in hand, what is now a process of trial and error in native expression stimulation strategies can be converted into a rational palette of tools for activating and identifying the products of cryptic secondary metabolism evidenced by genomic analysis, independent of challenging genetic manipulation of native or heterologous gene expression.
The complex problem of decoupling the chemical basis for microbial interactions within ecological contexts is now of increasing interest, and progress in this area is dependent upon the development of innovative new analytical techniques.48–50 Herein, the analysis of a panel of biological stimuli arising from defined co-culture was facilitated by SOM analysis, which efficiently identified unique patterns in microbial metabolomics responses engendered from specific intergeneric interactions (Fig. 1). The identification of R. wratis as a productive co-culture strain was cross-validated via comparative metabolomics (Fig. 2). Isolation/and elucidation campaigns are labor-intensive and narrowing to R. wratis. resulted in identification of a productive system from which several new and upregulated response products were isolated. The output of SOM analysis is distinct from MVSA and molecular networking in that difference maps capture all responding peaks, irrespective of intensity, and organizes them not by molecular similarity, but by intensity profiles across multiple stimuli and provides a quick assessment and organization of metabolites resulting from stimulus. Whereas PCA analysis of each conditions are difficult to distinguish, (Fig. 3a) MEDI shows discernable phenotypes. However, as demonstrated here, when SOM prioritized peaks within ROI are further ranked by intensity (Fig. 3b), they recapitulate PCA loadings analysis, and it is expected that MS/MS generated fragmentation data should cluster with parent ions into nodes if they are included in the SOM matrix. Notable in this study, the challenger organisms were introduced at low inoculum levels after the Nocardiopsis was well established, and were present at undetectable levels after six days, highlighting how minor constituents of a microbial ecosystem can have large effects on its observable chemical ecology, and how those changes can be mapped and explored by SOM analytics.
There are several categories of potential intergeneric interactions that ultimately arise from the interaction of co-localized microorganisms. Chemical interactions may result from the diffusion of small molecules including organic and inorganic nutrients and byproducts or toxins, signaling molecules, secondary metabolites (e.g. pleiotropic factors or antibiotics), pH, or other chemical exchange. Biochemical or biological interactions may result from the action of extracellular enzymes (e.g. lipases) or biochemical recognition of cell wall or membranes (e.g. mycolic acids).13 These stimuli trigger an array of potential responses including via regulatory networks and/or biochemical pathways. Previously we have demonstrated and characterized the degree of metabolomic expansion in Nocardopsis that is induced by developing resistance to rifampicin and streptomycin and determined the structure of a new family of aromatic polyketides induced by adaptive mutations in RNA polymerase. Notably, the single nucleotide changes engendered by this vertically acquired antibiotic resistance resulted in large global changes in measured metabolites. The acquisition of resistance to antibiotic secondary metabolites may be considered an intergeneric interaction response. Similarly, the current study reveals how a small change in the biology of a system, in this case via a low inoculum of a challenger organism, can have large effects on the metabolomic output, of which secondary metabolites again play a featuring role. The self-organizing map stimulus-response identification workflow provides a tool to begin examining how these interactions excite changes in microbiological communities intergenerically and can potentially be used to provide insight into more complex interkingdom interactions in eukaryotic systems.
EXPERIMENTAL SECTION
Fermentation
Seed culture (1mL) of Nocardiopsis ∆ApoS in ISP2 broth was inoculated into 25 mL of R4 fermentation medium and incubated in a rotary shaker at 30 °C. At the same time seed cultures of E. coli and Bacillus subtilis, Tsukamurella pulmonis and Rhodococcus wratislaviensis were prepared and incubated for 24 hours prior to addition to Nocardiopsis fermentation flasks. A 200 μL inoculum of each competing organism was added to already established Nocardiopsis cultures and also to flasks containing sterile R4 mediumA total of 4 different co-cultures and a total of 5 monocultures (one for Nocardiopsis and one for each competitor) were then incubated in a rotary shaker at 30 °C for another 6 days. At the time of inoculation, cultures contained 7 × 10⁷ cfu/mL of Nocardiopsis and 3 × 10⁶, 3 × 10⁵, 2 × 10⁶, 7 × 10⁶ cfu/mL of RW, TP, BS, and EC respectively, corresponding to a Nocardiopsis/challenger ratio ranging from 10:1 (EC) to 200:1 (TP) at the beginning of mixed culture. At six days, dilution plating of co-cultures only resulted in Nocardiopsis colonies, further emphasizing the excess population of this strain in culture conditions. For scaled fermentation, the number of 25 mL culture flasks was multiplied up to a total of 500 mL of fermentation volume. Also, only one competing organism (Rhodococcus) was picked as an activator since it seemed to be the most effective in stimulating ciromicin production in an initial experiment.
Extraction
For extraction, 25 mL of methanol was added to each mixed and monoculture and shaken for 1 hour. Mycelia were separated from broth by centrifugation and supernatants were dried in vacuo and subjected to UPLC/IM-MS analysis. For scaled fermentation, the same methanol extraction of each 25 mL culture was performed but supernatants were first combined and then dried in vacuo for the isolation of ciromicins.
Compounds purification
Crude extract containing predominantly ciromicin A (1) and some ciromicin B (2) was first separated on a preparative RP-HPLC using linear gradient of water/acetonitrile containing 0.1 % of formic acid. Fractions with UV indicative of ciromicins were then combined and applied on size exclusion Sephadex LH-20 column for a gravity run in methanol. The final yields of purified ciromicin A (1) and B (2) were 5 mg and 0.5 mg respectively.
Photochemical conversion
For photochemical reaction experiment, we dissolved 6 mg of purified ciromicin A (1) in 5 mL of methanol and split it into 10 samples, 500 μL each. We then exposed each sample to a different wavelength light for 30 min starting with visible light of 700 nm, through the long and medium wave UV and ending with short wave UV of 150 nm. The experiment was performed in the dark room using ORIEL Illuminator equipped with 1000 W Hg(Xe) ozone free arc lamp and 450–1000W universal arc lamp power supply. We monitored the progress of conversion via LC/MS analysis.
UPLC/IM-MS Data Acquisition
Sample extracts were resuspended at a concentration of 200 mg/mL in mobile phase A (see below). UPLC/IM-MS-MS (MSE) data acquisition was performed on a SYNAPT G2 HDMS (Waters Corp., Milford, MA) with a 30 min gradient. Mobile phase A consisted of 95 % H2O and 5 % acetonitrile with 10 mM ammonium acetate, and mobile phase B consisted of 95 % acetonitrile and 5 % water with 10 mM ammonium acetate. A 1×100 mm 1.7 μm particle BEH-T3 C18 column (Waters Corp.) was used for chromatographic separations with a flow rate of 75 μL/min and a column temperature of 40°C. An autosampler with a loop size of 5 μL held at 4 °C was used for sample injection. The initial solvent composition was 100 % A, which was held for 1 min and ramped to 0 % A over the next 15 min, held at 0 % A for 2 min, and returned to 100 % A over a 0.1 min period. The gradient was held at 100 % A for the next 10.9 min for equilibration. Prior to analysis of the sample queue, ten sequential column-load injections were performed with 5 μL of the quality control. Samples were analyzed in triplicate with the order of injection randomized.
IM-MSE spectra were acquired at a rate of 2 Hz from 50–2000 Da in positive ion mode for the duration of each sample analysis. The instrument was calibrated to less than 1 ppm mass accuracy using sodium formate clusters prior to analysis. A two-point internal standard of leucine enkephalin was infused in parallel to the sample at a flow rate of 7 μL/min, and data were acquired every 10 s. The source capillary was held at 110 °C and 3.0 kV, with a desolvation gas flow of 400 L/h and a temperature of 150 °C. The sampling cone was held at a setting of 35.0, with the extraction cone at a setting of 5.0. In the MSE configuration, low and high energy spectra were acquired for each scan. High energy data provided a collision energy profile from 10–30 eV in the transfer region, providing post-mobility fragmentation. Ion mobility separations were performed with a wave velocity of 550 m/s, a wave height of 40.0 V, and a nitrogen gas flow of 90 mL/min, with the helium cell flow rate at 180 mL/min. Internal calibrant correction was performed in real time.
Analysis of metabolomic data
Data files were converted from raw to mzXML using the msconvert tool from ProteoWizard 3.0.5759. Each mixed fermentation was treated as a separate experiment, and samples were grouped into 4 sets, each containing monoculture Nocardiopsis, monoculture competing organism, and Nocardiopsis & competing organism. Peak picking and alignment were then performed using XCMS in R10 for each group (see Supplementary section A.3. for code), and the 4 resultant XCMS datasets were combined using meta-XCMS. The combined dataset was then manually inspected. This method was found to give better results than performing a single XCMS analysis on the entire dataset. Processed data were then normalized by total ion count, and low intensity features were checked against the raw data to ensure legitimacy. Features not discernable from noise and features after 15 minutes were removed from the dataset. Feature intensities from each co-culture were compared to their respective monocultures and sorted by fold change to select for up and down regulated features.
Multivariate statistical analyses were performed using Umetrics extended statistics software EZinfo version 2.0.0.0 (Waters, Milford, MA). For MEDI analyses, triplicate injections from the XCMS readout were averaged, and data were formatted as shown in Supplementary section A.3. GEDI software allows users to adjust sorting parameters. A grid of 25 × 26 nodes was selected, with 1st and 2nd phase training iterations of 80 and 100 respectively. Advanced parameters, distance metrics, and initialization method are shown in Figure S5.
Supplementary Material
Acknowledgments
We thank C. Goodwin and C. McNees for contributions to developing comparative metabolomics concepts described in this work. This work was supported by the National Institutes of Health (grant to B.O.B. and J.A.M. GM092218, and training grant for B.C.C. T32 GM 0650086), and the Vanderbilt Institute of Chemical Biology and Vanderbilt Institute for Integrated Biosystems Research and Education.
Footnotes
Supporting Information
Additional NMR spectral data, extracted ion chromatograms and genetic analysis of putative gene cluster. This material is available free of charge via the Internet at http://pubs.acs.org.
Author Contributions
D.K.D. and B.O.B. conceived mixed fermentation experiments, D.K.D. designed co-culture experiments, isolated ciromicins and performed structure elucidation studies. J.A.M. and B.C.C. designed and performed UPLC/IM-MS metabolomics experiments and bioinformatics analysis, and all authors contributed to writing the manuscript.
Notes
The authors declare no competing financial interests.
References
- 1.Cimermancic P, Medema MH, Claesen J, Kurita K, Brown LCW, Mavrommatis K, Pati A, Godfrey PA, Koehrsen M, Clardy J, Birren BW, Takano E, Sali A, Linington RG, Fischbach MA. Insights into Secondary Metabolism from a Global Analysis of Prokaryotic Biosynthetic Gene Clusters. Cell. 2014;158:412–421. doi: 10.1016/j.cell.2014.06.034. [DOI] [PMC free article] [PubMed] [Google Scholar]
- 2.Doroghazi JR, Albright JC, Goering AW, Ju KS, Haines RR, Tchalukov KA, Labeda DP, Kelleher NL, Metcalf WW. A roadmap for natural product discovery based on large-scale genomics and metabolomics. Nat Chem Biol advance online publication. 2014 doi: 10.1038/nchembio.1659. [DOI] [PMC free article] [PubMed] [Google Scholar]
- 3.Bentley SD, Chater KF, Cerdeno-Tarraga AM, Challis GL, Thomson NR, James KD, Harris DE, Quail MA, Kieser H, Harper D, Bateman A, Brown S, Chandra G, Chen CW, Collins M, Cronin A, Fraser A, Goble A, Hidalgo J, Hornsby T, Howarth S, Huang CH, Kieser T, Larke L, Murphy L, Oliver K, O’Neil S, Rabbinowitsch E, Rajandream MA, Rutherford K, Rutter S, Seeger K, Saunders D, Sharp S, Squares R, Squares S, Taylor K, Warren T, Wietzorrek A, Woodward J, Barrell BG, Parkhill J, Hopwood DA. Complete genome sequence of the model actinomycete Streptomyces coelicolor A3(2) Nature. 2002;417:141–147. doi: 10.1038/417141a. [DOI] [PubMed] [Google Scholar]
- 4.Hertweck C. Hidden biosynthetic treasures brought to light. Nat Chem Biol. 2009;5:450–452. doi: 10.1038/nchembio0709-450. [DOI] [PubMed] [Google Scholar]
- 5.Bode HB, Bethe B, Hofs R, Zeeck A. Big effects from small changes: Possible ways to explore nature’s chemical diversity. Chembiochem. 2002;3:619–627. doi: 10.1002/1439-7633(20020703)3:7<619::AID-CBIC619>3.0.CO;2-9. [DOI] [PubMed] [Google Scholar]
- 6.Ochi K, Hosaka T. New strategies for drug discovery: activation of silent or weakly expressed microbial gene clusters. Appl Microbiol Biot. 2013;97:87–98. doi: 10.1007/s00253-012-4551-9. [DOI] [PMC free article] [PubMed] [Google Scholar]
- 7.Hosaka T, Ohnishi-Kameyama M, Muramatsu H, Murakami K, Tsurumi Y, Kodani S, Yoshida M, Fujie A, Ochi K. Antibacterial discovery in actinomycetes strains with mutations in RNA polymerase or ribosomal protein S12. Nat Biotechnol. 2009;27:462–464. doi: 10.1038/nbt.1538. [DOI] [PubMed] [Google Scholar]
- 8.Derewacz DK, Goodwin CR, McNees CR, McLean JA, Bachmann BO. Antimicrobial drug resistance affects broad changes in metabolomic phenotype in addition to secondary metabolism. Proc Natl Acad Sci USA. 2013;110:2336–2341. doi: 10.1073/pnas.1218524110. [DOI] [PMC free article] [PubMed] [Google Scholar]
- 9.Chiang YM, Chang SL, Oakley BR, Wang CCC. Recent advances in awakening silent biosynthetic gene clusters and linking orphan clusters to natural products in microorganisms. Curr Opin Chem Biol. 2011;15:137–143. doi: 10.1016/j.cbpa.2010.10.011. [DOI] [PMC free article] [PubMed] [Google Scholar]
- 10.Ongley SE, Bian XY, Neilan BA, Muller R. Recent advances in the heterologous expression of microbial natural product biosynthetic pathways. Nat Prod Rep. 2013;30:1121–1138. doi: 10.1039/c3np70034h. [DOI] [PubMed] [Google Scholar]
- 11.Kawai K, Wang G, Okamoto S, Ochi K. The rare earth, scandium, causes antibiotic overproduction in Streptomyces spp. FEMS Microbiol Lett. 2007;274:311–315. doi: 10.1111/j.1574-6968.2007.00846.x. [DOI] [PubMed] [Google Scholar]
- 12.Moore JM, Bradshaw E, Seipke RF, Hutchings MI, McArthur M. Use and Discovery of Chemical Elicitors That Stimulate Biosynthetic Gene Clusters in Streptomyces Bacteria. Method Enzymol. 2012;517:367–385. doi: 10.1016/B978-0-12-404634-4.00018-8. [DOI] [PubMed] [Google Scholar]
- 13.Onaka H, Mori Y, Igarashi Y, Furumai T. Mycolic Acid-Containing Bacteria Induce Natural-Product Biosynthesis in Streptomyces Species. Appl Environ Microb. 2011;77:400–406. doi: 10.1128/AEM.01337-10. [DOI] [PMC free article] [PubMed] [Google Scholar]
- 14.Traxler MF, Kolter R. A massively spectacular view of the chemical lives of microbes. Proc Natl Acad Sci USA. 2012;109:10128–10129. doi: 10.1073/pnas.1207725109. [DOI] [PMC free article] [PubMed] [Google Scholar]
- 15.Nguyen DD, Wu CH, Moree WJ, Lamsa A, Medema MH, Zhao XL, Gavilan RG, Aparicio M, Atencio L, Jackson C, Ballesteros J, Sanchez J, Watrous JD, Phelan VV, van de Wiel C, Kersten RD, Mehnaz S, De Mot R, Shank EA, Charusanti P, Nagarajan H, Duggan BM, Moore BS, Bandeira N, Palsson BO, Pogliano K, Gutierrez M, Dorrestein PC. MS/MS networking guided analysis of molecule and gene cluster families. Proc Natl Acad Sci USA. 2013;110:E2611–E2620. doi: 10.1073/pnas.1303471110. [DOI] [PMC free article] [PubMed] [Google Scholar]
- 16.Yang YL, Xu YQ, Straight P, Dorrestein PC. Translating metabolic exchange with imaging mass spectrometry. Nat Chem Biol. 2009;5:885–887. doi: 10.1038/nchembio.252. [DOI] [PMC free article] [PubMed] [Google Scholar]
- 17.Goodwin CR, Sherrod SD, Marasco CC, Bachmann BO, Schramm-Sapyta N, Wilcswo JP, McLean JA. Phenotypic Mapping of Metabolic Profiles Using Self-Organizing Maps of High-Dimensional Mass Spectrometry Data. Anal Chem. 2014;86:6563–6571. doi: 10.1021/ac5010794. [DOI] [PMC free article] [PubMed] [Google Scholar]
- 18.Goodwin CR, Covington BC, Derewacz DK, McNees RC, Wikswo JP, McLean JA, Bachmann BO. Structuring Microbial Metabolic Responses to Multiplexed Stimuli via Self-Organizing Metabolomics Maps. Chem Biol. 2015;22:661–670. doi: 10.1016/j.chembiol.2015.03.020. [DOI] [PMC free article] [PubMed] [Google Scholar]
- 19.Du Y, Derewacz DK, Deguire SM, Teske J, Ravel J, Sulikowski GA, Bachmann BO. Biosynthesis of the apoptolidins in Nocardiopsis sp FU 40. Tetrahedron. 2011;67:6568–6575. doi: 10.1016/j.tet.2011.05.106. [DOI] [PMC free article] [PubMed] [Google Scholar]
- 20.Shindo K, Kamishohara M, Odagawa A, Matsuoka M, Kawai H. Vicenistatin, a Novel 20-Membered Macrocyclic Lactam Antitumor Antibiotic. J Antibiot. 1993;46:1076–1081. doi: 10.7164/antibiotics.46.1076. [DOI] [PubMed] [Google Scholar]
- 21.Futamura Y, Sawa R, Umezawa Y, Igarashi M, Nakamura H, Hasegawa K, Yarnasaki M, Tashiro E, Takahashi Y, Akarnatsu Y, Imoto M. Discovery of incednine as a potent modulator of the anti-apoptotic function of Bcl-xL from microbial origin. J Am Chem Soc. 2008;130:1822–+. doi: 10.1021/ja710124p. [DOI] [PubMed] [Google Scholar]
- 22.Turnbaugh PJ, Ley RE, Hamady M, Fraser-Liggett CM, Knight R, Gordon JI. The Human Microbiome Project. Nature. 2007;449:804–810. doi: 10.1038/nature06244. [DOI] [PMC free article] [PubMed] [Google Scholar]
- 23.Eichler GS, Huang S, Ingber DE. Gene Expression Dynamics Inspector (GEDI): for integrative analysis of expression profiles. Bioinformatics. 2003;19:2321–2322. doi: 10.1093/bioinformatics/btg307. [DOI] [PubMed] [Google Scholar]
- 24.Giessen TW, Franke KB, Knappe TA, Kraas FI, Bosello M, Xie X, Linne U, Marahiel MA. Isolation, Structure Elucidation, and Biosynthesis of an Unusual Hydroxamic Acid Ester-Containing Siderophore from Actinosynnema mirum. J Nat Prod. 2012;75:905–914. doi: 10.1021/np300046k. [DOI] [PubMed] [Google Scholar]
- 25.Plaza A, Viehrig K, Garcia R, Müller R. Jahnellamides, α-keto-β-methionine-containing peptides from the terrestrial myxobacterium Jahnella sp.: structure and biosynthesis. Org Lett. 2013;15:5882–5885. doi: 10.1021/ol402967y. [DOI] [PubMed] [Google Scholar]
- 26.Medema MH, Blin K, Cimermancic P. antiSMASH: rapid identification, annotation and analysis of secondary metabolite biosynthesis gene clusters in bacterial and fungal genome sequences. Nuc Acids Res. 2011;39:339–346. doi: 10.1093/nar/gkr466. [DOI] [PMC free article] [PubMed] [Google Scholar]
- 27.Shinohara Y, Kudo F, Eguchit T. A Natural Protecting Group Strategy To Carry an Amino Acid Starter Unit in the Biosynthesis of Macrolactam Polyketide Antibiotics. J Am Chem Soc. 2011;133:18134–18137. doi: 10.1021/ja208927r. [DOI] [PubMed] [Google Scholar]
- 28.Caffrey P. Conserved amino acid residues correlating with ketoreductase stereospecificity in modular polyketicle synthases. Chembiochem. 2003;4:654–657. doi: 10.1002/cbic.200300581. [DOI] [PubMed] [Google Scholar]
- 29.Kwan DH, Sun YH, Schulz F, Hong H, Popovic B, Sim-Stark JCC, Haydock SF, Leadlay PF. Prediction and Manipulation of the Stereochemistry of Enoylreduction in Modular Polyketide Synthases. Chem Biol. 2008;15:1231–1240. doi: 10.1016/j.chembiol.2008.09.012. [DOI] [PubMed] [Google Scholar]
- 30.Takaishi M, Kudo F, Eguchi T. Biosynthetic pathway of 24-membered macrolactam glycoside incednine. Tetrahedron. 2008;64:6651–6656. [Google Scholar]
- 31.Ogasawara Y, Katayama K, Minami A, Otsuka M, Eguchi T, Kakinuma K. Cloning, sequencing, and functional analysis of the biosynthetic gene cluster of macrolactam antibiotic vicenistatin in Streptomyces halstedii. Chem Biol. 2004;11:79–86. doi: 10.1016/j.chembiol.2003.12.010. [DOI] [PubMed] [Google Scholar]
- 32.Raju R, Piggott AM, Conte MM, Capon RJ. Heronamides A–C, new polyketide macrolactams from an Australian marine-derived Streptomyces sp A biosynthetic case for synchronized tandem electrocyclization. Org Biomol Chem. 2010;8:4682–4689. doi: 10.1039/c0ob00267d. [DOI] [PubMed] [Google Scholar]
- 33.Jorgensen H, Degnes KF, Sletta H, Fjaervik E, Dikiy A, Herfindal L, Bruheim P, Klinkenberg G, Bredholt H, Nygard G, Doskeland SO, Ellingsen TE, Zotchev SB. Biosynthesis of Macrolactam BE-14106 Involves Two Distinct PKS Systems and Amino Acid Processing Enzymes for Generation of the Aminoacyl Starter Unit. Chem Biol. 2009;16:1109–1121. doi: 10.1016/j.chembiol.2009.09.014. [DOI] [PubMed] [Google Scholar]
- 34.Beaudry CM, Malerich JP, Trauner D. Biosynthetic and biomimetic electrocyclizations. Chem Rev. 2005;105:4757–4778. doi: 10.1021/cr0406110. [DOI] [PubMed] [Google Scholar]
- 35.Shigemori H, Bae MA, Yazawa K, Sasaki T, Kobayashi J. Alteramide-a, a New Tetracyclic Alkaloid from a Bacterium-Alteromonas Sp Associated with the Marine Sponge Halichondria-Okadai. J Org Chem. 1992;57:4317–4320. [Google Scholar]
- 36.Beaudry CM, Trauner D. Synthetic studies toward SNF4435 C and SNF4435 D. Org Lett. 2002;4:2221–2224. doi: 10.1021/ol026069o. [DOI] [PubMed] [Google Scholar]
- 37.Kurosawa K, Takahashi K, Tsuda E. SNF4435C and D, novel immunosuppressants produced by a strain of Streptomyces spectabilis - I. Taxonomy, fermentation, isolation and biological activities. J Antibiot. 2001;54:541–547. doi: 10.7164/antibiotics.54.541. [DOI] [PubMed] [Google Scholar]
- 38.Metzker ML. Applications of Next-Generation Sequencing Sequencing Technologies - the Next Generation. Nat Rev Genet. 2010;11:31–46. doi: 10.1038/nrg2626. [DOI] [PubMed] [Google Scholar]
- 39.Shendure J, Ji HL. Next-generation DNA sequencing. Nat Biotechnol. 2008;26:1135–1145. doi: 10.1038/nbt1486. [DOI] [PubMed] [Google Scholar]
- 40.Kallifidas D, Brady SF. Reassembly of functionally intact environmental DNA-derived biosynthetic gene clusters. Methods Enzymol. 2012;517:225–239. doi: 10.1016/B978-0-12-404634-4.00011-5. [DOI] [PMC free article] [PubMed] [Google Scholar]
- 41.Shao Z, Zhao H. DNA assembler: a synthetic biology tool for characterizing and engineering natural product gene clusters. Methods Enzymol. 2012;517:203–224. doi: 10.1016/B978-0-12-404634-4.00010-3. [DOI] [PMC free article] [PubMed] [Google Scholar]
- 42.Yaegashi J, Oakley BR, Wang CC. Recent advances in genome mining of secondary metabolite biosynthetic gene clusters and the development of heterologous expression systems in Aspergillus nidulans. J Ind Microbiol Biotechnol. 2014;41:433–442. doi: 10.1007/s10295-013-1386-z. [DOI] [PMC free article] [PubMed] [Google Scholar]
- 43.Watrous J, Roach P, Alexandrov T, Heath BS, Yang JY, Kersten RD, van der Voort M, Pogliano K, Gross H, Raaijmakers JM, Moore BS, Laskin J, Bandeira N, Dorrestein PC. Mass spectral molecular networking of living microbial colonies. Proc Natl Acad Sci USA. 2012;109:E1743–E1752. doi: 10.1073/pnas.1203689109. [DOI] [PMC free article] [PubMed] [Google Scholar]
- 44.Yang JY, Sanchez LM, Rath CM, Liu XT, Boudreau PD, Bruns N, Glukhov E, Wodtke A, de Felicio R, Fenner A, Wong WR, Linington RG, Zhang LX, Debonsi HM, Gerwick WH, Dorrestein PC. Molecular Networking as a Dereplication Strategy. J Nat Prod. 2013;76:1686–1699. doi: 10.1021/np400413s. [DOI] [PMC free article] [PubMed] [Google Scholar]
- 45.Kersten RD, Yang YL, Xu YQ, Cimermancic P, Nam SJ, Fenical W, Fischbach MA, Moore BS, Dorrestein PC. A mass spectrometry-guided genome mining approach for natural product peptidogenomics. Nat Chem Biol. 2011;7:794–802. doi: 10.1038/nchembio.684. [DOI] [PMC free article] [PubMed] [Google Scholar]
- 46.Mohimani H, Kersten RD, Liu WT, Wang MX, Purvine SO, Wu S, Brewer HM, Pasa-Tolic L, Bandeira N, Moore BS, Pevzner PA, Dorrestein PC. Automated Genome Mining of Ribosomal Peptide Natural Products. Acs Chem Biol. 2014;9:1545–1551. doi: 10.1021/cb500199h. [DOI] [PMC free article] [PubMed] [Google Scholar]
- 47.Liu WT, Lamsa A, Wong WR, Boudreau PD, Kersten R, Peng Y, Moree WJ, Duggan BM, Moore BS, Gerwick WH, Linington RG, Pogliano K, Dorrestein PC. MS/MS-based networking and peptidogenomics guided genome mining revealed the stenothricin gene cluster in Streptomyces roseosporus. J Antibiot. 2014;67:99–104. doi: 10.1038/ja.2013.99. [DOI] [PMC free article] [PubMed] [Google Scholar]
- 48.VerBerkmoes NC, Denef VJ, Hettich RL, Banfield JF. SYSTEMS BIOLOGY Functional analysis of natural microbial consortia using community proteomics. Nat Rev Microbiol. 2009;7:196–205. doi: 10.1038/nrmicro2080. [DOI] [PubMed] [Google Scholar]
- 49.Nicholson JK, Lindon JC. Systems biology - Metabonomics. Nature. 2008;455:1054–1056. doi: 10.1038/4551054a. [DOI] [PubMed] [Google Scholar]
- 50.Nicholson JK, Holmes E, Kinross JM, Darzi AW, Takats Z, Lindon JC. Metabolic phenotyping in clinical and surgical environments. Nature. 2012;491:384–392. doi: 10.1038/nature11708. [DOI] [PubMed] [Google Scholar]
Associated Data
This section collects any data citations, data availability statements, or supplementary materials included in this article.