

Abstract
In humans, cognitively demanding tasks of many types recruit common frontoparietal brain areas. Pervasive activation of this “multiple-demand” (MD) network suggests a core function in supporting goal-oriented behavior. A similar network might therefore be predicted in nonhuman primates that readily perform similar tasks after training. However, an MD network in nonhuman primates has not been described. Single-cell recordings from macaque frontal and parietal cortex show some similar properties to human MD fMRI responses (e.g., adaptive coding of task-relevant information). Invasive recordings, however, come from limited prespecified locations, so they do not delineate a macaque homolog of the MD system and their positioning could benefit from knowledge of where MD foci lie. Challenges of scanning behaving animals mean that few macaque fMRI studies specifically contrast levels of cognitive demand, so we sought to identify a macaque counterpart to the human MD system using fMRI connectivity in 35 rhesus macaques. Putative macaque MD regions, mapped from frontoparietal MD regions defined in humans, were found to be functionally connected under anesthesia. To further refine these regions, an iterative process was used to maximize their connectivity cross-validated across animals. Finally, whole-brain connectivity analyses identified voxels that were robustly connected to MD regions, revealing seven clusters across frontoparietal and insular cortex comparable to human MD regions and one unexpected cluster in the lateral fissure. The proposed macaque MD regions can be used to guide future electrophysiological investigation of MD neural coding and in task-based fMRI to test predictions of similar functional properties to human MD cortex.
SIGNIFICANCE STATEMENT In humans, a frontoparietal “multiple-demand” (MD) brain network is recruited during a wide range of cognitively demanding tasks. Because this suggests a fundamental function, one might expect a similar network to exist in nonhuman primates, but this remains controversial. Here, we sought to identify a macaque counterpart to the human MD system using fMRI connectivity. Putative macaque MD regions were functionally connected under anesthesia and were further refined by iterative optimization. The result is a network including lateral frontal, dorsomedial frontal, and insular and inferior parietal regions closely similar to the human counterpart. The proposed macaque MD regions can be useful in guiding electrophysiological recordings or in task-based fMRI to test predictions of similar functional properties to human MD cortex.
Keywords: connectivity, fMRI, frontoparietal, macaque, multiple demand, resting state
Introduction
In humans, the fundamental importance of a “multiple-demand” (MD) frontoparietal brain network is suggested by near-ubiquitous recruitment during diverse cognitive demands (Duncan and Owen, 2000; Duncan, 2010; Fedorenko et al., 2013) and by associations with fluid intelligence (Duncan et al., 2000; Lee et al., 2006; Woolgar et al., 2010). Possible cognitive roles of the network include constructing and dismantling current goal representations (Dumontheil et al., 2011; Farooqui et al., 2012; Cole et al., 2013), flexibly representing behaviorally important information (Li et al., 2007; Thompson and Duncan, 2009; Woolgar et al., 2011; Ester et al., 2015), detecting salient events (Beck et al., 2001; Marois et al., 2004; Hon et al., 2006; Finoia et al., 2015), and switching attention (Cusack et al., 2010; Greenberg et al., 2010). Although subparts of this network are expected to perform different computations and fractionation into subnetworks has been proposed (Dosenbach et al., 2007), MD regions typically coactivate during fMRI and have strong relations to “task-positive” resting-state networks (Fox et al., 2005).
Pervasive human MD activation during demanding tasks suggests a core role in supporting goal-oriented behavior (Duncan, 2010). One might therefore expect a similar network to exist in nonhuman primates that readily perform similar tasks after training. Many human–macaque homologies in brain function and connectivity profiles have been reported across frontoparietal association cortex (Orban et al., 2004; Denys et al., 2004; Margulies et al., 2009; Mantini et al., 2011; Mars et al., 2011; Hutchison et al., 2012a; Mantini et al., 2012; Mantini et al., 2013; Mars et al., 2013; Sallet et al., 2013; Miranda-Dominguez et al., 2014; Neubert et al., 2014; Hutchison et al., 2015; Neubert et al., 2015). However, a macaque counterpart of the MD network has not yet been described. Recent studies suggest that some human frontoparietal networks may not have spatial correspondents in the monkey whether based on responses to similar task events (Orban et al., 2004; Patel et al., 2015) or comparison of resting-state networks (Mars et al., 2011; Mantini et al., 2013).Therefore, the existence and structure of macaque MD regions remain open questions. Although single-cell recordings from macaque frontal and parietal cortex show some similarities to human fMRI MD responses, including adaptive coding of various task components (Watanabe, 1990; Sakagami and Niki, 1994; Toth and Assad, 2002; Freedman and Assad, 2006; Duncan, 2010; Roy et al., 2010; Mante et al., 2013; Stokes et al., 2013), they necessarily come from a few prespecified locations, so could greatly benefit from knowledge of where MD foci are likely to lie.
The MD system is typically defined in humans by contrasting fMRI responses across pairs of closely matched task conditions that differ only in their level of some specific cognitive demand. In any given task, this contrast will be confounded with idiosyncratic aspects of the task or stimuli, so the generality of the response is demonstrated by meta-analyses or conjunctions that show similar effects of cognitive demand across widely varying contexts, the specific demands of which might include response conflict, perceptual difficulty, working memory load, etc. (Duncan and Owen, 2000; Fedorenko et al., 2013). Unfortunately, practical constraints make this challenging in the monkey, but an alternative is suggested by coactivation of human MD regions during rest (Fox et al., 2005; Dosenbach et al., 2007; Seeley et al., 2007; Power et al., 2011). We therefore sought to identify a macaque counterpart to the human MD system using fMRI connectivity while monkeys were lightly anesthetized, based initially on standard anatomical comparative mapping. We show that a first approximation of macaque MD regions is indeed functionally connected during anesthesia. We then refined these foci using an iterative approach to find the voxels local to each region that are most connected to the rest of the network. Finally, we tested the connectivity of these optimized regions on data withheld from the optimization step (using leave-one-out cross-validation) and describe their brain-wide connectivity.
Materials and Methods
Animals.
Thirty-five (28 male) healthy Rhesus macaques (Macaca mulatta) were scanned under light anesthesia using a published protocol (Mars et al., 2011; Sallet et al., 2011). Animals weighed 4.4–13.3 kg (mean, 8.2) and were 3.3–7.9 years of age (mean, 5.3). They were housed socially in same-sex pairs or small groups, with a 12 h light/dark cycle (lights on 0700–1900 h) and had scheduled access to water between 12 and 16 h on testing days and at all times otherwise. All experimental procedures were performed in compliance with the United Kingdom Animals (Scientific Procedures) Act of 1986. A Home Office (UK) Project License, obtained after review by the University of Oxford Animal Care and Ethical Review Committee, licensed all procedures. The housing and husbandry were in compliance with the guidelines of the European Directive (2010/63/EU) for the care and use of laboratory animals. fMRI data from subsets of these animals have contributed to previous publications (Mars et al., 2011; Sallet et al., 2011; Mars et al., 2012; Mars et al., 2013; O'Reilly et al., 2013; Sallet et al., 2013; Neubert et al., 2014; Noonan et al., 2014; Neubert et al., 2015).
Data acquisition.
Data were acquired on a 3 T MRI scanner with a full-sized horizontal bore using a four-channel phased array coil (H. Kolster; Windmiller Kolster Scientific) and a local transmission coil. The anesthetized monkeys were scanned in sphinx position in an MRI-compatible stereotactic frame (Crist Instrument). A total of 872–1600 (mean, 1539) volumes of echoplanar imaging were acquired per animal, with 36 axial slices, in-plane resolution 2 × 2 mm, slice thickness 2 mm, no slice gap, repetition time = 2 s, and echo time = 19 ms. T1-weighted structurals were acquired in the same sessions at 0.5 mm resolution using a magnetization-prepared rapid gradient-echo sequence (128 slices, resolution 0.5 × 0.5 × 0.5 mm, slice thickness 2 mm, no slice gap, repetition time = 2.5 s, and echo time = 4.01 ms).
Monkeys were initially sedated 1.5–2 h before commencing the resting-state fMRI scans, using an intramuscular injection of ketamine (10 mg/kg) combined with either xylazine (0.125–0.25 mg/kg) or midazolam (0.1 mg/kg) and buprenorphine (0.01 mg/kg). Once sedated, monkeys were given atropine (0.05 mg/kg, i.v.) to reduce secretions, a nonsteroidal anti-inflammatory drug (meloxicam, 0.2 mg/ kg, i.v.) for analgesia, and an H2 receptor antagonist (ranitidine, 0.05 mg/kg, i.v.) to protect against gastric ulceration as a side effect of nonsteroidal anti-inflammatory drug treatment. Local anesthetic (5% lidocaine/prilocaine cream and 2.5% bupivacaine subcutaneous) was injected around the ears to block peripheral nerve stimulation at least 15 min before positioning the macaque's head in the stereotaxic frame. An intravenous cannula was used for delivery of fluids (warmed sterile saline drip, 5 ml/h/kg) throughout the scan. Monkeys were intubated, ventilated with intermittent positive pressure to ensure a constant respiration rate during the functional scan, and placed on isoflurane (n = 33) or sevoflurane (n = 2) anesthesia. The lowest possible concentration of isoflurane/sevoflurane gas (mixed with medical oxygen) was used to maintain anesthesia, in accordance with veterinary instructions. The inspired isoflurane concentration was in the range of 0.8–2.0% (mean, 1.53%). The expired isoflurane concentration was in the range of 0.8–1.8% (mean, 1.41%). Under these conditions, resting-state networks are reliably observed (Vincent et al., 2007; Mars et al., 2011; Sallet et al., 2013; Hutchison et al., 2014). Two animals received sevoflurane instead of isoflurane at inspired concentrations of 2.1% and 2.5% and expired concentrations of 2.0% and 2.4%. Normal body temperature was maintained throughout the scan using blankets, bubble wrap, and heated wheat bags. Respiration rate, inspired and expired CO2, and inspired and expired isoflurane/sevoflurane concentration were monitored and recorded using VitalMonitor software (Vetronic Services). Heart rate, blood pressure, and core temperature were also monitored throughout the scan and clinical checks assessed muscle relaxation before scanning.
Preprocessing.
Analysis used MATLAB (The MathWorks), SPM8 (Statistical Parametric Mapping; www.fil.ion.ucl.ac.uk/spm), FSL (FMRIB Software Library; http://fsl.fmrib.ox.ac.uk/fsl/fslwiki/), Caret (Computerized Anatomical Reconstruction Toolkit; Van Essen, 2012; http://brainvis.wustl.edu), and automatic analysis software (Cusack et al., 2014; www.automaticanalysis.org). The structural volume was spatially normalized to the 112RM-SL template (112 rhesus macaque template in the space of the atlas of Saleem and Logothetis, 2007) and segmented into gray matter, white matter, and CSF tissue classes (McLaren et al., 2009). The first six functional volumes were discarded to allow the signal to reach equilibrium. The remainder were used to estimate movement parameters and then registered to the structural, warped to template space using the previously calculated transformation, and spatially smoothed within each maximum-likelihood tissue compartment using a Gaussian kernel with 3 mm full-width-half-maximum. A gray-matter mask was defined per subject, as voxels with gray-matter probability >0.9. More conservative white-matter and CSF tissue masks were defined per subject as voxels with tissue probability that exceeded 0.9 in that animal and in 90% of other animals. A further single mask was drawn by hand around the posterior superior sagittal sinus in template space.
Overview of analysis strategy.
Identification of putative macaque multiple demand regions proceeded in four main stages, indicated by vertical arrows in Figure 1. First, established human frontoparietal MD regions were mapped to the macaque brain using a previously published transformation. Second, these were expanded to cover local anatomically defined regions. Third, the originally warped regions were iteratively optimized to find the best-connected voxels within each expanded anatomical region. Finally, whole-brain connectivity maps from the optimized regions were combined, thresholded, and parcellated. We describe these steps in more detail below.
Figure 1.
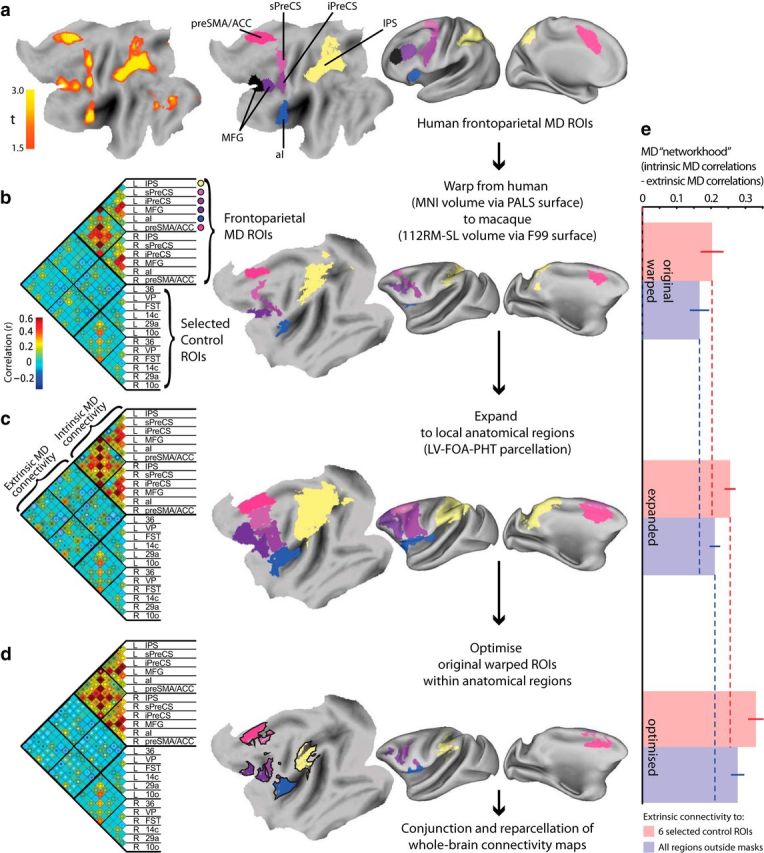
Putative macaque MD ROIs and their intrinsic connectivity at each stage of definition. a, Left, Human fMRI response to various cognitive demands based on data from Fedorenko et al. (2013) shown on the cortical surface. Right, Division into frontoparietal ROIs: preSMA/ACC, anterior insula (aI), IPS, sPreCS, iPreCS, and along the MFG. b, Left, Pairwise time-course correlations between MD ROIs after warping to macaque and a similar number of control regions; dark and light circles indicate correlations significantly greater than or less than zero, respectively (p < 0.05, FDR corrected). Right, Warped ROIs illustrated on the F99 cortical surface. c, As in b, but after expanding ROIs to local anatomical boundaries. d, As in b and c, but after iteratively optimizing ROIs to maximize connectivity within expanded regions (tested on left-out data); ROIs are colored where they overlap in all cross-validation folds, whereas black borders show locations present in some cross-validation folds. Dark and light dots in b and c indicate connections with strength that has significantly increased or decreased, respectively, relative to the preceding ROI definition (warped − expanded − optimized; p < 0.05, FDR corrected). e, Networkhood of MD ROIs, measured as [mean connectivity between themselves] minus [mean connectivity between MD and control ROIs]. The control ROIs are either the six selected regions illustrated in the correlation matrices of b–d (red) or all atlas regions outside of the expanded anatomical masks (blue). Error bars are 95% confidence intervals for the difference from the test values marked by correspondingly colored dashed lines. Each increase in networkhood is highly significant (p < 0.001).
Human MD ROIs.
Human MD ROIs were based on data from Fedorenko et al. (2013). Group-level t-statistics from contrasts that isolated cognitive demand were averaged across seven tasks. To create a symmetrical volume, data from left and right hemispheres were averaged and then projected back to both hemispheres. To define ROIs around peak locations, the volume was thresholded at t > 1.5 (Fig. 1a, left); if a cluster contained multiple peaks that also survived t > 2.7, then it was subdivided, assigning each voxel to the nearest subregion at the higher threshold. Clusters outside of the frontoparietal cortex were discarded to leave seven bilateral ROIs (Fig. 1a, right) around the presupplementary motor area and anterior cingulate (preSMA/ACC), anterior insula, intraparietal sulcus (IPS), superior and inferior precentral sulcus (sPreCS, iPreCS), and middle and anterior middle frontal gyrus (MFG). Discarded clusters included two in the occipital lobe that were suspected to reflect domain-specific responses to the visual stimuli used (Fedorenko et al., 2013) and which are not associated with fluid intelligence deficits when damaged, unlike the frontoparietal foci (Woolgar et al., 2010). Subcortical clusters were also discarded for the additional practical reason that the human-to-macaque deformation and the macaque anatomical atlas used (see below) are defined on the cortical surface. Importantly, the final analysis tested connectivity from the seed ROIs to every voxel of the brain volume. Therefore, if any nodes of the network had been missed in the initial ROI selection, then they should show up in this analysis).
Warping MD ROIs from human to macaque.
Human MD ROIs were mapped from Montreal Neurological Institute (MNI152) volumetric space to the human Population-Average Landmark and Surface-based (PALS) atlas and then warped to the macaque F99 surface using Caret (Van Essen and Dierker, 2007). The deformation was based on 23 landmark homologies elsewhere in the brain (Denys et al., 2004; Orban et al., 2004). See Miranda-Dominguez et al. (2014) for further validation of this deformation procedure. Regions were then converted to a volume in F99 space using Caret, and warped to 112RM-SL space at 0.5 mm isotropic resolution using SPM8. Regions were dilated by up to 3 mm in any direction within a gray-matter mask derived from the 112RM-SL tissue probability maps. If a region became fragmented, then the largest cluster was retained. After warping to the macaque, the two most anterior regions were small and closely abutting, so were combined into a single region (MFG; Fig. 1b, right). Note that we will continue to name the ROIs by their source in the human brain, although this may not correspond to macaque anatomy.
Macaque anatomical template regions.
Macaque anatomical regions came from the LV-FOA-PHT composite cytoarchitectonic parcellation (Van Essen et al., 2012). The name of the parcellation derives from the initials of the authors of the parcellations on which it was based (Ferry et al., 2000; Lewis and Van Essen, 2000; Paxinos et al., 2000). Ferry et al. used the parcellation from Carmichael and Price (1994). Regions on the right hemisphere cortical surface were first converted to a volume in F99 space using Caret and warped to 112RM-SL space at 0.5 mm isotropic resolution using SPM8. Clusters of six voxels or fewer were removed and regions were dilated by up to six voxels in any direction into empty zones of a gray-matter mask derived from the 112RM-SL tissue probability maps. This ensured comprehensive labeling of gray-matter voxels by expanding from the midsurface ribbon into which the surface had been interpolated and filling in the few small regions that remained unlabeled in the composite parcellation. Finally, regions were reflected to the left hemisphere.
For comparison with MD ROIs, a similar number of control ROIs were selected from the LV-FOA-PHT set to be maximally distant from both the MD regions and from each other. These were areas 10o, 14c, 29a, 36, the floor of the superior temporal area, and the ventral posterior area. Note that no set of control regions could match all characteristics of the MD ROIs and this was not our aim. The purpose of the control ROIs was merely to show that the optimization of MD ROIs (see below) tended to increase their connectivity with each other specifically, rather than their global connectivity with any brain region. We therefore also repeated this analysis using all LV-FOA-PHT regions outside of MD seed regions as a “control.” Because the final analysis uses whole-brain connectivity from the optimized ROIs, it does not depend on the particular choice of control ROIs.
Connectivity analysis.
Physiological confound covariates were constructed by extracting principal components of the time series from white-matter and CSF tissue masks (as many components as required to explain 99% of variance, up to a maximum of 6; mean 1.3 for white-matter and 3.1 for CSF; Behzadi et al., 2007). A further vascular component was defined as the mean time course within the superior sagittal sinus mask. The first temporal derivatives of these time courses were also included. A motion confound covariate was defined as the time course of average displacement over the expected brain volume (approximated as a sphere of radius 40 mm; Jenkinson, 1999). The first temporal derivative of this vector was also included, as well as the element-wise squares of both vectors. Discrete cosine transform covariates were added to implement a temporal band-pass filter (0.0025–0.05 Hz) as commonly used (Vincent et al., 2007; Mantini et al., 2011). After projecting covariates from each gray-matter time series, functional connectivity was estimated as bivariate correlations between the mean gray-matter time series from each pair of ROIs and between these ROI time series and each voxel in the brain. Group statistics on correlation values used one-sample t tests after Fisher r-to-z transformation. p-values were thresholded to control the false discovery rate (FDR) at <0.05 (Genovese et al., 2002).
Iterative optimization.
To refine MD ROIs, we used an iterative approach to find the voxels in the vicinity of each region that were most connected to the rest of the network. First, local anatomical masks were defined around each candidate ROI within which the precise location of the ROI would be optimized (Fig. 1c, right). These expanded masks included any LV-FOA-PHT anatomical regions overlapping an ROI (such that the volume of intersection with the ROI was >1% of the volume of their union).
To avoid overfitting and ensure generalization across the N = 35 animals, a leave-one-animal-out cross-validation scheme was adopted. The following steps were thus performed on each set of N − 1 animals. At each iteration step, each ROI was redefined as all voxels within its local anatomical mask for which the mean correlation with other MD ROIs was significantly higher than a local baseline, defined as the mean correlation between other MD ROIs and the voxels immediately bordering the mask. (Using a local baseline per region allowed the optimization to select peaks of connectivity that were especially strong within each region even if they were weaker than peaks in other regions that had globally higher correlations, e.g., due to higher signal-to-noise or closer proximity to other MD ROIs.) Significance of higher-than-baseline correlation was assessed using one-sample t tests across the N − 1 animals. After adjusting each ROI in this way, the process was iterated until the ROIs no longer changed (Fig. 1d, right). Connectivity of the iteratively optimized ROIs was then tested using independent data from the left-out animal. Finally, group statistics were calculated across these 35 sets of cross-validated connectivity measures.
The labels of the six MD ROIs were preserved across this optimization process. However, this partition of the optimized ROIs was not necessarily expected to be anatomically meaningful. The labels were initially retained for the purposes of comparing connectivity across initial and optimized ROIs and for visualizing the result of the optimization process. In subsequent whole-brain connectivity analyses (see below), the initial labels were abandoned and new spatial clusters were derived from the set of voxels delivered by the optimization step.
Combining, thresholding, and partitioning whole-brain connectivity maps.
Original MD ROIs had been constrained to frontoparietal cortex and their subsequent optimization had been constrained within local anatomical zones. We ultimately wished, however, to identify loci anywhere in the brain that were functionally connected to this network. Whole-brain connectivity maps from each optimized ROI were therefore created for each animal using seed ROIs optimized on independent data from the other animals. Connectivity maps were then averaged across animals and positive correlations tested via one-sample t tests.
Statistical maps from the six seed ROIs were combined using the Simes method for dependent data and thresholded at an FDR of 0.025 (Heller et al., 2007) to produce a map showing the number of MD ROIs with which each voxel was significantly positively correlated. This conjunction map was largely symmetrical, so data from left and right hemispheres were averaged and then projected back to both hemispheres. The resultant volume was then thresholded and partitioned (similarly to the original human MD conjunction of cognitive demand activations) to identify locally contiguous clusters of voxels that were significantly connected to at least five of the six MD ROIs. If a connected cluster contained multiple local maxima of mean connectivity, then it was subdivided, assigning each voxel to the nearest local maximum. Clusters were discarded if they did not contain any voxels significantly connected to all six MD ROIs (two very small clusters of two and eight voxels), leaving eight bilateral clusters.
Comparison with previously reported anatomical projections.
We matched all regions in the LV-FOA-PHT parcellation to brain sites in the CoCoMac (collation of connectivity data on the macaque brain) database (http://cocomac.g-node.org; Stephan et al., 2001; Bakker et al., 2012; Bezgin et al., 2012). We then queried CoCoMac 2.0 using default options plus the S.O.R.T algorithm (Bezgin et al., 2008) to generate a list of axonal projections between these regions and to convert this to a connectivity matrix indicating projections as present (in either direction and regardless of strength), absent, or unknown. We identified the seven atlas regions that had maximum overlap with our final MD functional connectivity clusters, excluding primary auditory cortex, and assessed the proportion of known projections involving these nodes, ignoring self-connections and links for which connectivity was unknown. We also examined projections to a set of posterior parietal regions that overlapped substantially with the parietal MD regions initially warped from humans, but not with the final optimized macaque clusters. These were LV00a-LIPv, LV00a-VIPl, LV00a-VIPm, LV00a-MIP, LV00a-PO, and LV00a-5V.
Results
First approximation of macaque MD regions are functionally connected under anesthesia
We first confirmed that the putative macaque MD ROIs (Fig. 1b, right), deformed from human ROIs (Fig. 1a, right), were functionally connected under anesthesia (Fig. 1b, left). Correlations among these ROIs were consistently positive (grand mean Fisher's z = 0.22; t test across animals: t(34) = 12.6, p = 2.22 × 10⁻¹⁴; 51 of 66 correlations significantly greater than zero: p < 0.05 with FDR correction). Correlations among MD ROIs were also significantly higher than correlations among control ROIs (grand mean Fisher's z = 0.048; paired t test across animals: t(34) = 9.16, p = 1.05 × 10⁻¹⁰) and higher than correlations between MD and control ROIs (grand mean Fisher's z = 0.02; paired t test across animals: t(34) = 12.4, p = 3.62 × 10⁻¹⁴).
Anatomically constrained optimization increases connectivity of MD ROIs
Deformation of human ROIs using landmark homologies elsewhere in the brain (Denys et al., 2004) provided a first approximation of potential macaque MD regions. It is not expected to be perfect, especially in association cortex, which tends to be far from the landmarks and has undergone the largest evolutionary expansion (Hutchison et al., 2012a). To refine these ROIs, we therefore iteratively adjusted the size/location of each MD ROI to maximize connectivity to other MD ROIs. Optimized ROIs were constrained to lie within local anatomical zones (Fig. 1c, right) expanded from the original ROIs to the borders of any anatomical regions that they touched. To ensure that higher connectivity of the optimized ROIs generalized to independent data, a leave-one-out cross-validation approach was adopted, with optimization performed using N − 1 animals and connectivity of the resultant ROIs measured in data from the left-out animal. Because each cross-validation fold used highly overlapping sets of animals, the final ROIs tended to be very similar across folds (Fig. 1d, right). (The initial ROI labels are not necessarily anatomically meaningful after optimization. We retain them temporarily to visualize and test the effect of optimization, but new spatial clusters will later be derived using whole-brain connectivity.)
After optimization, 55 of 66 intra-MD connections increased significantly (each p < 0.05, FDR corrected) and none decreased significantly. To confirm that the optimized ROIs became better connected specifically with each other, rather than showing globally higher correlations with any region, the “networkhood” of the putative macaque MD ROIs was quantified as the mean connectivity among themselves relative to their connectivity with control regions (Fig. 1e). This measure of networkhood, tested on left-out data, increased significantly after optimization [paired t test across animals: t(34) = 14.8, p = 2.26 × 10⁻¹⁶ using six selected control regions (red bars); t(34) = 14.7, p = 2.64 × 10⁻¹⁶ using all regions outside of the expanded local zones as control regions (blue bars)]. This indicates that the refined regions indeed formed a more tightly integrated network that generalized across animals compared with the initial approximation. Whereas the IPS and sPreCS ROIs shrunk during the optimization, the other ROIs became larger. Larger regions might have stronger connectivity because of increased signal-to-noise from averaging more voxels, so one might worry that the optimization procedure could have enlarged the ROIs in a nonselective manner, rather than focusing them on the true underlying most-connected network. We therefore assessed the networkhood of the entire expanded anatomical zones within which the MD ROIs were optimized (Fig. 1c). These expanded regions were significantly more connected then the original ROIs [paired t test across animals: t(34) = 6.75, p = 9.35 × 10⁻⁸ using six selected control regions (red bars); t(34) = 5.96, p = 9.62 × 10⁻⁷ using all regions outside the expanded local zones as control regions (blue bars)], but significantly less connected than the optimized ROIs [paired t test across animals: t(34) = −6.79, p = 8.30 × 10⁻⁸ using six selected control regions (red bars); t(34) = 6.90, p = 5.96 × 10⁻⁸ using all regions outside the expanded local zones as control regions (blue bars)]. This suggests that the optimized ROIs indeed converged on especially well connected subregions, rather than expanding indiscriminately.
Whole-brain analysis of regions connected to MD network
We next assessed the connectivity maps from the optimized macaque MD candidates to all voxels in the brain to investigate whether they showed consistent connectivity with any other regions in addition to themselves. For example, although we had focused a priori on frontoparietal ROIs, in humans these foci often coactivate with lateral occipital cortex both during visual tasks (Fedorenko et al., 2013) and at rest (Power et al., 2011). Furthermore, in the macaque, it is unknown whether an MD-like network might contain more or fewer foci than are observed in humans. Again, connectivity maps for each animal were calculated using seed ROIs optimized using independent data from the other animals. Connectivity maps were then averaged across animals. Figure 2a illustrates voxelwise connectivity maps for each ROI. In addition to locally high correlations near each seed ROI, substantial similarity between the connectivity maps is apparent, as would be expected if the ROIs form part of a connected network. The overall network structure is summarized in Figure 2b, which uses a conjunction test to assess the number of MD ROIs that are significantly connected to each voxel (generalized Simes method for combining dependent p-values; Heller et al., 2007; FDR < 0.025). To derive a final definition of putative monkey MD clusters, this whole-brain conjunction map was thresholded and divided into spatially contiguous clusters in a manner similar to the partitioning of the original human MD conjunction of cognitive demand activations (see Materials and Methods). This identified eight local clusters (Fig. 2c). (Although each cluster was spatially contiguous in volumetric space, sulcal clusters could appear split across opposing banks of the sulcus when rendered onto a cortical surface.)
Figure 2.
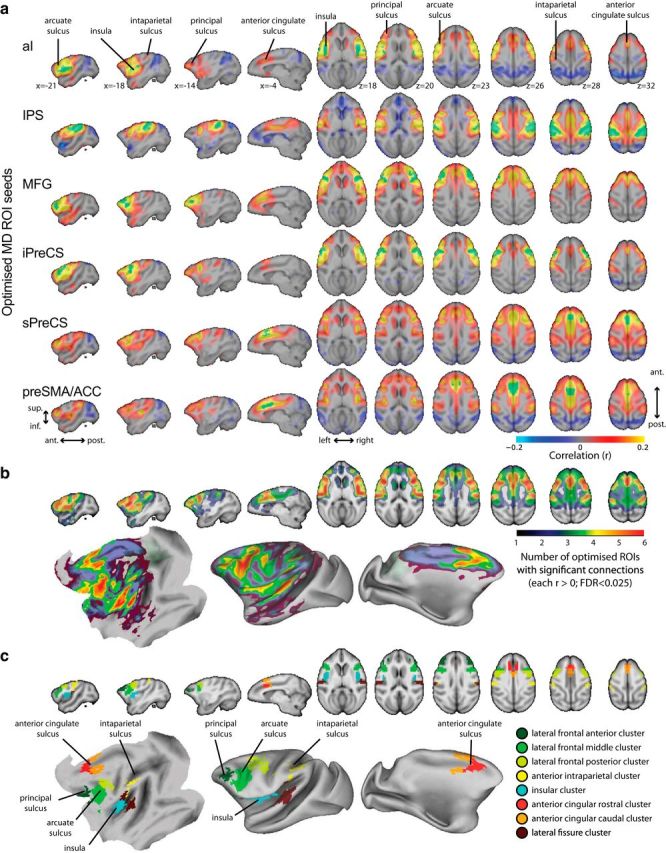
Voxelwise connectivity from optimized macaque MD ROIs. a, Correlation between time courses from each optimized ROI (labeled on the left and overlaid in green) and each voxel in the brain. Correlations are only shown where significant at p < 0.025 per tail with FDR correction and are overlaid on the 112RM-SL volume. b, Lower bound on number of ROIs significantly positively correlated with each voxel overlaid on the 112RM-SL volume and rendered on the F99 left cortical surface. c, Parcellation of b into significantly well connected clusters around local peaks of mean connectivity.
Figure 3 enlarges the flat map from Figure 2c to show the final MD clusters overlaid with anatomical regions from the LV-FOA-PHT composite cytoarchitectonic parcellation (Van Essen et al., 2012). Table 1 lists the clusters and the anatomical regions with which they have the greatest overlap.
Figure 3.

The final MD clusters from Figure 2c enlarged and overlaid with anatomical regions from the LV-FOA-PHT composite cytoarchitectonic parcellation (Van Essen et al., 2012).
Table 1.
Description of regions with significant connectivity to five or more optimized MD ROIs, clustered by local peaks of mean connectivity as shown in Figure 2c and Figure 3
| Location of cluster | Local maximum in mean connectivity map [±x; y; z] 112RM-SL space | Label and description of main overlapping anatomical regions from LV-FOA-PHT composite parcellation (Van Essen et al., 2012) | Fraction of anatomical region overlapping cluster | Fraction of cluster overlapping anatomical region | Median correlation of anatomical region with ROIs | |
|---|---|---|---|---|---|---|
| Lateral frontal, anterior | [15; 36; 22] | 46v | Area 46 (ventral); dorsolateral prefrontal cortex, around principal sulcus | 0.29 | 0.58 | 0.15 |
| 46p | Area 46 (posterior); encompassing 8Ar, 46dr & 46vr | 0.15 | 0.30 | 0.11 | ||
| Lateral frontal, middle | [21; 26; 20] | 6Vam | Area 6Va (medial); overlapping lateral frontal eye fields (FEF) of Schall et al. (1995) | 0.76 | 0.20 | 0.26 |
| 6Vala | Area 6Va (lateral) | 0.48 | 0.28 | 0.28 | ||
| 45 | Area 45; overlapping lateral FEF of Schall et al. (1995) | 0.43 | 0.08 | 0.24 | ||
| 12 | Subdivision of Area 12, at inferior end of arcuate sulcus | 0.26 | 0.05 | 0.15 | ||
| Lateral frontal, posterior | [19; 24; 26] | 4Ca | Premotor region around arcuate spur | 0.46 | 0.31 | 0.19 |
| 6Ds | Division of area 6D; dorsal premotor cortex; caudal superior frontal gyrus; supplementary eye field | 0.17 | 0.09 | 0.14 | ||
| 3a | Somatosensory area 3a | 0.13 | 0.10 | 0.04 | ||
| Anterior intraparietal | [25; 10; 26] | 7b | Somatosensory area 7b | 0.30 | 0.28 | 0.18 |
| 7op | Operculator area 7 | 0.17 | 0.14 | 0.15 | ||
| AIP | Anterior intraparietal area | 0.13 | 0.06 | 0.14 | ||
| LIPd | Lateral intraparietal (dorsal) | 0.08 | 0.06 | 0.16 | ||
| Insula | [19; 20; 16] | Ig_Id | Granular and dysgranular insula | 0.57 | 0.49 | 0.20 |
| G | Gustatory cortex (frontal operculum and anterior insula) | 0.31 | 0.07 | 0.30 | ||
| S2a | Second somatosensory area | 0.21 | 0.22 | 0.22 | ||
| Pi | Parainsular area | 0.06 | 0.05 | 0.07 | ||
| Anterior cingulate, rostral | [1; 30; 30] | 24d | Cingulate area 24 subdivision; caudal anterior cingulate sulcus; also encompassing subdivision 24c that is distinguished in other parcellations | 0.311 | 0.43 | 0.19 |
| Anterior cingulate, caudal | [1; 26; 32] | 6Ma | Supplementary motor area; rostromedial part of premotor area 6 | 0.431 | 0.52 | 0.19 |
| 24aba,b | Cingulate area 24 subdivision; caudal anterior cingulate gyrus | 0.281 | 0.16 | 0.21 | ||
| 6DC | Division of area 6D; dorsal premotor cortex; caudal superior frontal gyrus; supplementary eye field | 0.15 | 0.13 | 0.11 | ||
| Lateral fissure | [27; 12; 20] | A1 | Primary auditory cortex | 0.37 | 0.46 | 0.14 |
| Tpt | Temporoparietal area (caudolateral boundary of auditory cortex) | 0.28 | 0.08 | 0.12 | ||
| Ts | Superior temporal cortex | 0.12 | 0.11 | 0.17 | ||
The table lists overlapping anatomical regions from the LV-FOA-PHT parcellation if the volume of overlap covers at least 5% of the anatomical volume and at least 5% of the cluster.
aThese regions have a smaller amount of overlap with another cluster but are grouped with the most overlapping cluster.
bRegion 24ab is not contiguous with the rest of the cluster on the cortical surface, so could alternatively be grouped with the rostral anterior cingulate cluster or described as a separate cluster.
Of the eight clusters, three lie in an anterior–posterior direction along the lateral frontal surface (shades of green in Figs. 2c, 3). The most anterior of these is in the posterior principal sulcus, with a local peak in area 46. A large middle cluster covers the inferior portion of the arcuate sulcus (predominantly area 6Va and overlapping the lateral frontal eye fields). The more posterior cluster is centered on area 4C, including the arcuate spur and spreading onto the precentral and superior frontal gyri.
Another cluster (yellow in Figs. 2c, 3) is in the anterior parietal lobe, having greatest overlap with area 7b, but with some spreading onto the parietal operculum and along the intraparietal sulcus into the anterior intraparietal area and the dorsal lateral intraparietal area (LIPd). This macaque intraparietal cluster is much smaller than the intraparietal MD cluster in humans and occupies a more anterior position. The cluster partially overlaps several parietal anatomical regions, but is not especially well matched to any. It is unclear whether this might be due to methodological factors or if it reflects a genuine functional difference across species, as discussed later. The parietal cluster does encroach on region LIPd, however, where single-cell recordings show adaptive coding of task-relevant information, as expected of MD cortex (Toth and Assad, 2002; Freedman and Assad, 2006).
A further cluster (turquoise in Figs. 2c, 3) lies in the insula. This cluster covers anterior and dorsal insular cortex toward the frontal operculum, as in humans, although the macaque cluster also appears to spread more posteriorly. This corresponds well to anatomical borders, with the final cluster closely matching the anterior–posterior extent of the granular/dysgranular anatomical region.
A pair of medial frontal MD clusters (orange and red in Figs. 2c, 3), in macaques as in humans, include anterior cingulate cortex and supplementary motor areas. Although defined as a single cluster in the human, it divides into rostral and caudal clusters in the macaque, centered on areas 24d and 6M. Division into at least two macaque clusters seems appropriate given their good match to distinct anatomical regions. It should be noted that the rostral cluster covers only the anterior portion of area 24d, which some other parcellations label 24c (Matelli et al., 1991). Although the caudal cluster is continuous in volumetric space, on the cortical surface, it splits onto the banks of the sulcus, including areas 6M and 24ab, but not 24d (or 24c) lying between them in the depth of the sulcus. It is therefore unclear whether 24ab would be better grouped with the more rostral cluster or described as a separate cluster. The medial frontal clusters reported here appear to overlap the supplementary and cingulate motor areas (Paus, 2001; Dum and Strick, 2002) and the “attention-orienting” cingulate subdivision described by Hutchison et al. (2012b).
A final unexpected cluster (maroon in Figs. 2c, 3) lies along the lateral fissure, predominantly overlapping primary auditory cortex (A1), but spreading onto the parietal operculum (including the second somatosensory area, although this is noncontiguous on the cortical surface). Unlike the clusters described above, this region does not form part of the human MD system.
Comparison with previously reported anatomical projections
The CoCoMac database collates macaque axonal tract tracing data from >450 publications (Stephan et al., 2001; Bakker et al., 2012). We queried CoCoMac 2.0 to generate a list of axonal projections between all regions in the LV-FOA-PHT parcellation and to convert this to a connectivity matrix indicating connections as present, absent, or unknown. We identified the seven atlas regions that had maximum overlap with our MD functional connectivity clusters, excluding A1, and assessed the proportion of known projections involving these nodes, ignoring self-connections and links for which connectivity was unknown. Of the MD nodes, only the insula had a known direct connection with A1. Among the MD nodes, 94% of connections were present. This compares to 55% of reported connections between these nodes and all other nodes and 51% of reported connections among all non-MD pairs. We also investigated a set of posterior parietal regions that overlapped substantially with the parietal MD region initially warped from humans, but not with the final optimized macaque clusters. A total of 57% of connections were reported between MD nodes and these posterior parietal nodes.
Comparison with anatomical connectivity thus confirmed that the putative MD clusters are physically very well connected, with the exception of A1. Although MD regions have moderate anatomical connectivity with posterior parietal regions, this is comparable to their average anatomical connectivity with all cortical regions and weaker than their connectivity with 7b and other MD nodes.
Discussion
Starting from a human frontoparietal network recruited by multiple cognitive demands, we identified corresponding, well connected regions in anesthetized macaques consistent with the proposal of a macaque counterpart to the human MD network. Because recent studies suggest evolutionary reorganization of frontoparietal cortex (Mantini et al., 2013; Patel et al., 2015), it is interesting that the broad anatomical regions of human frontoparietal MD cortex (preSMA/ACC, IPS, insula, and multiple lateral prefrontal foci) are also all consistently connected in anesthetized macaques. In addition, apparent interspecies differences in the relative size and location of these connected clusters are noteworthy.
The proposed macaque MD system is compatible with suggestions of evolutionarily novel human frontoparietal networks. Mantini et al. (2013) partitioned human and macaque resting-state networks using independent component analysis and then performed cross-species matching using spatial correlation, leaving three human frontoparietal and cingulate components unmatched. The putative macaque MD network appears to include several human–macaque homologs identified by Mantini et al. (2013) to match human “dorsal attention,” “lateral prefrontal,” and “language” components. The present cingulate, posterior lateral frontal, and anterior intraparietal clusters are not well covered by the macaque resting-state networks selected by Mantini et al. (2013). Other studies suggest a generally well conserved organization of frontal and parietal cortex (Mars et al., 2011; Sallet et al., 2013). In humans, the MD system may be supplemented by either novel frontoparietal networks or stronger connections that might reflect evolutionary expansion of prefrontal and parietal cortex (Van Essen and Dierker, 2007).
The macaque intraparietal cluster was surprisingly small and anterior compared with its human counterpart. In anesthetized macaques, it is not uncommon to observe relatively weak connectivity of posterior intraparietal cortex with many frontal regions (Hutchison and Everling, 2013) or weaker connectivity than expected from human data (Mars et al., 2011). Potentially, posterior parietal cortex may be particularly susceptible to reduced connectivity under anesthesia (Schröter et al., 2012) and resting-state networks spanning prefrontal and posterior intraparietal cortex may be especially apparent in awake animals (Mantini et al., 2013). Alternatively, the absence of posterior intraparietal cortex among proposed MD regions may reflect meaningful interspecies differences in posterior intraparietal function (Orban et al., 2004). Supporting this possibility, sustained attention activates multiple human parietal foci, but a single anterior focus in macaques (Patel et al., 2015). Similarly, interspecies activity correlations of macaque posterior parietal regions (e.g., parietal occipital, medial intraparietal, and posterior intraparietal areas) match human occipital regions better than human parietal regions (Mantini et al., 2012).
Structural connectivity likely constrains covariance between time series, especially at long time scales (Honey et al., 2007), and moderate correlations between structural and functional connectivity have been reported (Miranda-Dominguez et al., 2014). We therefore considered how the present results correspond to anatomical connections, confirming that the putative frontoparietal MD clusters are well connected physically as well as functionally. They are not anatomically well connected to A1, suggesting that the unexpected cluster in the lateral fissure may not belong to the core network. They have only moderate direct projections with more posterior parietal regions, suggesting that the unexpected absence of these regions among the functional connectivity clusters has some anatomical support and may not be merely an effect of anesthesia. Indeed, although human and macaque structural connectomes are broadly similar, parietal regions have relatively large differences in their connectivity patterns (Goulas et al., 2014).
Cortical subdivisions, whether structurally or functionally derived, can be described hierarchically, with regions grouped or split depending on hierarchical level (Modha and Singh, 2010; Hutchison and Everling, 2013). The MD network represents an intermediate level of description that is more specific than the densely connected core that spans task-positive and task-negative regions (Modha and Singh, 2010; Ercsey-Ravasz et al., 2013), yet encompassing many cytoarchitectonically distinct areas (Van Essen et al., 2012) and with finer-grained functional structure evident in humans (Dosenbach et al., 2007) and macaques (Wardak et al., 2010; Mars et al., 2011; Hutchison et al., 2012b; Mantini et al., 2013; Sallet et al., 2013; Neubert et al., 2014). Given the obvious spatial peaks within human MD cortex, we have suggested a similar spatial subdivision of macaque MD cortex. Alternative subdivisions are possible, however, and different levels of description are likely informative in different contexts, such as predicting function or disease.
Whole-brain connectivity of MD ROIs revealed one non-frontoparietal cluster in the lateral fissure overlapping primary auditory cortex. In humans, this region is neither activated by diverse cognitive demands (Fedorenko et al., 2013) nor well connected to executive control networks (Power et al., 2011). Conversely, human ventrolateral occipitotemporal cortex commonly responds to cognitive demand (Fedorenko et al., 2013) and correlates with executive control networks at rest (Power et al., 2011), yet was neither strongly nor consistently connected with macaque MD ROIs. One might speculate that visual stimuli dominate human experiments and visual imagery may occupy human thought at rest, producing coupling between human MD regions and occipitotemporal visual representations. For lightly anesthetized macaques, scanner noise may instead be the dominant stimulus being processed as awareness fluctuates, driving coupling between macaque MD and auditory cortex. One human study reported that sedation partially preserved frontoparietal connectivity of executive control networks, whereas occipitotemporal connectivity from a right hemisphere executive control seed was no longer detected (Boveroux et al., 2010). In macaques, auditory cortex has been found to correlate with lateral and dorsal prefrontal cortex under anesthesia (Hutchison and Everling, 2013), whereas little auditory-with-lateral-prefrontal functional connectivity is observed in awake animals (Mantini et al., 2013).
Given the numerous challenges of fMRI in behaving macaques, few studies specifically contrast levels of cognitive demand. In humans, inhibiting a prepotent response produces typical MD activation. In macaques, antisaccades (away from targets that normally attract gaze) evoke fMRI responses consistent with the proposed MD regions, including the principal, arcuate, anterior cingulate, and intraparietal sulci (Ford et al., 2009). An earlier study investigating response inhibition during a Wisconsin Card Sorting Test also observed activations partially overlapping the current MD clusters, including the inferior arcuate sulcus and insula (Nakahara et al., 2002). Whereas those studies compared conditions differing objectively in difficulty, others observe frontoparietal activation while carefully matching behavioral performance. These implicate frontoparietal regions resembling the current MD clusters in aspects of attentional control: searching for salient targets (Wardak et al., 2010) and covertly shifting attention (Caspari et al., 2015). This matches human frontoparietal involvement in attention switching (Greenberg et al., 2010) and detecting changes to attended items (Beck et al., 2001; Hon et al., 2006; Finoia et al., 2015), which often covary with cognitive demand, but also produce frontoparietal activation when performance is equated (Greenberg et al., 2010) or irrelevant (Hon et al., 2006; for a macaque equivalent, see Stoewer et al., 2010).
Given the restrictions on human tracer studies and the challenges of fMRI in behaving animals, functional connectivity provides an important bridge between human and animal models (Hutchison and Everling, 2012; Mantini et al., 2013; Miranda-Dominguez et al., 2014). Monkeys, unlike humans, are usually anesthetized, restrained, extensively trained, or rewarded. Variability in cognitive state therefore confounds interspecies comparisons and requires better understanding. Despite consensus that functional networks are largely preserved under anesthesia in humans, macaques, and rodents, albeit with weakened connectivity (Vincent et al., 2007; Greicius et al., 2008; Boveroux et al., 2010; Mars et al., 2011; Hutchison et al., 2012a; Liang et al., 2012; Sallet et al., 2013; Miranda-Dominguez et al., 2014), the extent to which arousal has differential effects across the brain or upon short-range versus long-range connections is less certain (Moeller et al., 2009; Boveroux et al., 2010; Liang et al., 2012; Schröter et al., 2012). Similarly, although analyses attempt to control rigorously for physiological confounds, restraints, sedatives, contrast agents, and external ventilation might have residual effects. Finally, differences in the reliability and spatial distribution of the fMRI signal (e.g., from magnetic field inhomogeneities or surface coil positioning) may affect interspecies comparisons.
More fundamentally, human MD regions are defined from contrasts of cognitive demand and, ultimately, we want to understand both human and macaque brain systems in terms of their role in cognition. Comparing MD clusters with available macaque fMRI studies of response inhibition and attention switching informally suggests similar functional properties to their human counterparts. Full validation of the proposed macaque MD network, however, requires fMRI studies that test explicitly these regions' specificity in responding to diverse cognitive demands. The putative macaque MD network is made available for this purpose (http://imaging.mrc-cbu.cam.ac.uk/imaging/MDsystem). Having delineated the MD network, simultaneous electrophysiological recordings from its multiple subregions can investigate coordination of activity at finer temporal scales in the service of goal-directed behavior.
Overall, functional connectivity suggests that a macaque homolog of the human MD system exists, even under anesthesia and despite interspecies differences in frontoparietal expansion (Van Essen and Dierker, 2007), task responses (Patel et al., 2015), and some resting-state networks (Mantini et al., 2013). Beyond advancing primate comparative neuroscience, the putative macaque MD regions can guide electrophysiological recordings or be used in task-based fMRI to test predictions of similar functional properties to human MD cortex. We hope that characterizing the relationship between human and macaque MD systems will enhance the translational potential of nonhuman primate models in understanding human brain function and pathology.
Notes
Supplemental material for this article is available at http://imaging.mrc-cbu.cam.ac.uk/imaging/MDsystem. The putative macacque frontoparietal MD regions, their conjunction connectivity map, and the final connected clusters, are available to download. ROIs are provided after initially warping from humans and after subsequent optimization. Data can be downloaded in the space of the 112RM-SL template and the F99 brain volumes. Files are also provided for visualizing the data on the F99 cortical surface using Caret software (http://brainvis.wustl.edu/). This material has not been peer reviewed.
Footnotes
This work was supported by the Medical Research Council (MRC Intramural Programs MC-A060-5PQ10 and MC-A060-5PQ14 to J.D. and MRC Career Development Award G0800329 to A.S.M.), the Wellcome Trust (Sir Henry Dale Fellowship to J.S.), and the Royal Society (Grant WT105651MA to J.S.). We thank Matthew F. Rushworth for generously providing some of the data and Richard N. Henson for advice on connectivity analysis.
The authors declare no competing financial interests.
This is an Open Access article distributed under the terms of the Creative Commons Attribution License Creative Commons Attribution 4.0 International, which permits unrestricted use, distribution and reproduction in any medium provided that the original work is properly attributed.
References
- Bakker R, Wachtler T, Diesmann M. CoCoMac 2.0 and the future of tract-tracing databases. Front Neuroinform. 2012;6:30. doi: 10.3389/fninf.2012.00030. [DOI] [PMC free article] [PubMed] [Google Scholar]
- Beck DM, Rees G, Frith CD, Lavie N. Neural correlates of change detection and change blindness. Nat Neurosci. 2001;4:645–650. doi: 10.1038/88477. [DOI] [PubMed] [Google Scholar]
- Behzadi Y, Restom K, Liau J, Liu TT. A component based noise correction method (CompCor) for BOLD and perfusion based fMRI. Neuroimage. 2007;37:90–101. doi: 10.1016/j.neuroimage.2007.04.042. [DOI] [PMC free article] [PubMed] [Google Scholar]
- Bezgin G, Wanke E, Krumnack A, Kötter R. Deducing logical relationships between spatially registered cortical parcellations under conditions of uncertainty. Neural Netw. 2008;21:1132–1145. doi: 10.1016/j.neunet.2008.05.010. [DOI] [PubMed] [Google Scholar]
- Bezgin G, Vakorin VA, van Opstal AJ, McIntosh AR, Bakker R. Hundreds of brain maps in one atlas: registering coordinate-independent primate neuro-anatomical data to a standard brain. Neuroimage. 2012;62:67–76. doi: 10.1016/j.neuroimage.2012.04.013. [DOI] [PubMed] [Google Scholar]
- Boveroux P, Vanhaudenhuyse A, Bruno MA, Noirhomme Q, Lauwick S, Luxen A, Degueldre C, Plenevaux A, Schnakers C, Phillips C, Brichant JF, Bonhomme V, Maquet P, Greicius MD, Laureys S, Boly M. Breakdown of within- and between-network resting state functional magnetic resonance imaging connectivity during propofol-induced loss of consciousness. Anesthesiology. 2010;113:1038–1053. doi: 10.1097/ALN.0b013e3181f697f5. [DOI] [PubMed] [Google Scholar]
- Carmichael ST, Price JL. Architectonic subdivision of the orbital and medial prefrontal cortex in the macaque monkey. J Comp Neurol. 1994;346:366–402. doi: 10.1002/cne.903460305. [DOI] [PubMed] [Google Scholar]
- Caspari N, Janssens T, Mantini D, Vandenberghe R, Vanduffel W. Covert shifts of spatial attention in the macaque monkey. J Neurosci. 2015;35:7695–7714. doi: 10.1523/JNEUROSCI.4383-14.2015. [DOI] [PMC free article] [PubMed] [Google Scholar]
- Cole MW, Reynolds JR, Power JD, Repovs G, Anticevic A, Braver TS. Multi-task connectivity reveals flexible hubs for adaptive task control. Nat Neurosci. 2013;16:1348–1355. doi: 10.1038/nn.3470. [DOI] [PMC free article] [PubMed] [Google Scholar]
- Cusack R, Mitchell DJ, Duncan J. Discrete object representation, attention switching, and task difficulty in the parietal lobe. J Cogn Neurosci. 2010;22:32–47. doi: 10.1162/jocn.2009.21194. [DOI] [PubMed] [Google Scholar]
- Cusack R, Vicente-Grabovetsky A, Mitchell DJ, Wild CJ, Auer T, Linke AC, Peelle JE. Automatic analysis (aa): efficient neuroimaging workflows and parallel processing using Matlab and XML. Front Neuroinform. 2014;8:90. doi: 10.3389/fninf.2014.00090. [DOI] [PMC free article] [PubMed] [Google Scholar]
- Denys K, Vanduffel W, Fize D, Nelissen K, Peuskens H, Van Essen D, Orban GA. The processing of visual shape in the cerebral cortex of human and nonhuman primates: a functional magnetic resonance imaging study. J Neurosci. 2004;24:2551–2565. doi: 10.1523/JNEUROSCI.3569-03.2004. [DOI] [PMC free article] [PubMed] [Google Scholar]
- Dosenbach NU, Fair DA, Miezin FM, Cohen AL, Wenger KK, Dosenbach RA, Fox MD, Snyder AZ, Vincent JL, Raichle ME, Schlaggar BL, Petersen SE. Distinct brain networks for adaptive and stable task control in humans. Proc Natl Acad Sci U S A. 2007;104:11073–11078. doi: 10.1073/pnas.0704320104. [DOI] [PMC free article] [PubMed] [Google Scholar]
- Dum RP, Strick PL. Motor areas in the frontal lobe of the primate. Physiol Behav. 2002;77:677–682. doi: 10.1016/S0031-9384(02)00929-0. [DOI] [PubMed] [Google Scholar]
- Dumontheil I, Thompson R, Duncan J. Assembly and use of new task rules in fronto-parietal cortex. J Cogn Neurosci. 2011;23:168–182. doi: 10.1162/jocn.2010.21439. [DOI] [PubMed] [Google Scholar]
- Duncan J. The multiple-demand (MD) system of the primate brain: Mental programs for intelligent behaviour. Trends Cogn Sci. 2010;14:172–179. doi: 10.1016/j.tics.2010.01.004. [DOI] [PubMed] [Google Scholar]
- Duncan J, Owen AM. Common regions of the human frontal lobe recruited by diverse cognitive demands. Trends Neurosci. 2000;23:475–483. doi: 10.1016/S0166-2236(00)01633-7. [DOI] [PubMed] [Google Scholar]
- Duncan J, Seitz RJ, Kolodny J, Bor D, Herzog H, Ahmed A, Newell FN, Emslie H. A neural basis for general intelligence. Science. 2000;289:457–460. doi: 10.1126/science.289.5478.457. [DOI] [PubMed] [Google Scholar]
- Ercsey-Ravasz M, Markov NT, Lamy C, Van Essen DC, Knoblauch K, Toroczkai Z, Kennedy H. A predictive network model of cerebral cortical connectivity based on a distance rule. Neuron. 2013;80:184–197. doi: 10.1016/j.neuron.2013.07.036. [DOI] [PMC free article] [PubMed] [Google Scholar]
- Ester EF, Sprague TC, Serences JT. Parietal and frontal cortex encode stimulus-specific mnemonic representations during visual working memory. Neuron. 2015;87:893–905. doi: 10.1016/j.neuron.2015.07.013. [DOI] [PMC free article] [PubMed] [Google Scholar]
- Farooqui AA, Mitchell D, Thompson R, Duncan J. Hierarchical organization of cognition reflected in distributed frontoparietal activity. J Neurosci. 2012;32:17373–17381. doi: 10.1523/JNEUROSCI.0598-12.2012. [DOI] [PMC free article] [PubMed] [Google Scholar]
- Fedorenko E, Duncan J, Kanwisher N. Broad domain generality in focal regions of frontal and parietal cortex. Proc Natl Acad Sci U S A. 2013;110:16616–16621. doi: 10.1073/pnas.1315235110. [DOI] [PMC free article] [PubMed] [Google Scholar]
- Ferry AT, Ongür D, An X, Price JL. Prefrontal cortical projections to the striatum in macaque monkeys: evidence for an organization related to prefrontal networks. J Comp Neurol. 2000;425:447–470. doi: 10.1002/1096-9861(20000925)425:3%3C447::AID-CNE9%3E3.0.CO;2-V. [DOI] [PubMed] [Google Scholar]
- Finoia P, Mitchell DJ, Hauk O, Beste C, Pizzella V, Duncan J. Concurrent brain responses to separate auditory and visual targets. J Neurophysiol. 2015;114:1239–1247. doi: 10.1152/jn.01050.2014. [DOI] [PMC free article] [PubMed] [Google Scholar]
- Ford KA, Gati JS, Menon RS, Everling S. BOLD fMRI activation for anti-saccades in nonhuman primates. Neuroimage. 2009;45:470–476. doi: 10.1016/j.neuroimage.2008.12.009. [DOI] [PubMed] [Google Scholar]
- Fox MD, Snyder AZ, Vincent JL, Corbetta M, Van Essen DC, Raichle ME. The human brain is intrinsically organized into dynamic, anticorrelated functional networks. Proc Natl Acad Sci U S A. 2005;102:9673–9678. doi: 10.1073/pnas.0504136102. [DOI] [PMC free article] [PubMed] [Google Scholar]
- Freedman DJ, Assad JA. Experience-dependent representation of visual categories in parietal cortex. Nature. 2006;443:85–88. doi: 10.1038/nature05078. [DOI] [PubMed] [Google Scholar]
- Genovese CR, Lazar NA, Nichols T. Thresholding of statistical maps in functional neuroimaging using the false discovery rate. Neuroimage. 2002;15:870–878. doi: 10.1006/nimg.2001.1037. [DOI] [PubMed] [Google Scholar]
- Goulas A, Bastiani M, Bezgin G, Uylings HB, Roebroeck A, Stiers P. Comparative analysis of the macroscale structural connectivity in the macaque and human brain. PLoS Comput Biol. 2014;10:e1003529. doi: 10.1371/journal.pcbi.1003529. [DOI] [PMC free article] [PubMed] [Google Scholar]
- Greenberg AS, Esterman M, Wilson D, Serences JT, Yantis S. Control of spatial and feature-based attention in frontoparietal cortex. J Neurosci. 2010;30:14330–14339. doi: 10.1523/JNEUROSCI.4248-09.2010. [DOI] [PMC free article] [PubMed] [Google Scholar]
- Greicius MD, Kiviniemi V, Tervonen O, Vainionpää V, Alahuhta S, Reiss AL, Menon V. Persistent default-mode network connectivity during light sedation. Hum Brain Mapp. 2008;29:839–847. doi: 10.1002/hbm.20537. [DOI] [PMC free article] [PubMed] [Google Scholar]
- Heller R, Golland Y, Malach R, Benjamini Y. Conjunction group analysis: an alternative to mixed/random effect analysis. Neuroimage. 2007;37:1178–1185. doi: 10.1016/j.neuroimage.2007.05.051. [DOI] [PubMed] [Google Scholar]
- Hon N, Epstein RA, Owen AM, Duncan J. Frontoparietal activity with minimal decision and control. J Neurosci. 2006;26:9805–9809. doi: 10.1523/JNEUROSCI.3165-06.2006. [DOI] [PMC free article] [PubMed] [Google Scholar]
- Honey CJ, Kötter R, Breakspear M, Sporns O. Network structure of cerebral cortex shapes functional connectivity on multiple time scales. Proc Natl Acad Sci U S A. 2007;104:10240–10245. doi: 10.1073/pnas.0701519104. [DOI] [PMC free article] [PubMed] [Google Scholar]
- Hutchison RM, Everling S. Monkey in the middle: why non-human primates are needed to bridge the gap in resting-state investigations. Front Neuroanat. 2012;6:29. doi: 10.3389/fnana.2012.00029. [DOI] [PMC free article] [PubMed] [Google Scholar]
- Hutchison RM, Everling S. Broad intrinsic functional connectivity boundaries of the macaque prefrontal cortex. Neuroimage. 2013;88C:202–211. doi: 10.1016/j.neuroimage.2013.11.024. [DOI] [PubMed] [Google Scholar]
- Hutchison RM, Gallivan JP, Culham JC, Gati JS, Menon RS, Everling S. Functional connectivity of the frontal eye fields in humans and macaque monkeys investigated with resting-state fMRI. J Neurophysiol. 2012a;107:2463–2474. doi: 10.1152/jn.00891.2011. [DOI] [PubMed] [Google Scholar]
- Hutchison RM, Womelsdorf T, Gati JS, Leung LS, Menon RS, Everling S. Resting-state connectivity identifies distinct functional networks in macaque cingulate cortex. Cereb Cortex. 2012b;22:1294–1308. doi: 10.1093/cercor/bhr181. [DOI] [PubMed] [Google Scholar]
- Hutchison RM, Hutchison M, Manning KY, Menon RS, Everling S. Isoflurane induces dose-dependent alterations in the cortical connectivity profiles and dynamic properties of the brain's functional architecture. Hum Brain Mapp. 2014;35:5754–5775. doi: 10.1002/hbm.22583. [DOI] [PMC free article] [PubMed] [Google Scholar]
- Hutchison RM, Culham JC, Flanagan JR, Everling S, Gallivan JP. Functional subdivisions of medial parieto-occipital cortex in humans and nonhuman primates using resting-state fMRI. Neuroimage. 2015;116:10–29. doi: 10.1016/j.neuroimage.2015.04.068. [DOI] [PubMed] [Google Scholar]
- Jenkinson M. Internal Technical Report TR99MJ1. Oxford: FMRIB Centre, University of Oxford; 1999. Measuring transformation error by RMS deviation. Available at www.fmrib.ox.ac.uk/analysis/techrep. [Google Scholar]
- Lee KH, Choi YY, Gray JR, Cho SH, Chae JH, Lee S, Kim K. Neural correlates of superior intelligence: stronger recruitment of posterior parietal cortex. Neuroimage. 2006;29:578–586. doi: 10.1016/j.neuroimage.2005.07.036. [DOI] [PubMed] [Google Scholar]
- Lewis JW, Van Essen DC. Mapping of architectonic subdivisions in the macaque monkey, with emphasis on parieto-occipital cortex. J Comp Neurol. 2000;428:79–111. doi: 10.1002/1096-9861(20001204)428:1%3C79::AID-CNE7%3E3.0.CO;2-Q. [DOI] [PubMed] [Google Scholar]
- Liang Z, King J, Zhang N. Intrinsic organization of the anesthetized brain. J Neurosci. 2012;32:10183–10191. doi: 10.1523/JNEUROSCI.1020-12.2012. [DOI] [PMC free article] [PubMed] [Google Scholar]
- Li S, Ostwald D, Giese M, Kourtzi Z. Flexible coding for categorical decisions in the human brain. J Neurosci. 2007;27:12321–12330. doi: 10.1523/JNEUROSCI.3795-07.2007. [DOI] [PMC free article] [PubMed] [Google Scholar]
- Mante V, Sussillo D, Shenoy KV, Newsome WT. Context-dependent computation by recurrent dynamics in prefrontal cortex. Nature. 2013;503:78–84. doi: 10.1038/nature12742. [DOI] [PMC free article] [PubMed] [Google Scholar]
- Mantini D, Gerits A, Nelissen K, Durand JB, Joly O, Simone L, Sawamura H, Wardak C, Orban GA, Buckner RL, Vanduffel W. Default mode of brain function in monkeys. J Neurosci. 2011;31:12954–12962. doi: 10.1523/JNEUROSCI.2318-11.2011. [DOI] [PMC free article] [PubMed] [Google Scholar]
- Mantini D, Hasson U, Betti V, Perrucci MG, Romani GL, Corbetta M, Orban GA, Vanduffel W. Interspecies activity correlations reveal functional correspondence between monkey and human brain areas. Nat Methods. 2012;9:277–282. doi: 10.1038/nmeth.1868. [DOI] [PMC free article] [PubMed] [Google Scholar]
- Mantini D, Corbetta M, Romani GL, Orban GA, Vanduffel W. Evolutionarily novel functional networks in the human brain? J Neurosci. 2013;33:3259–3275. doi: 10.1523/JNEUROSCI.4392-12.2013. [DOI] [PMC free article] [PubMed] [Google Scholar]
- Margulies DS, Vincent JL, Kelly C, Lohmann G, Uddin LQ, Biswal BB, Villringer A, Castellanos FX, Milham MP, Petrides M. Precuneus shares intrinsic functional architecture in humans and monkeys. Proc Natl Acad Sci U S A. 2009;106:20069–20074. doi: 10.1073/pnas.0905314106. [DOI] [PMC free article] [PubMed] [Google Scholar]
- Marois R, Yi DJ, Chun MM. The neural fate of consciously perceived and missed events in the attentional blink. Neuron. 2004;41:465–472. doi: 10.1016/S0896-6273(04)00012-1. [DOI] [PubMed] [Google Scholar]
- Mars RB, Jbabdi S, Sallet J, O'Reilly JX, Croxson PL, Olivier E, Noonan MP, Bergmann C, Mitchell AS, Baxter MG, Behrens TE, Johansen-Berg H, Tomassini V, Miller KL, Rushworth MF. Diffusion-weighted imaging tractography-based parcellation of the human parietal cortex and comparison with human and macaque resting-state functional connectivity. J Neurosci. 2011;31:4087–4100. doi: 10.1523/JNEUROSCI.5102-10.2011. [DOI] [PMC free article] [PubMed] [Google Scholar]
- Mars RB, Neubert FX, Noonan MP, Sallet J, Toni I, Rushworth MF. On the relationship between the “default mode network” and the “social brain.”. Front Hum Neurosci. 2012;6:189. doi: 10.3389/fnhum.2012.00189. [DOI] [PMC free article] [PubMed] [Google Scholar]
- Mars RB, Sallet J, Neubert FX, Rushworth MF. Connectivity profiles reveal the relationship between brain areas for social cognition in human and monkey temporoparietal cortex. Proc Natl Acad Sci U S A. 2013;110:10806–10811. doi: 10.1073/pnas.1302956110. [DOI] [PMC free article] [PubMed] [Google Scholar]
- Matelli M, Luppino G, Rizzolatti G. Architecture of superior and mesial area 6 and the adjacent cingulate cortex in the macaque monkey. J Comp Neurol. 1991;311:445–462. doi: 10.1002/cne.903110402. [DOI] [PubMed] [Google Scholar]
- McLaren DG, Kosmatka KJ, Oakes TR, Kroenke CD, Kohama SG, Matochik JA, Ingram DK, Johnson SC. A population-average MRI-based atlas collection of the rhesus macaque. Neuroimage. 2009;45:52–59. doi: 10.1016/j.neuroimage.2008.10.058. [DOI] [PMC free article] [PubMed] [Google Scholar]
- Miranda-Dominguez O, Mills BD, Grayson D, Woodall A, Grant KA, Kroenke CD, Fair DA. Bridging the gap between the human and macaque connectome: a quantitative comparison of global interspecies structure-function relationships and network topology. J Neurosci. 2014;34:5552–5563. doi: 10.1523/JNEUROSCI.4229-13.2014. [DOI] [PMC free article] [PubMed] [Google Scholar]
- Modha DS, Singh R. Network architecture of the long-distance pathways in the macaque brain. Proc Natl Acad Sci U S A. 2010;107:13485–13490. doi: 10.1073/pnas.1008054107. [DOI] [PMC free article] [PubMed] [Google Scholar]
- Moeller S, Nallasamy N, Tsao DY, Freiwald WA. Functional connectivity of the macaque brain across stimulus and arousal states. J Neurosci. 2009;29:5897–5909. doi: 10.1523/JNEUROSCI.0220-09.2009. [DOI] [PMC free article] [PubMed] [Google Scholar]
- Nakahara K, Hayashi T, Konishi S, Miyashita Y. Functional MRI of macaque monkeys performing a cognitive set-shifting task. Science. 2002;295:1532–1536. doi: 10.1126/science.1067653. [DOI] [PubMed] [Google Scholar]
- Neubert FX, Mars RB, Thomas AG, Sallet J, Rushworth MF. Comparison of human ventral frontal cortex areas for cognitive control and language with areas in monkey frontal cortex. Neuron. 2014;81:700–713. doi: 10.1016/j.neuron.2013.11.012. [DOI] [PubMed] [Google Scholar]
- Neubert FX, Mars RB, Sallet J, Rushworth MF. Connectivity reveals relationship of brain areas for reward-guided learning and decision making in human and monkey frontal cortex. Proc Natl Acad Sci U S A. 2015;112:E2695–2704. doi: 10.1073/pnas.1410767112. [DOI] [PMC free article] [PubMed] [Google Scholar]
- Noonan MP, Sallet J, Mars RB, Neubert FX, O'Reilly JX, Andersson JL, Mitchell AS, Bell AH, Miller KL, Rushworth MF. A neural circuit covarying with social hierarchy in macaques. PLoS Biol. 2014;12:e1001940. doi: 10.1371/journal.pbio.1001940. [DOI] [PMC free article] [PubMed] [Google Scholar]
- Orban GA, Van Essen D, Vanduffel W. Comparative mapping of higher visual areas in monkeys and humans. Trends Cogn Sci. 2004;8:315–324. doi: 10.1016/j.tics.2004.05.009. [DOI] [PubMed] [Google Scholar]
- O'Reilly JX, Croxson PL, Jbabdi S, Sallet J, Noonan MP, Mars RB, Browning PG, Wilson CR, Mitchell AS, Miller KL, Rushworth MF, Baxter MG. Causal effect of disconnection lesions on interhemispheric functional connectivity in rhesus monkeys. Proc Natl Acad Sci U S A. 2013;110:13982–13987. doi: 10.1073/pnas.1305062110. [DOI] [PMC free article] [PubMed] [Google Scholar]
- Patel GH, Yang D, Jamerson EC, Snyder LH, Corbetta M, Ferrera VP. Functional evolution of new and expanded attention networks in humans. Proc Natl Acad Sci U S A. 2015;112:9454–9459. doi: 10.1073/pnas.1420395112. [DOI] [PMC free article] [PubMed] [Google Scholar]
- Paus T. Primate anterior cingulate cortex: where motor control, drive and cognition interface. Nat Rev Neurosci. 2001;2:417–424. doi: 10.1038/35077500. [DOI] [PubMed] [Google Scholar]
- Paxinos G, Huang X, Toga AW. The rhesus monkey brain in stereotaxic coordinates. San Diego: Academic; 2000. [Google Scholar]
- Power JD, Cohen AL, Nelson SM, Wig GS, Barnes KA, Church JA, Vogel AC, Laumann TO, Miezin FM, Schlaggar BL, Petersen SE. Functional network organization of the human brain. Neuron. 2011;72:665–678. doi: 10.1016/j.neuron.2011.09.006. [DOI] [PMC free article] [PubMed] [Google Scholar]
- Roy JE, Riesenhuber M, Poggio T, Miller EK. Prefrontal cortex activity during flexible categorization. J Neurosci. 2010;30:8519–8528. doi: 10.1523/JNEUROSCI.4837-09.2010. [DOI] [PMC free article] [PubMed] [Google Scholar]
- Sakagami M, Niki H. Encoding of behavioral significance of visual stimuli by primate prefrontal neurons: Relation to relevant task conditions. Exp Brain Res. 1994;97:423–436. doi: 10.1007/BF00241536. [DOI] [PubMed] [Google Scholar]
- Saleem KS, Logothetis NK. A combined MRI and histology atlas of the rhesus monkey brain in stereotaxic coordinates. San Diego: Academic; 2007. [Google Scholar]
- Sallet J, Mars RB, Noonan MP, Andersson JL, O'Reilly JX, Jbabdi S, Croxson PL, Jenkinson M, Miller KL, Rushworth MF. Social network size affects neural circuits in macaques. Science. 2011;334:697–700. doi: 10.1126/science.1210027. [DOI] [PubMed] [Google Scholar]
- Sallet J, Mars RB, Noonan MP, Neubert FX, Jbabdi S, O'Reilly JX, Filippini N, Thomas AG, Rushworth MF. The organization of dorsal frontal cortex in humans and macaques. J Neurosci. 2013;33:12255–12274. doi: 10.1523/JNEUROSCI.5108-12.2013. [DOI] [PMC free article] [PubMed] [Google Scholar]
- Schall JD, Morel A, King DJ, Bullier J. Topography of visual cortex connections with frontal eye field in macaque: convergence and segregation of processing streams. J Neurosci. 1995;15:4464–4487. doi: 10.1523/JNEUROSCI.15-06-04464.1995. [DOI] [PMC free article] [PubMed] [Google Scholar]
- Schröter MS, Spoormaker VI, Schorer A, Wohlschläger A, Czisch M, Kochs EF, Zimmer C, Hemmer B, Schneider G, Jordan D, Ilg R. Spatiotemporal reconfiguration of large-scale brain functional networks during propofol-induced loss of consciousness. J Neurosci. 2012;32:12832–12840. doi: 10.1523/JNEUROSCI.6046-11.2012. [DOI] [PMC free article] [PubMed] [Google Scholar]
- Seeley WW, Menon V, Schatzberg AF, Keller J, Glover GH, Kenna H, Reiss AL, Greicius MD. Dissociable intrinsic connectivity networks for salience processing and executive control. J Neurosci. 2007;27:2349–2356. doi: 10.1523/JNEUROSCI.5587-06.2007. [DOI] [PMC free article] [PubMed] [Google Scholar]
- Stephan KE, Kamper L, Bozkurt A, Burns GA, Young MP, Kötter R. Advanced database methodology for the collation of connectivity data on the macaque brain (CoCoMac) Philos Trans R Soc Lond B Biol Sci. 2001;356:1159–1186. doi: 10.1098/rstb.2001.0908. [DOI] [PMC free article] [PubMed] [Google Scholar]
- Stoewer S, Ku SP, Goense J, Steudel T, Logothetis NK, Duncan J, Sigala N. Frontoparietal activity with minimal decision and control in the awake macaque at 7 T. Magn Reson Imaging. 2010;28:1120–1128. doi: 10.1016/j.mri.2009.12.024. [DOI] [PubMed] [Google Scholar]
- Stokes MG, Kusunoki M, Sigala N, Nili H, Gaffan D, Duncan J. Dynamic coding for cognitive control in prefrontal cortex. Neuron. 2013;78:364–375. doi: 10.1016/j.neuron.2013.01.039. [DOI] [PMC free article] [PubMed] [Google Scholar]
- Thompson R, Duncan J. Attentional modulation of stimulus representation in human fronto-parietal cortex. Neuroimage. 2009;48:436–448. doi: 10.1016/j.neuroimage.2009.06.066. [DOI] [PubMed] [Google Scholar]
- Toth LJ, Assad JA. Dynamic coding of behaviourally relevant stimuli in parietal cortex. Nature. 2002;415:165–168. doi: 10.1038/415165a. [DOI] [PubMed] [Google Scholar]
- Van Essen DC. Cortical cartography and Caret software. Neuroimage. 2012;62:757–764. doi: 10.1016/j.neuroimage.2011.10.077. [DOI] [PMC free article] [PubMed] [Google Scholar]
- Van Essen DC, Dierker DL. Surface-based and probabilistic atlases of primate cerebral cortex. Neuron. 2007;56:209–225. doi: 10.1016/j.neuron.2007.10.015. [DOI] [PubMed] [Google Scholar]
- Van Essen DC, Glasser MF, Dierker DL, Harwell J. Cortical parcellations of the macaque monkey analyzed on surface-based atlases. Cereb Cortex. 2012;22:2227–2240. doi: 10.1093/cercor/bhr290. [DOI] [PMC free article] [PubMed] [Google Scholar]
- Vincent JL, Patel GH, Fox MD, Snyder AZ, Baker JT, Van Essen DC, Zempel JM, Snyder LH, Corbetta M, Raichle ME. Intrinsic functional architecture in the anaesthetized monkey brain. Nature. 2007;447:83–86. doi: 10.1038/nature05758. [DOI] [PubMed] [Google Scholar]
- Wardak C, Vanduffel W, Orban GA. Searching for a salient target involves frontal regions. Cereb Cortex. 2010;20:2464–2477. doi: 10.1093/cercor/bhp315. [DOI] [PubMed] [Google Scholar]
- Watanabe M. Prefrontal unit activity during associative learning in the monkey. Exp Brain Res. 1990;80:296–309. doi: 10.1007/BF00228157. [DOI] [PubMed] [Google Scholar]
- Woolgar A, Parr A, Cusack R, Thompson R, Nimmo-Smith I, Torralva T, Roca M, Antoun N, Manes F, Duncan J. Fluid intelligence loss linked to restricted regions of damage within frontal and parietal cortex. Proc Natl Acad Sci U S A. 2010;107:14899–14902. doi: 10.1073/pnas.1007928107. [DOI] [PMC free article] [PubMed] [Google Scholar]
- Woolgar A, Hampshire A, Thompson R, Duncan J. Adaptive coding of task-relevant information in human frontoparietal cortex. J Neurosci. 2011;31:14592–14599. doi: 10.1523/JNEUROSCI.2616-11.2011. [DOI] [PMC free article] [PubMed] [Google Scholar]