

Abstract
Sugarcane accounts for a large portion of the worlds sugar production. Modern commercial cultivars are complex hybrids of S. officinarum and several other Saccharum species. Historical records identify New Guinea as the origin of S. officinarum and that a small number of plants originating from there were used to generate all modern commercial cultivars. The mitochondrial genome can be a useful way to identify the maternal origin of commercial cultivars. We have used the PacBio RSII to sequence and assemble the mitochondrial genome of a South East Asian commercial cultivar, known as Khon Kaen 3. The long read length of this sequencing technology allowed for the mitochondrial genome to be assembled into two distinct circular chromosomes with all repeat sequences spanned by individual reads. Comparison of five commercial hybrids, two S. officinarum and one S. spontaneum to our assembly reveals no structural rearrangements between our assembly, the commercial hybrids and an S. officinarum from New Guinea. The S. spontaneum, from India, and one sample of S. officinarum (unknown origin) are substantially rearranged and have a large number of homozygous variants. This supports the record that S. officinarum plants from New Guinea are the maternal source of all modern commercial hybrids.
Sugarcane is the major source of processed sugar in the world and therefore an important crop species. Modern commercial cultivars of sugarcane are complex hybrids of S. officinarum and S. spontaneum and, to a lesser extent, some other species and hybrids (for review see1,2,3). Sugarcane is believed to have originated in the South Pacific, but was widely dispersed by early explorers making it difficult to pinpoint its origin. It is believed that S. spontaneum originates from India, but can be found growing wild from eastern and northern Africa, through the Middle East, to India, China, South East Asia, and through the Pacific to New Guinea. It is believed that S. officinarum have been derived from S. robustum, which shares the same center of origin with S. officinarum in New Guinea. Sequencing and comparing the nuclear and mitochondrial genomes may yield some insight into the history of sugarcane and provide a valuable resource for genetic improvement.
Plant mitochondrial genomes are remarkably different to animal mitochondrial genomes (for review see4). Plant mitochondrial genomes vary in size from 200 Kb in Brassica hirta5 to 11.3 Mb in Silene conica6. Genome expansion is primarily from repeat sequence, intron expansion and incorporation of plastid and nuclear DNA7,8. Accumulation of repetitive sequences in plant mitochondrial genomes cause frequent recombination events and dynamic genome rearrangements within a species leading to the generation of multiple circular DNA strands with overlapping sequence and different copy number9,10,11. In such cases the complete genome is referred to as the master circle with the DNA circles derived from recombination referred to as subgenomic circles or minicircles. It has been convention to represent the mitochondrial genome as a single DNA circle sometimes resulting in duplication of repeat sequence in the final assembly, however, this is not always noted12. In addition to this at least a few cases have been identified where the master circle no longer exists and the genome consists of multiple circular strands of DNA without shared sequence that could facilitate recombination6,13. Plant mitochondrial genomes are unlikely to be limited to a single origin of replication14,15. Break-induced repair and recombination has been proposed as a potential source for genome expansion and could be the cause for the long repeat sequences often found in plant mitochondria16. These long repeats plus DNA sequence sharing between the nuclear and plastid genomes can confound efforts to assemble plant mitochondrial genomes by introducing branch points that lead to multiple sequences including mitochondrial, nuclear or chloroplast sequence. This sequence sharing, the highly repetitive nature and relatively large size of plant mitochondrial genomes makes them difficult to assemble.
Results and Discussion
Sugarcane mitochondrial assembly
An assembly from CAP3 using a subset of corrected reads >30 Kb consisted of 20 contigs which included 4 mitochondrial contigs and two chloroplast contigs with the remaining contigs coming from nuclear DNA based on blast results. The high number of nuclear contigs is a reflection of choosing a loose e-value blast cut-off so that all of the mitochondrial reads would be included to facilitate a complete final assembly. The four mitochondrial contigs could be joined to form two distinct circular chromosomes (Fig. 1) by using all of the corrected reads. The median read depth of all corrected reads to the two circular chromosomes was 13 and the mean read depth was 14. The largest chromosome, chromosome 1, is 300778 bp and includes a 15 Kb direct repeat sequence at 97558:113073 and 285262:300778 bp. There were reads that spanned both copies of the 15 Kb repeat sequence supporting that both copies occur in a single circular chromosome and no reads that supported any subgenomic circles from this sequence. The other chromosome, chromosome 2, is 144698 bp and forms a circular chromosome with no reads linking any sequence to chromosome 1.
Figure 1. Chromosomes of the sugarcane mitochondrial genome.

Chromosomes 1 and 2 of the sugarcane mitochondrial genome with gene location and symbol shown. Exons are shown in colour with small introns indicated as white space. Genes shown on the inside are on the negative strand while genes shown on the outside are on the positive strand. The grey circle represents the GC content.
While it is common for plant mitochondrial genomes to exist as a master circle with minicircles resulting from recombination between repeats, this is not the case for sugarcane. There were a total of 111 repeats in the mitochondrial assembly. The two largest repeats were the 15 Kb direct repeat and a 4 Kb inverted repeat. The remaining repeats were shorter than 360 bp with repeats in the range of 30–80 bp accounting for 87% of the total number of repeats. There were 47 repeats on chromosome 1, 11 repeats on chromosome 2 and 53 repeats shared between the two circular chromosomes. While the repeats shared between the two chromosomes could potentially facilitate recombination, the largest was only 296 bp so any recombination would have been easily detected by the long read lengths, yet none were found.
While no recombinations were found, a single alternate arrangement was identified for chromosome 1 that involves a 4 Kb inverted repeat that occurs at 45730–49805 bp and 169987–174062 bp with long reads spanning both copies. The alternate arrangement results in an inversion of the 120 Kb segment between the two repeats and deletion of one of the inverted repeats with five reads supporting the inversion versus seven reads supporting the arrangement we have presented. The lack of large repeats shared between the two chromosomes or sequences derived through recombination is solid evidence that the sugarcane mitochondrial genome exists not as a master circle with minicircles, but as two completely separate DNA circles. The mechanism by which plant mitochondrial genomes go from a combination of the master circle plus minicircles to multiple discrete DNA circles could be the break-induced repair and recombination events discussed by Christensen AC16.
Sugarcane mitochondria annotation
We identified 66 unique open reading frames plus 26 duplicate copies and 17 partial chloroplast gene fragments (Table 1). These genes were primarily from the oxidative phosphorylation pathway (22 genes) and ribosome (10 genes). Fifty-seven genes are encoded by a single exon and eight genes are encoded across multiple exons. We found trans-splicing of group II introns in three genes: nad1, nad2 and nad5 (for review see17). The exons of nad1 are separated by as much as 80 Kb and encoded on both the plus and minus strands of chromosome 1, consistent with findings in other species17. The genes nad2 and nad5 have exons split between chromosome 1 and chromosome 2, similar to what was found for S. vulgaris6. The RNA-seq data for six varieties plus genomic sequence for eight varieties from the DRA database was used to identify C → U RNA-editing in start and stop codons. Only nad1 had confirmed RNA editing at a start codon, all of the database varieties had the base identified in our assembly (Cytosine) at this location and all of the RNA-seq varieties had a Uracil. No other cases of RNA-editing at start or stop codons were detected.
Table 1. Genes in the sugarcane mitochondrial genome.
| Gene function | Gene name |
|---|---|
| Complex I | nad1[5], nad2[5], nad3, nad4[4], nad4L, nad5[5], nad6, nad7[5], nad9 |
| Complex II | — |
| Complex III | cob |
| Complex IV | cox1, cox2[2], cox3 |
| Complex V | atp1, atp4, atp6, (2x)atp8, atp9 |
| Cytochrome-c biogenesis | ccmB, ccmC, ccmFc[2], ccmFn |
| SecY-independent transport | mttB |
| Ribosomal RNAs | 5S rRNA, 18S rRNA, 26S rRNA |
| Ribosomal protein small subunit | rps1, rps2, rps3[2], rps4, rps12, rps13 |
| Ribusomal protein large subunit | rpl16 |
| Intron maturase | matR |
| Chloroplast transferred complete genes | rpl14, rpl16, rpl23, rpl36, rps8, rps11 |
| Conserved Hypothetical genes | orf25-cp, orf34-cp, orf74-cp, orf99-cp, orf104, orf137-cp, orf179-cp |
| Transfer RNA | trnC-GCA-cp, trnD-GUC, trnE-UUC, trnF-GAA-cp, trnH-GUG-cp, trnI-cp, trnK-UUU, (2x)trnL-CAA, (2x)trnM-CAU, trnM-CAU-cp, trnN-GUU-cp, (2x)trnP-UGG-cp, trnQ-UUG, trnS-GCT, trnS-GGA-cp, trnS-TGA, trnW-CCA-cp, trnY-GTA |
| Pseudogenes | sdh4 |
| cp-derived gene fragment transfer | atpA, InfA, PetB, PetD, RpoA, atpB, atpE, atpH, ndhC, ndhJ, ndhK, orf251, rbcL, rpl2[2], rpoC1, rpoC2, rps19 |
Bracketed numbers indicate copy number of each gene, square brackets indicate number of exons, chloroplast derived tRNAs have -cp appended to them.
There were 18 tRNA genes identified, three of which occurred twice in the assembled mitochondrial genome (Table 1). Seven of the tRNA genes plus six other genes are from the sugarcane chloroplast (indicated with ‘-cp’ in Table 1) and primarily occur in the large sections of transferred chloroplast DNA. Gene transfer to and from the nucleus occurs commonly in mitochondria18. Sugarcane showed the same gene loss and gain as Sorghum, with one exception, sugarcane regained trnL-CAA (Fig. 2).
Figure 2. Phylogenetic tree comparing sugarcane with seven plant mitochondrial genomes.

Gene gain and loss are indicated by arrow direction toward or away from the branch, respectively. Gene names in red indicate genes that have been lost and then regained or vice versa.
Comparison with other species and sugarcane cultivars
We constructed a phylogenetic tree using 28 mitochondrial genes from seven species and found that sugarcane is most closely related to Sorghum (Fig. 2). The closest ancestor to sugarcane, of species with database sequence, has been identified as Sorghum by comparison of sugarcane BAC sequence19. The two species are close enough that Sorghum could be used as a template to assemble the majority of sugarcane genic DNA19. Blast against the mitochondrial genome of the closest species in the database, Sorghum, showed that 345 Kb of the 468 Kb mitochondrial genome is represented in our assembly, although, substantially rearranged (Fig. 3). This shows that a large amount of mitochondrial repeat sequence is shared between the two species. This includes 3 Kb of the inverted repeat and the entire direct repeat split into two parts, in both cases existing in the Sorghum genome as a single copy.
Figure 3. Comparison of sugarcane and Sorghum bicolor mitochondrial genomes.
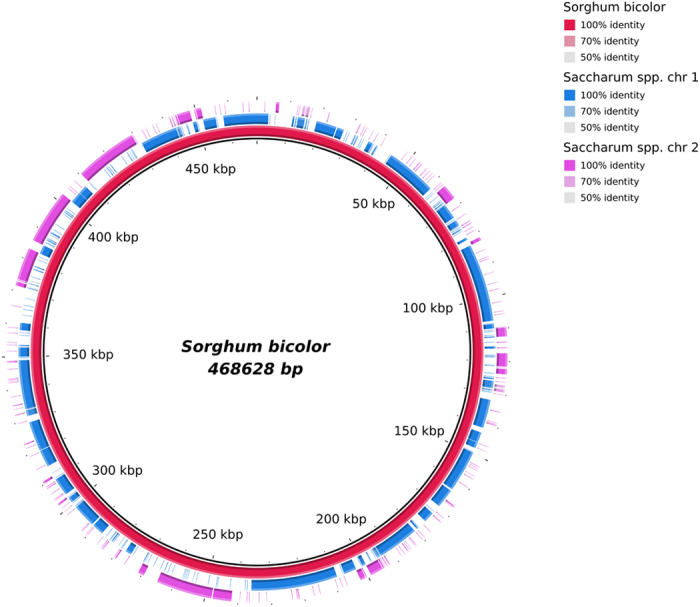
The S. bicolor genome is represented in full as the red circle. Similar sequence from the sugarcane assembly is represented in blue for chromosome 1 and purple for chromosome 2. The segmented nature of the two sugarcane chromosomes reflects the highly rearranged state of the sequence compared to S. bicolor.
Database sequence from eight varieties, including one S. spontaneum, two S. officinarum and five hybrids, were used to identify variants. A large number of structural variants were identified between the S. spontaneum, S. officinarum and hybrids that we checked (Table 2). All of the structural variants found were in SES205A (S. spontaneum, accession: SRR922216) and sample 82–72 (S. officinarum, accession: SRR922217). The clone SES205A originates from India, but the origin of cultivar 82–72 could not be traced. Interestingly, the other sample of S. officinarum, IJ76–514, (accession: SRR528718), originally sourced from Irian Jaya (New Guinea), did not have the same structural variants, and instead was consistent with both our assembly and the other commercial hybrids. This is consistent with the hypothesis that all modern commercial varieties are derived from a New Guinean S. officinarum3. We performed de novo assemblies of the two samples with the structural variants (SES205A and 82–72) and the contigs from these assemblies supported the structural variants identified by the mapped reads, however, both samples had a large number of contigs which could not be constructed into complete genomes because of the high number of structural variants found. The most notable differences between these two samples and the others are multiple cases of reads joining Chromosome 1 with Chromosome 2. It is possible that these two samples have a single circular DNA strand instead of the two in our assembly or just a different arrangement involving two or more circles.
Table 2. Structural variants.
| Chr | Location (Kb) | Variant type | DRA accession and name |
|||||||
|---|---|---|---|---|---|---|---|---|---|---|
| SRR922216, SES205A | SRR922217, 82–72 | SRR528718, IJ76–514 | SRR922218, B4362 | SRR922219, RB72454 | SRR922220, RB867515 | SRR528717, Q165 | SRR871522, SP70–1143 | |||
| 1 | 40.4 | 150 bp indel, 40.6 Kb (−) join 223.4 Kb (−) | 1 | 1 | 0 | 0 | 0 | 0 | 0 | 0 |
| 1 | 45.7 | 120 Kb inversion | 1 | 1 | 0 | 0 | 0 | 0 | 0 | 0 |
| 1 | 51.3–53.1 | 1.8 Kb deletion | 1 | 1 | 0 | 0 | 0 | 0 | 0 | 0 |
| 1 | 82–82.5 | 500 bp deletion | 1 | 1 | 0 | 0 | 0 | 0 | 0 | 0 |
| 1 | 83.5–98 | Complex set of indels and rearrangements including links to chromosome 2 | 1 | 1 | 0 | 0 | 0 | 0 | 0 | 0 |
| 1 | 150.2–150.6 | 150.2 Kb (+) join Chromosome 2 5.4 Kb (+); 150.6 Kb (−) join Chromosome 2 5.5 Kb (−) | 1 | 1 | 0 | 0 | 0 | 0 | 0 | 0 |
| 1 | 185–190 | 185 Kb (+) join 86 Kb (−); 190 Kb (+) join Chromosome 2 30 Kb (−) | 1 | 1 | 0 | 0 | 0 | 0 | 0 | 0 |
| 1 | 196 | 196 Kb (+) join Chromosome 2 112 Kb (+) | 1 | 1 | 0 | 0 | 0 | 0 | 0 | 0 |
| 1 | 196.9–197.3 | 400 bp deletiion | 1 | 1 | 0 | 0 | 0 | 0 | 0 | 0 |
| 1 | 198–198.5 | 500 bp deletion | 1 | 1 | 0 | 0 | 0 | 0 | 0 | 0 |
| 1 | 198.6–208.1 | <10% average read depth suggesting nuclear DNA | 1 | 1 | 0 | 0 | 0 | 0 | 0 | 0 |
| 1 | 222.8 | 222.8 Kb (+) join 235.6 Kb (+); 222.8 Kb (−) join 40.8 Kb (−) | 1 | 1 | 0 | 0 | 0 | 0 | 0 | 0 |
| 1 | 235.6 | 235.6 Kb (+) join 222.8 Kb (+); 235.6 Kb (−) join 160.8 Kb (−) | 1 | 1 | 0 | 0 | 0 | 0 | 0 | 0 |
| 1 | 262.7–263.2 | 500 bp deletion | 1 | 1 | 0 | 0 | 0 | 0 | 0 | 0 |
| 2 | 29.4–30 | 29.4 Kb (+) join Chromosome 1 159.8 Kb (−); Almost zero read depth 29.4–29.9 Kb. | 1 | 1 | 0 | 0 | 0 | 0 | 0 | 0 |
| 2 | 75.8–75.9 | 100 bp deletion | 1 | 1 | 0 | 0 | 0 | 0 | 0 | 0 |
| 2 | 94.6 | 94.6 Kb (+/−) join Chromosome 1 120.8 Kb (+/−) | 1 | 1 | 0 | 0 | 0 | 0 | 0 | 0 |
| 2 | 108.8 | 50 bp deletion | 1 | 1 | 0 | 0 | 0 | 0 | 0 | 0 |
| 2 | 112.2 | 112.2 Kb (+) join Chromosome 1 195.7 Kb (+) | 1 | 1 | 0 | 0 | 0 | 0 | 0 | 0 |
| 2 | 139–139.5 | 500 bp deletion | 1 | 1 | 0 | 0 | 0 | 0 | 0 | 0 |
Presence of the variant is indicated by a 1 and a 0 represents the arrangement from our assembly.
A total of 2,243 small variants were identified from the eight database samples consisting of 183 small InDels and 2,060 SNPs. We excluded any small variants with a per-sample minor allele proportion of less than 10% in an effort to exclude sequencing errors, which could not be reliably estimated from the database samples. The number of homozygous variants in most samples were small, in the range of 0 to 1%, with the exception of SES205A and 82–72, which both had 10%. This is consistent with the structural variations observed where these two samples were markedly different to the others. The majority of small variants identified (2,088) were shared by one to five samples (Table 3) and are therefore likely to have originated after sugarcane development. The remaining 155 variants were common to six or more samples and thus likely occurred early during sugarcane development.
Table 3. Small variant sharing between samples.
| Number of Samples | Variant Count |
|---|---|
| 1 | 823 |
| 2 | 774 |
| 3 | 259 |
| 4 | 140 |
| 5 | 92 |
| 6 | 63 |
| 7 | 43 |
| 8 | 33 |
| 9 | 12 |
| 10 | 2 |
| 11 | 2 |
Conclusions
We have assembled the mitochondrial genome of a commercial sugarcane hybrid, Khon Kaen 3, and annotated coding sequence with the aid of RNA-seq data. Phylogenetic analysis supports the previous finding of Sorghum being the closest relative to sugarcane in the database. Although we only have two samples of S. officinarum, the similarity between the modern hybrid cultivars and IJ76–514 (SRR528718) is consistent with the hypothesis that S. officinarum from New Guinea was used to generate all modern commercial cultivars.
We have shown that the sugarcane mitochondrial genome exists as two discrete DNA circles with no evidence of recombination between them. However, the pronounced rearrangement between sugarcane and Sorghum shows that significant rearrangements have taken place in the past. The large number of sequences linking the two chromosomes in the sample of S. spontaneum and one of the samples (82–72) listed as S. officinarum show that the events leading to the separate chromosomes we identified here must have occurred relatively recently. This is consistent with divergence estimates from chloroplast sequence that show S. officinarum diverged from S. spontaneum between 580 and 780 thousand years ago20.
The large differences in size, structural arrangement and level of recombination between published mitochondrial genomes of different species suggest that plant mitochondrial genomes are in an interesting phase of evolution11. Sequencing additional species with long read length technologies is likely to yield additional insight to the evolution of plant mitochondrial genomes.
Materials and Methods
Sample and DNA extraction
The sugarcane sample is a commercial hybrid that has been developed in Thailand known as Khon Kaen 3. This cultivar was generated by crossing K84–200 (ROC1 x CP63–588) with 85-2-352 (SP70–1143 x Q76) and is a cultivar that is commonly used in South East Asia. Leaf tissue was collected from a single plant and used for DNA extraction with the standard CTAB method followed by clean-up using a DNeasy Mini spin column from Qiagen.
Sequencing and assembly
DNA was used to prepare libraries for the PacBio RSII following the Pacific Biosciences ‘Procedure and Checklist −20 Kb Template Preparation Using BluePippin Size-Selection System’ protocol. DNA (10 ug) was sheared with a Covaris gTube, 4500 rpm for 2 minutes and the BluePippin cassette used was ‘0.75%DF Marker S1 high-pass 15–20 Kb’ with selection of 12–50 Kb. Sequencing was performed for 100 cells on the PacBio RSII. Raw reads longer than 26 Kb (118796 reads totalling 3.5 Gb) were used as seed reads and reads shorter than 26 Kb were used to correct them by the RS_PreAssembler.1 protocol with default settings from the Pacific Biosciences SMRTanalysis (v2.3.0) software package. The corrected reads were then blasted against the mitochondrial genome database from NCBI using an e-value cut-off of 1e–6 to identify reads that could be mitochondrial. A CAP3 assembly was performed using parameters: -o 1000 -e 200 -p 75 -k 0 with the corrected reads >30 Kb21. All the corrected reads were then blasted against the final assembly and contigs were joined that had overlapping sequence or reads that joined them to form a circular DNA strand. The corrected reads were mapped to this assembly using BWA MEM to confirm that the assembly was supported by the majority of reads and check for evidence of alternate genome configurations that could result from recombination22. Quiver (part of the SMRTanalysis suite) was then run on the final assembly to fix PacBio sequencing errors.
A data set of RNA-seq was obtained from DDBJ (SRR849062) for six pooled sugarcane cultivars and used to check for non-canonical start codons and RNA-editing23. Open Reading Frames (ORFs) were predicted using Open Reading Frame Finder [https://www.ncbi.nlm.nih.gov/gorf/gorf.html]. The tRNA genes were searched using tRNAscan-SE24. The annotated genes were also checked with the plant mitochondrial genome annotation program Mitofy25. All predicted ORFs, tRNA genes and rRNA genes were searched against the publicly available mitochondrial nucleotide and protein sequence database. Codon usage was calculated from all (33) of the mitochondrial coding genes. Repeats were identified using Reputer v3.026.
Sugarcane mitochondrial sequence comparison
A total of eight datasets of genomic sequence data from Illumina runs were downloaded from DDBJ27,28. These data sets included one S. spontaneum (SRR922216) sample, two S. officinarum (SRR922217 and SRR528718) and five samples listed as Saccharum hybrid (SRR528717, SRR871522, SRR922218, SRR922219, SRR922220). The reads from each data sets were mapped to the sugarcane mitochondrial assembly generated from this work using Bowtie229, variants were called using GATK v3.4–4630 and structural variants were identified visually using IGV31. Small variants identified by GATK were only considered if the minor variant accounted for at least 10% of the reads on a per sample basis. Variants within repeat regions, including chloroplast sequence, were excluded. In addition, a de novo assembly using Ray32 was performed for two of the samples with the most structural variants (SRR922216 and SRR922217). The sugarcane mitochondrial genome was compared to the Sorghum bicolor mitochondrial genome using BLAST and graphed using the BLAST Ring Image Generator33.
Phylogenetic tree
A phylogenetic tree was constructed using seven species (Oryza sativa Indica, Phoenix dactylifera, Sorghum bicolor, Tripsacum dactyloides, Triticum aestivum, Zea mays and Cycas taitungensis as an outgroup). Gene sequences from each species for 28 conserved genes (nad1, nad2, nad3, nad4, nad4L, nad5, nad6, nad7, nad9, cob, cox1, cox2, cox3, matR, atp1, atp4, atp6, atp8, atp9, rps1, rps3, rps4, rps7, rps12, rps13, ccmB, ccmFN, mttB) were compared and a maximum likelihood tree was constructed using MEGA 5 with 1000 bootstrap replications34. Gene gain and loss in sugarcane was determined by comparing the sugarcane gene content to database sequences of the other species used for the phylogenetic tree.
Additional Information
Accession codes: Chromosome 1: LC107874 5674d093d25b2c19190110ce.Chromosome_1 Chromosome 2: LC107875 5674d093d25b2c19190110ce.Chromosome_2
How to cite this article: Shearman, J. R. et al. The two chromosomes of the mitochondrial genome of a sugarcane cultivar: assembly and recombination analysis using long PacBio reads. Sci. Rep. 6, 31533; doi: 10.1038/srep31533 (2016).
Acknowledgments
The authors would like to acknowledge funding from the National Science and Technology Development Agency, Thailand, and Mitr Phol Sugarcane Research Center.
Footnotes
Author Contributions S.Tr., J.R.S. and S.Ta. conceived of the study. J.R.S., C.S. and C.N. performed bioinformatics work and prepared figures. W.P., T.Y., D.S. and N.J. performed laboratory work and library construction. J.R.S. wrote the manuscript and all authors reviewed it.
References
- Ming R. et al. In Plant Breeding Reviews (ed. Janick J.) 15–118 (John Wiley & Sons, Inc., 2005). [Google Scholar]
- Daniels J. & Roach B. T. In Developments in Crop Science (ed. Heinz D. J.) 11, 7–84 (Elsevier, 1987). [Google Scholar]
- Purseglove J. W. Tropical Crops: Monocotyledons. (Longman Group Ltd., London, 1979). [Google Scholar]
- Gualberto J. M. et al. The plant mitochondrial genome: dynamics and maintenance. Biochimie 100, 107–120 (2014). [DOI] [PubMed] [Google Scholar]
- Palmer J. D. & Herbon L. A. Unicircular structure of the Brassica hirta mitochondrial genome. Curr. Genet. 11, 565–570 (1987). [DOI] [PubMed] [Google Scholar]
- Sloan D. B. et al. Rapid evolution of enormous, multichromosomal genomes in flowering plant mitochondria with exceptionally high mutation rates. PLoS Biol. 10, e1001241 (2012). [DOI] [PMC free article] [PubMed] [Google Scholar]
- Turmel M., Otis C. & Lemieux C. The mitochondrial genome of Chara vulgaris: insights into the mitochondrial DNA architecture of the last common ancestor of green algae and land plants. Plant Cell 15, 1888–1903 (2003). [DOI] [PMC free article] [PubMed] [Google Scholar]
- Bullerwell C. E. & Gray M. W. Evolution of the mitochondrial genome: protist connections to animals, fungi and plants. Curr. Opin. Microbiol. 7, 528–534 (2004). [DOI] [PubMed] [Google Scholar]
- Chang S. et al. Mitochondrial genome sequencing helps show the evolutionary mechanism of mitochondrial genome formation in Brassica. BMC Genomics 12, 497 (2011). [DOI] [PMC free article] [PubMed] [Google Scholar]
- Allen J. O. et al. Comparisons among two fertile and three male-sterile mitochondrial genomes of maize. Genetics 177, 1173–1192 (2007). [DOI] [PMC free article] [PubMed] [Google Scholar]
- Guo W. et al. Ginkgo and Welwitschia Mitogenomes Reveal Extreme Contrasts in Gymnosperm Mitochondrial Evolution. Mol. Biol. Evol. 33, 1448–1460 (2016). [DOI] [PubMed] [Google Scholar]
- Mower J. P., Case A. L., Floro E. R. & Willis J. H. Evidence against equimolarity of large repeat arrangements and a predominant master circle structure of the mitochondrial genome from a monkeyflower (Mimulus guttatus) lineage with cryptic CMS. Genome Biol. Evol. 4, 670–686 (2012). [DOI] [PMC free article] [PubMed] [Google Scholar]
- Alverson A. J., Rice D. W., Dickinson S., Barry K. & Palmer J. D. Origins and recombination of the bacterial-sized multichromosomal mitochondrial genome of cucumber. Plant Cell 23, 2499–2513 (2011). [DOI] [PMC free article] [PubMed] [Google Scholar]
- Mackenzie & McIntosh. Higher plant mitochondria. Plant Cell 11, 571–586 (1999). [DOI] [PMC free article] [PubMed] [Google Scholar]
- Manchekar M. et al. DNA recombination activity in soybean mitochondria. J. Mol. Biol. 356, 288–299 (2006). [DOI] [PubMed] [Google Scholar]
- Christensen A. C. Plant mitochondrial genome evolution can be explained by DNA repair mechanisms. Genome Biol. Evol. 5, 1079–1086 (2013). [DOI] [PMC free article] [PubMed] [Google Scholar]
- Bonen L. Cis- and trans-splicing of group II introns in plant mitochondria. Mitochondrion 8, 26–34 (2008). [DOI] [PubMed] [Google Scholar]
- Adams K. L. & Palmer J. D. Evolution of mitochondrial gene content: gene loss and transfer to the nucleus. Mol. Phylogenet. Evol. 29, 380–395 (2003). [DOI] [PubMed] [Google Scholar]
- Wang J. et al. Microcollinearity between autopolyploid sugarcane and diploid sorghum genomes. BMC Genomics 11, 261 (2010). [DOI] [PMC free article] [PubMed] [Google Scholar]
- Takahashi S. et al. Very close relationship of the chloroplast genomes among Saccharum species. TAG Theor. Appl. Genet. Theor. Angew. Genet. 110, 1523–1529 (2005). [DOI] [PubMed] [Google Scholar]
- Huang X. & Madan A. CAP3: A DNA Sequence Assembly Program. Genome Res. 9, 868–877 (1999). [DOI] [PMC free article] [PubMed] [Google Scholar]
- Li H. & Durbin R. Fast and accurate long-read alignment with Burrows-Wheeler transform. Bioinforma. Oxf. Engl. 26, 589–595 (2010). [DOI] [PMC free article] [PubMed] [Google Scholar]
- Cardoso-Silva C. B. et al. De novo assembly and transcriptome analysis of contrasting sugarcane varieties. PloS One 9, e88462 (2014). [DOI] [PMC free article] [PubMed] [Google Scholar]
- Schattner P., Brooks A. N. & Lowe T. M. The tRNAscan-SE, snoscan and snoGPS web servers for the detection of tRNAs and snoRNAs. Nucleic Acids Res. 33, W686–689 (2005). [DOI] [PMC free article] [PubMed] [Google Scholar]
- Alverson A. J. et al. Insights into the evolution of mitochondrial genome size from complete sequences of Citrullus lanatus and Cucurbita pepo (Cucurbitaceae). Mol. Biol. Evol. 27, 1436–1448 (2010). [DOI] [PMC free article] [PubMed] [Google Scholar]
- Kurtz S. et al. REPuter: the manifold applications of repeat analysis on a genomic scale. Nucleic Acids Res. 29, 4633–4642 (2001). [DOI] [PMC free article] [PubMed] [Google Scholar]
- Bundock P. C., Casu R. E. & Henry R. J. Enrichment of genomic DNA for polymorphism detection in a non-model highly polyploid crop plant. Plant Biotechnol. J. 10, 657–667 (2012). [DOI] [PubMed] [Google Scholar]
- Grativol C. et al. Sugarcane genome sequencing by methylation filtration provides tools for genomic research in the genus Saccharum. Plant J. Cell Mol. Biol. 79, 162–172 (2014). [DOI] [PMC free article] [PubMed] [Google Scholar]
- Langmead B. & Salzberg S. L. Fast gapped-read alignment with Bowtie 2. Nat. Methods 9, 357–359 (2012). [DOI] [PMC free article] [PubMed] [Google Scholar]
- McKenna A. et al. The Genome Analysis Toolkit: a MapReduce framework for analyzing next-generation DNA sequencing data. Genome Res. 20, 1297–1303 (2010). [DOI] [PMC free article] [PubMed] [Google Scholar]
- Robinson J. T. et al. Integrative genomics viewer. Nat. Biotechnol. 29, 24–26 (2011). [DOI] [PMC free article] [PubMed] [Google Scholar]
- Boisvert S., Raymond F., Godzaridis É., Laviolette F. & Corbeil J. Ray Meta: scalable de novo metagenome assembly and profiling. Genome Biol. 13, R122 (2012). [DOI] [PMC free article] [PubMed] [Google Scholar]
- Alikhan N.-F., Petty N. K., Ben Zakour N. L. & Beatson S. A. BLAST Ring Image Generator (BRIG): simple prokaryote genome comparisons. BMC Genomics 12, 402 (2011). [DOI] [PMC free article] [PubMed] [Google Scholar]
- Tamura K. et al. MEGA5: molecular evolutionary genetics analysis using maximum likelihood, evolutionary distance, and maximum parsimony methods. Mol. Biol. Evol. 28, 2731–2739 (2011). [DOI] [PMC free article] [PubMed] [Google Scholar]