Significance
Competition between localized and itinerant electrons in highly correlated materials can lead to myriad insulating ground states, including spatially inhomogeneous but ordered charge superlattices. In layered transition metal oxides, such charge order can take the form of stripes, which typically arrange themselves in staggered formations to reduce Coulomb repulsion. Having achieved single-crystal growth of the layered nickelate La4Ni3O8, we show that its heretofore incompletely understood phase transition is associated with charge stripe ordering. We find that the stripes are stacked directly on top of one another within nickel oxide trilayers but staggered between successive trilayers. A unique, paradoxical ground state results, in which the electrostatic building principle is respected at long range but violated at short range.
Keywords: charge stripe, charge order, nickelate, strongly correlated materials, transition metal oxides
Abstract
The quasi-2D nickelate La4Ni3O8 (La-438), consisting of trilayer networks of square planar Ni ions, is a member of the so-called T′ family, which is derived from the Ruddlesden–Popper (R-P) parent compound La4Ni3O10−x by removing two oxygen atoms and rearranging the rock salt layers to fluorite-type layers. Although previous studies on polycrystalline samples have identified a 105-K phase transition with a pronounced electronic and magnetic response but weak lattice character, no consensus on the origin of this transition has been reached. Here, we show using synchrotron X-ray diffraction on high-pO2 floating zone-grown single crystals that this transition is associated with a real space ordering of charge into a quasi-2D charge stripe ground state. The charge stripe superlattice propagation vector, q = (2/3, 0, 1), corresponds with that found in the related 1/3-hole doped single-layer R-P nickelate, La5/3Sr1/3NiO4 (LSNO-1/3; Ni2.33+), with orientation at 45° to the Ni-O bonds. The charge stripes in La-438 are weakly correlated along c to form a staggered ABAB stacking that reduces the Coulomb repulsion among the stripes. Surprisingly, however, we find that the charge stripes within each trilayer of La-438 are stacked in phase from one layer to the next, at odds with any simple Coulomb repulsion argument.
Competition between localized and itinerant electron behavior is an organizing construct in our understanding of correlated electron transition metal oxide (TMO) physics (1–4). Some of the most compelling phenomenology in these materials occurs in the mixed valent state for the transition metal, which is set by composition, doping, and anion coordination of the metal. Many mixed valent TMOs adopt insulating “charge ordered” states, in which an inhomogeneous but long-range ordered configuration of the charge density condenses from a uniform metallic state (5). The real space pattern of charge order varies by material (6–9), but a typically observed motif is some variety of charge stripes. Such stripes have been observed in cobaltites (10–12), cuprates (13–15), nickelates (16–19), and manganites (20–22), albeit with highly materials-dependent configurations that hinge on a balance among Coulomb, lattice, and magnetic exchange energies. For instance, charge stripes in layered nickelates typically stagger themselves from layer to layer to reduce the collective electrostatic energy arising from the charge disproportionation (9, 18).
Indeed, the case of nickelates plays a prominent role in charge stripe physics (6–9, 16–19, 23–28), because mixed valent Ni2+ (d8) and Ni3+ (d7) compounds, such as La2 − xSrxNiO4 (LSNO), are structurally and electronically related to high Tc superconductors and thus, have been targeted as potential alternatives to the cuprates. Instead of superconductivity, however, the ground state of such quasi-2D, octahedrally coordinated nickelates is marked by static charge and spin stripes, with a threefold superlattice (SL) periodicity for compositions near x = 1/3 [La5/3Sr1/3NiO4 (LSNO-1/3)] found to be particularly stable (7). Despite this ubiquitous behavior for octahedrally coordinated nickelates, Anisimov et al. (29) have suggested that Ni1+ in a square planar coordination with O ions can form an S = 1/2 antiferromagnetic (AFM) insulator that may be doped with low-spin (S = 0) Ni2+ holes to yield a superconductor.
To test such ideas, a series of T′ phases Rn + 1NinO2n + 2 (R = La, n = 2; R = La, Pr, and Nd, n = 3) with a square planar Ni-O environment was synthesized and studied in polycrystalline form (30–37). None of these materials superconduct. However, one of the members of the series, La4Ni3O8 (La-438), undergoes a still incompletely understood phase transition on cooling through 105 K (Fig. 1) accompanied by a dramatic increase in resistivity and a discontinuity in magnetization (35). Based on a range of theoretical treatments (35, 38–43), the transition has been attributed to a spin density wave (SDW) (35) or a low spin- to high spin-driven (LS-HS) metal to insulator transition (37, 38, 41, 44), possibly accompanied by charge disproportionation into two Ni1+ sheets sandwiching an Ni2+ sheet in the trilayer (Fig. 2A) (42). Difficulties remain with each of these potential explanations, and although NMR measurements (36) reveal strongly 2D AFM spin fluctuations developing eventually into long-range order, the nature of the low-temperature magnetic state remains open; neutron powder diffraction shows no magnetic peaks (35). Other fundamental issues connected to nickelate physics are also relevant to La-438, including homogeneity of the hole concentration in the symmetry-inequivalent layers (i.e., layered charge segregation that must be present to some extent because of the different environments of the outer and inner layers); the appropriateness of a mixed valent Ni1+/Ni2+ description; the role of ligand holes vis-à-vis more highly oxidized Ni3+-containing oxides, such as LSNO and LaNiO3; 3z2 − r2/x2 − y2 orbital polarization; and ultimately, the potential for unconventional superconductivity (45). [Lee and Pickett (45) argue that the weaker d-p hybridization in nickelates renders any such Cu2+-Ni1+ analogy moot.] Unfortunately, a lack of single crystals to date has challenged definitive experimental tests and impeded progress on all of these issues.
Fig. 1.
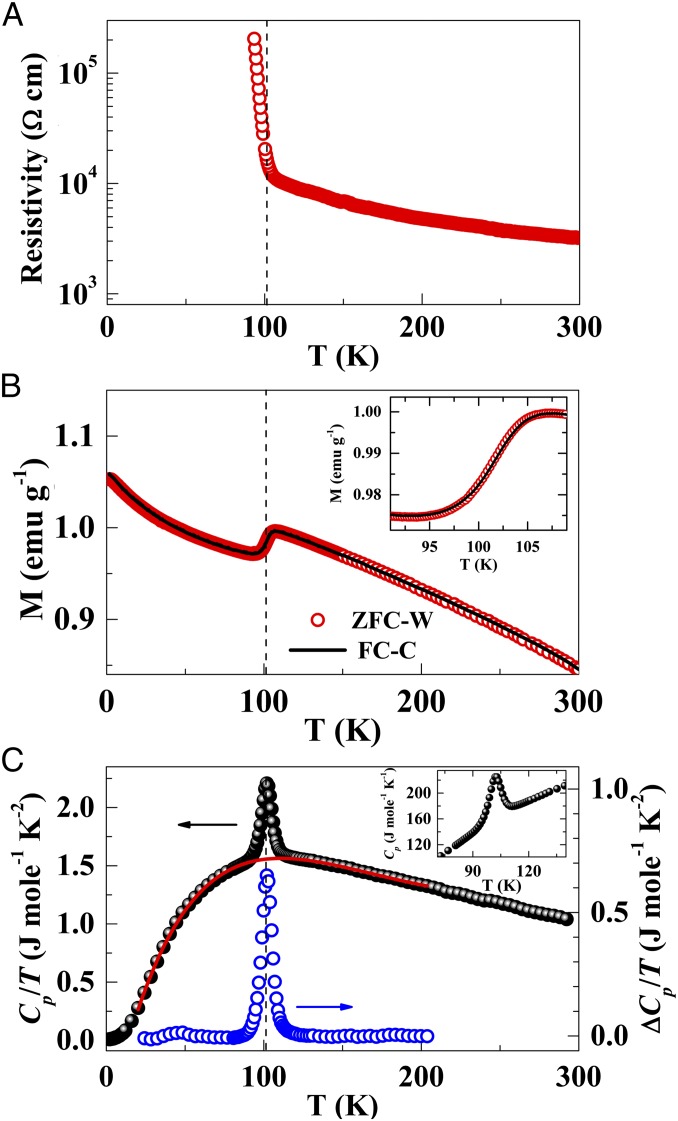
Temperature dependence of selected physical properties of La-438. (A) Electrical resistivity in the ab plane. (B) In-plane magnetic susceptibility for 5 T. B, Inset shows the details around the transition. FC-C, data collected on cooling under field (black curve); ZFC-W, data collected on warming after zero field cooling (red circles). (C) Heat capacity Cp/T vs. T in zero field. C, Inset shows the λ-like shape of the 105-K anomaly in Cp. Open blue circles, difference between the data and the fit; red curve, polynomial background fit; solid back points, data.
Fig. 2.
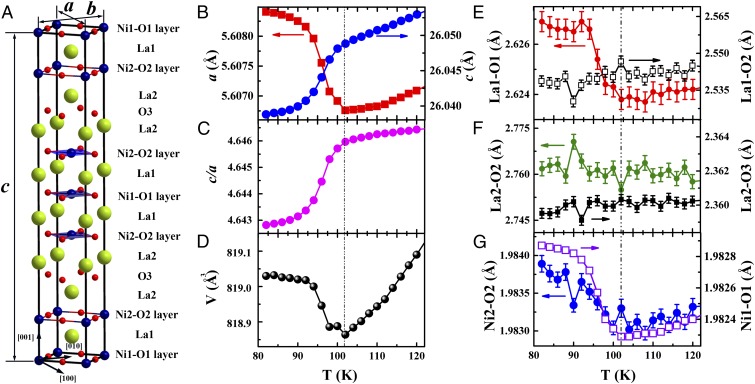
Crystal structure of La-438. (A) The I4/mmm unit cell is highlighted with solid lines, and the F4/mmm setting used in this work is identified by the lattice vectors a, b, and c. Temperature dependence of the (B–D) unit cell parameters and (E–G) bond distances extracted from Rietveld refinement on high-resolution synchrotron X-ray powder diffraction data. Error bars represent the estimated SD from the refinement, and they are smaller than symbols for the unit cell parameters (a, c, and V).
Here, we present a fresh view of La-438 physics made possible by our newly found ability to grow single crystals of this compound. In particular, using single-crystal synchrotron X-ray diffraction, we find evidence of an SL below the 105-K transition and argue that it is associated with real space ordering of charge. Our results reveal a close connection between La-438 (Ni1.33+) and LSNO-1/3 (Ni2.33+), including a shared propagation wave vector q = (2/3, 0, 1), ordering of the stripes at 45° to the Ni-O bonds, and a weak coupling along the c axis in a staggered configuration that minimizes Coulomb repulsion between adjacent trilayer blocks separated by ∼6.5 Å. Remarkably, however, our data show that, within the trilayer itself, the charge stripes are stacked in phase with one another, violating the Coulomb repulsion argument at this much shorter (∼3.25 Å) length scale.
Results and Discussion
La-438 single crystals (∼1–2 mm2 × ∼0.5 mm) were obtained by reducing (4 mol % H2/Ar gas; 350 °C; 5 d) specimens cleaved from a boule of La4Ni3O10 that was grown at pO2 = 20 bar in an optical image floating zone furnace (HKZ-1; SciDre GmbH). The crystals are fragile, likely because of strains and microcracks that develop during the reduction process. Indeed, the structure undergoes a large, highly anisotropic expansion: Δa ∼ Δb ∼ +3.0% and Δc ∼ −6.6% (34, 46). Nonetheless, La-438 specimens measured at 15-ID-B of the Advanced Photon Source (APS) definitively showed that they are well-defined single crystals, from which the structure of La-438 was determined (SI Text, Single-Crystal X-Ray Diffraction and Tables S1 and S2).
Table S1.
Crystal data and structure refinement for La-438 at 296(2) K
| Category | I4/mmm | F4/mmm |
| Empirical formula | La4Ni3O8 | |
| Formula weight | 859.77 | |
| Temperature, K | 296(2) | |
| Wavelength, Å | 0.41328 | |
| Crystal system, space group | Tetragonal, I4/mmm | Tetragonal, F4/mmm |
| Unit cell dimensions, Å | ||
| a and b | a = b = 3.9700(5) | a = b = 5.6144 |
| c | c = 26.092(3) | c = 26.092 |
| Volume, Z | 411.24(11) Å3, 2 | 822.48 Å3, 4 |
| Density (calculated), g/cm3 | 6.943 | |
| Absorption coefficient, mm−1 | 5.668 | |
| F(000) | 752 | 1,504 |
| θ-Range for data collection, ° | 0.908–14.402 | |
| Reflections collected/independent | 1,609/128 (Rint = 0.0231) | |
| Completeness to θ = 14.357°, % | 83.6 | |
| Refinement method | Full matrix least squares on F2 | |
| Data/restraints/parameters | 128/0/21 | |
| Goodness of fit | 1.441 | |
| Final R indices [I > 2σ(I)] | Robs = 0.0170, wRobs = 0.0402 | |
| R indices (all data) | Rall = 0.0207, wRall = 0.0517 | |
| Largest difference peak and hole, e·Å−3 | 0.921 and −1.046 |
R = Σ||Fo| − |Fc||/Σ|Fo|, wR = {Σ[w(|Fo|2 − |Fc|2)2]/Σ[w(|Fo|4)]}1/2, and w = 1/[σ2(Fo2) + 10.5182P], where P = (Fo2 + 2Fc2)/3.
Table S2.
Atomic coordinates and equivalent isotropic displacement parameters for La-438 at 296(2) K
| Atomic coordinates (SD) | |||||||||
| Label | Wyckoff position | I4/mmm | F4/mmm | Occupancy | Ueq*, Å2 (SD) | ||||
| x | y | z | x | y | z | ||||
| La(1) | 4e | 0 | 0 | 0.4339(1) | 0 | 0 | 0.4339(1) | 1 | 0.004(1) |
| La(2) | 4e | 0 | 0 | 0.2990(1) | 0 | 0 | 0.2990(1) | 1 | 0.004(1) |
| Ni(1) | 2a | 0 | 0 | 0 | 0 | 0 | 0 | 1 | 0.003(1) |
| Ni(2) | 4e | 0 | 0 | 0.1250(1) | 0 | 0 | 0.1250(1) | 1 | 0.005(1) |
| O(1) | 4c | 0 | 0.5 | 0 | 0.25 | 0.25 | 0 | 1 | 0.007(2) |
| O(2) | 8g | 0 | 0.5 | 0.1261(2) | 0.25 | 0.25 | 0.1261(2) | 1 | 0.007(2) |
| O(3) | 4d | 0 | 0.5 | 0.2500 | 0.25 | 0.25 | 0.2500 | 1 | 0.005(2) |
*Ueq is defined as one-third of the trace of the orthogonalized Uij tensor.
At room temperature, La-438 crystallizes in the tetragonal I4/mmm (no. 139) space group with unit cell parameters aI = 3.9700(5) Å, cI = 26.092(3) Å, and Z = 2 in agreement with the structure reported by Poltavets et al. (34) from Rietveld refinement on powder neutron data. For consistency with the body of literature on LSNO (18, 47), we henceforth adopt the F4/mmm ( aI × aI × cI) description of this high T phase, with the principal axes rotated 45° from the Ni-O bonds (Fig. 2A). All Ni atoms are in square planar coordination with Ni-O bond lengths 1.9850(2) Å for Ni(1)-O and 1.9852(3) Å for Ni(2)-O, which are slightly longer than those reported for the n = 2 La3Ni2O6 (30) and n = ∞ LaNiO2 (48) phases. Nominally, the average Ni1.33+ oxidation state can be apportioned as Ni+ and Ni2+ in the outer and inner layers, respectively. However, first principles theoretical considerations argue against this picture (41) along with our experimental data presented below.
Based on single-crystal diffraction measurements, we argue that charge stripe ordering is the underlying mechanism of the semiconductor to insulator transition in La-438. We also find similar signatures in transport, magnetic, and thermodynamic data measured on La-438 crystals as those reported in the unambiguously identified charge stripe phase LSNO-1/3 (7, 16, 27, 49). Fig. 1 shows the temperature dependence of the transport and magnetic properties of as-prepared La-438 single crystals, which are similar to those reported in the works by Poltavets et al. (35) and Cheng et al. (37). [Poltavets et al. (34) pointed out that the La-438 structure does not allow oxygen vacancies, despite its preparation by oxygen deintercalation. The transport, magnetic, and thermodynamic data collected on our La-438 single crystals are in excellent agreement with those reported by Poltavets et al. (35) and Cheng et al. (37), confirming that our samples are oxygen stoichiometric.] The in-plane resistivity (Fig. 1A) reveals a semiconducting behavior above a transition at 105 K and a highly insulating behavior below this transition. The abrupt localization of charge below the transition is qualitatively similar to that observed in LSNO-1/3 (16) with the onset of charge stripes. We note that Cheng et al. (37) suggest that poor grain connectivity in their cold-pressed polycrystalline La-438 samples leads to an anomalously high resistance for T > 105 K and argue from thermopower measurements that the true state in this high T regime is metallic. Our data show a similar high resistance, which could result from poor connectivity across a strain-induced network of microcracks created during the reduction process. Nonetheless, the temperature dependence is not that of a metal. The semiconducting behavior above the charge stripe ordering transition may signify the presence of short-range correlations among localized electrons, and such behavior is also observed in LSNO-1/3 (27). For instance, Abeykoon et al. (23) have reported that dynamic charge stripe correlations in LSNO-1/3 can survive up to ∼2TCO (∼480 K). The magnetic susceptibility (Fig. 1B) shows a step at 105 K, which is again qualitatively similar to that observed in LSNO-1/3 (49). Although LSNO-1/3 shows a slope change in dχ/dT at TSO ∼ 194 K < TCO ∼ 239 K (49), we find no evidence for such in La-438 below 105 K. It is possible that La-438 does not have such a spin ordering transition or that it is coincident with the localization transition at 105 K. A Curie–Weiss analysis of the high-temperature data can be found in SI Text, Magnetization and Figs. S1 and S2.
Fig. S1.
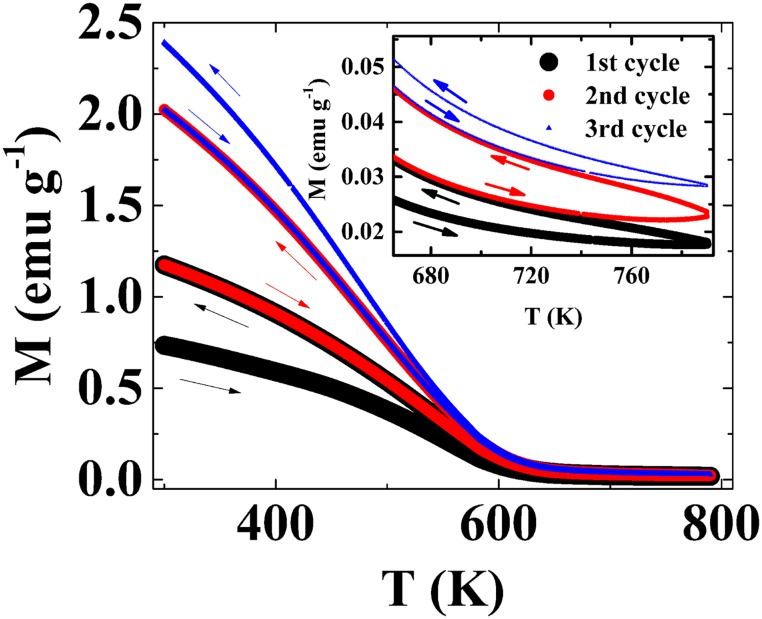
Magnetic susceptibility of La-438 with magnetic field 1 T between 300 and 795 K. Inset shows the details of the magnetic susceptibility in the range of 665–795 K.
Fig. S2.
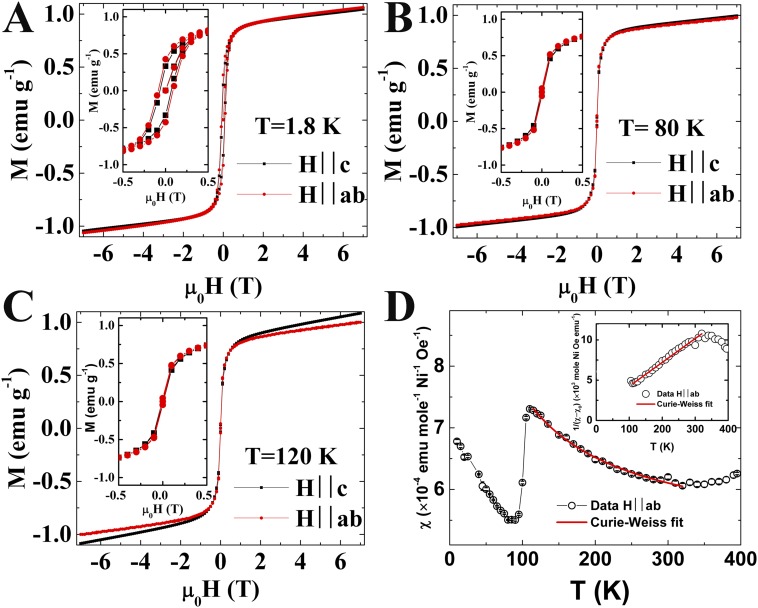
Magnetization and extracted magnetic susceptibility. (A–C) Magnetization vs. magnetic field at various temperatures. (D) Extracted magnetic susceptibility from M(H) curves (SI Text). D, Inset shows inverse magnetic susceptibility, 1/(χ − χ0), as a function of temperature. Error bars in D represent the estimated SD for the linear fit of M(H) curves, and they are smaller than symbols for χ.
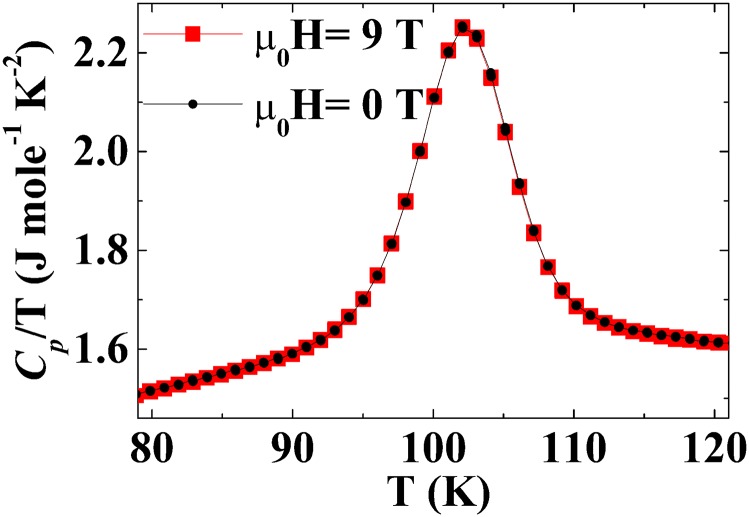
The heat capacity of an La-438 single crystal is presented in Fig. 1C; the phase transition at TCO is clearly indicated by a prominent anomaly. Cp/T is independent of the magnetic field up to 9 T within the experimental resolution (SI Text, Heat Capacity and Fig. S3), a behavior similar to that reported for LSNO-1/3 (49). The λ-like shape of the anomaly in Cp (Fig. 1C, Inset) and the absence of thermal hysteresis in the magnetic susceptibility (Fig. 1B, Inset) evidence a second-order phase transition, as was reported for charge stripe formation in LSNO-1/3 (49). To estimate the entropy change of the transition, we have phenomenologically fit the behavior above and below with a fifth-order polynomial and subtracted this background (SI Text, Heat Capacity). Integrating the area under the resultant peak yields ∆S = 5.93 J mol−1 K−1 (1.98 J mol−1 K−1 Ni−1), which agrees well with that found by Poltavets et al. (35) (5.96 J mol−1 K−1). The entropy change per Ni in La-438 is identical to that found by Klingeler et al. (49) in LSNO-1/3 (2.0 ± 0.3 J mol−1 K−1 Ni−1), which has been attributed to the condensation of the short-range, fluctuating charge stripes that exist above TCO. Alternative explanations that ignore the potential influence of short-range order, such as a 3D Néel transition (ΔS = 3.84 J mol−1 K−1 Ni−1), an SDW transition (ΔS ∼ TCO/TF ∼ 0.08 J mol−1 K−1) (50, 51), or an LS-HS transition (ΔS = 1.63 J mol−1 K−1 Ni−1), are not supported by the data (SI Text, Heat Capacity). The agreement of the entropy changes through the transition in La-438 and stripe ordered LSNO-1/3 is hardly a coincidence, and we will show below compelling evidence for charge stripe formation in La-438.
Fig. S3.
Heat capacity of an La-438 single crystal for μ0H = 0 and 9 T.
Fig. 2 B–D shows the temperature dependence of the unit cell parameters in the range 82–120 K extracted from Rietveld refinement of high-resolution X-ray powder diffraction data (SI Text, High-Resolution Powder X-Ray Diffraction and Fig. S4). No symmetry change was observed in the powder data below the transition in this temperature range. However, a clear increase of the a-axis length (∼0.029%) and unit cell volume (∼0.02%) and a decrease of the c-axis length (∼0.038%) are observed when cooling through the 105-K transition, with a concomitant drop in c/a (∼0.068%). Our data are consistent with those published by Cheng et al. (37) and reflect a weak lattice contribution to the transition. Fig. 2 E–G shows the La-O and Ni-O bond lengths as a function of temperature. Pronounced but smooth changes in the bond lengths of La1-O1 (∼0.003 Å), Ni1-O1 (<0.001 Å), and Ni2-O2 (<0.001 Å) are observed, but no changes outside the noise are observed in La1-O2, La2-O2, and La2-O3. This behavior shows that the structural changes that occur through the transition are isolated to the Ni-O trilayer blocks, with the rock salt LaO layers acting as weak structural links between these blocks. We note that the sign of the change in unit cell parameters and Ni-O bond distance on cooling is consistent with the spin-state transition model proposed by Lokshin and Egami (44) and developed theoretically by Pardo and Pickett (41), in which x2 − y2 orbitals become more electron-rich. If such a picture is correct, however, the charge redistribution is associated with a remarkably small magnitude of the lattice response.
Fig. S4.
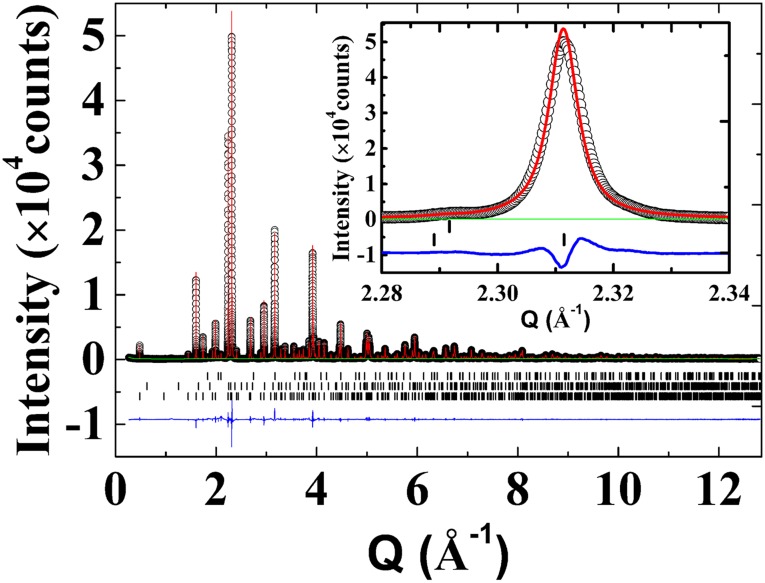
High-resolution synchrotron X-ray diffraction pattern of La-438 at room temperature. Black circles, red curve, green curve, black bars, and blue curve correspond to the observed data, calculated intensity, background, Bragg peaks, and difference curve, respectively. The black bars show (Bottom) La-438, (Middle) La3Ni2O6.35, and (Top) La2O3. Inset shows the quality of fit in Q range of 2.28–2.34 Å−1.
With an average oxidation state of 1.33+, square planar-coordinated La-438 is separated by an integral charge from the average oxidation state of 2.33+ in octahedrally coordinated LSNO-1/3, which develops a charge and spin stripe-ordered ground state. It is, thus, intriguing to consider that analogous ordering of charges and spins could be occurring in this square planar coordinated trilayer system electronically controlled by a 1/3-hole doping beyond a uniform Ni1+ background. We now provide synchrotron X-ray diffraction evidence that supports such a picture and argue that real space ordering of charge is the cause of the semiconductor to insulator transition in La-438.
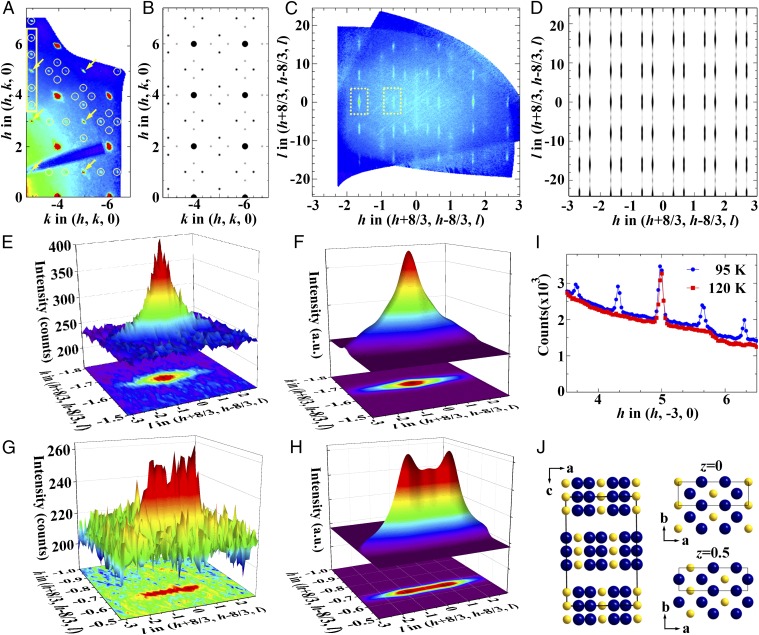
Fig. 3A shows an hk0 plane measured at 95 K. In addition to the fundamentals at (2, −4, 0), (4, −4, 0), (2, −6, 0), etc., sharp SL reflections are observed between these fundamentals spaced evenly at an interval of a*/3. Refinement of the positions against ∼400 SL reflections (I ≥ 3σ) gives q = 0.333(1). SL spots are observed along both a* and b*, reflecting the mixture of two 90°-oriented orthorhombic domains expected on lowering of symmetry from tetragonal to orthorhombic. The presence of such distinct stripe domains rotated by 90° with respect to one another has also been observed in the single-layer Ruddlesden–Popper (R-P) phases (47). The resulting pattern in the hk0 layer, thus, appears as squares of SL peaks along the zone edge, corresponding to the [100] direction in real space, or 45° to the Ni-O bonds. A line cut along (h, −3, 0) (Fig. 3I) shows that these SL reflections are absent above the 105-K transition. In contrast to the sharp reflections seen in the hk0 projection, the SL peaks become broadened along c* as shown in the (h + 8/3, h − 8/3, l) plane (Fig. 3C). Because the widths of the main peaks and SL peaks are similar in the ab plane, one cannot differentiate a finite correlation length from long-range order. Along c*, however, the SL peaks are significantly broader than the main Bragg peaks. Analysis of the peak width (SI Text, Correlation Length and Fig. S6) yields a finite correlation length of ∼8 Å along the c direction, which is the same order as the distance between neighboring trilayer blocks. Thus, the qualitative appearance is consistent with the expected ξab >> ξc, which was likewise found in LSNO-1/3 (19). We might expect that short-range fluctuating stripes will form above 105 K before condensing, again like LSNO-1/3 (23). The close agreement of the entropy changes through the transition to long-range order between La-438 and LSNO-1/3 corroborates this supposition.
Fig. 3.
Charge stripe ordering in La-438. (A and C) Reconstructed (hk0) and (h + 8/3, h − 8/3, l) planes (F4/mmm notation) measured below 105 K at 15-ID-B. Note that intensity at the forbidden peaks [e.g., (1, −5, 0), (3, −5, 0), (5, −3, 0), …], as indicated by yellow arrows in A, results from leakage of intensity from allowed Bragg reflections at positions (h, k, ±1) (SI Text, Diffuse Scattering Along c* and Fig. S5). (E and G) Measured SL peaks at (1, −4.333, 0) and (2, −3.333, 0) as indicated by dashed yellow rectangles in C. (B, D, F, and H) Simulated diffraction patterns based on the charge stripe model shown in J. The size of the spots in B indicates the intensity. (I) Intensity along the line (h, −3, 0) at 95 K (blue circles) and 120 K (red squares). (J) Charge stripe model in real space. Yellow spheres represent areas of higher valence than the average 1.33+, and blue spheres represent areas of lower valence than the average 1.33+. Solid rectangles denote the charge stripe supercell.
Fig. S6.
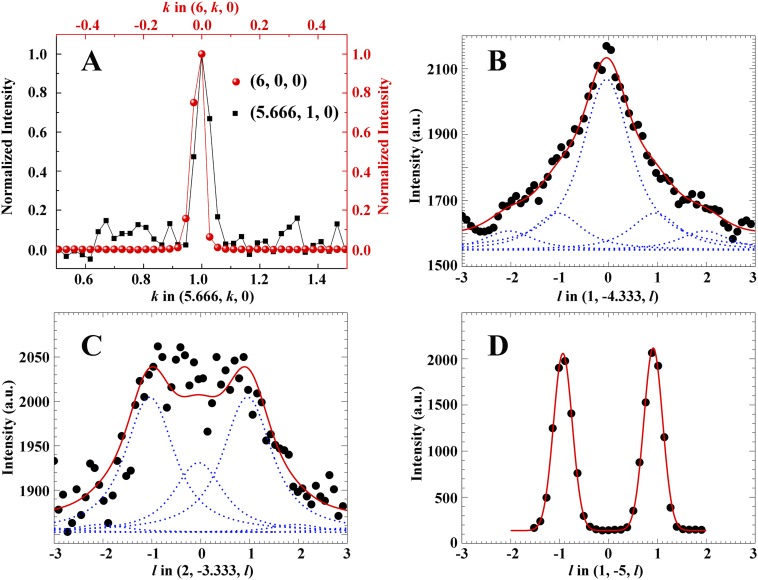
Peak shapes and correlation length. (A) Peak shapes of the SL peak (5.666, 1, 0) and the main Bragg peak (6, 0, 0) along the k direction. Because of the huge intensity ratio of the main Bragg and SL peaks, here, the main Bragg peak (6, 0, 0) is taken from a short time exposure, whereas the SL peak (5.666, 1, 0) is taken from a longer time exposure experiment with the other parameters the same. (B and C) Cuts through sets of SL reflections (1, −4.333, l) and (2, −3.333, l) and corresponding fit convolved with effective resolution function. All SL peak amplitudes in B and C were constrained in accordance with the structure factor calculations and also, constrained to have the same finite correlation length. Blue dots, decomposed peaks; red, overall fit. (D) A typical cut along l through main Bragg peaks.
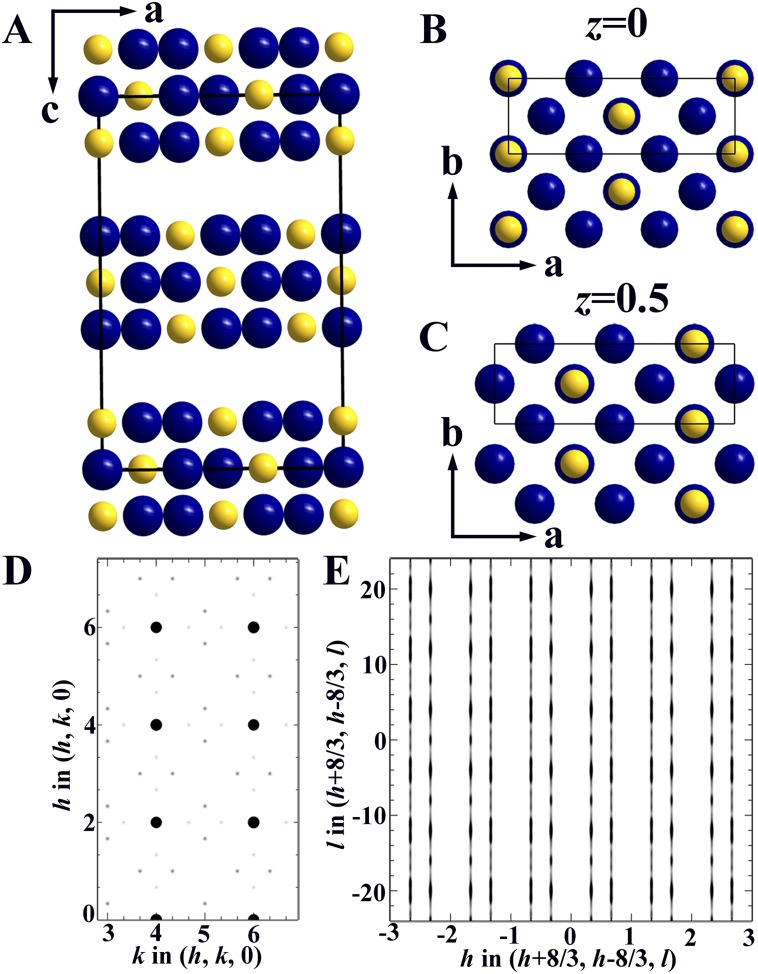
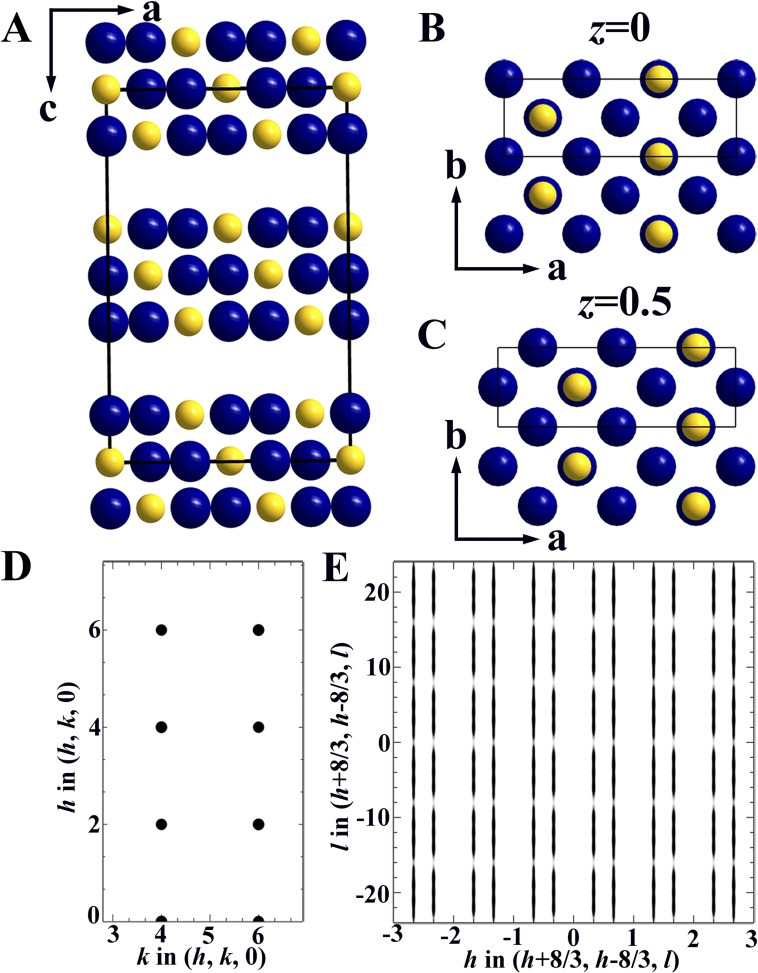
The distribution of positions and intensities of the SL reflections provides a means to assess the real space arrangement of the stripes (i.e., the intra- and interlayer charge stacking). Consider first the stacking of charges within the trilayer, a unique feature of La-438 vis-à-vis LSNO-1/3. Although Coulomb repulsion arguments favor a staggering of the charge from layer to layer, our diffraction data conclusively show that the charges are stacked in phase within the trilayer. Fig. 3 B and D shows simulations of the scattering from a stacked charge trilayer model assuming q = (2/3, 0, 1). This propagation vector produces a threefold diagonal stripe pattern in the ab plane oriented at 45° to the Ni-O bonds, which is in agreement with the observations. Intensity variation along c* takes maximum values at positions spaced by Δl = 8, a consequence of the c/8 spacing of the layers within a trilayer. Importantly, the maxima along c* appear at l = 8n, in agreement with the data presented in Fig. 3C. In contrast, a model in which the charges are staggered within the trilayer yields intensity maxima at l = 4 + 8n (SI Text, Charge Stripe Stacking Models and Fig. S7), inconsistent with the experimental data. Other stacking models were tested (SI Text, Charge Stripe Stacking Models and Figs. S8 and S9) but likewise, failed to match the observed scattering. Stacking of charge is counterintuitive within a framework of a simple electrostatic model. Indeed, charge stacking in manganites adopting the zig-zag CE charge, orbital, and magnetic ordered state was explained by invoking an intersite Coulomb repulsion of lesser importance than the kinetic energy (double exchange) and magnetic interactions along the Mn3+/Mn4+ stripes (21). In the case of the La-438 nickelate, a similar mechanism might apply. A free energy gain is possible from the d8 sites if they stack on top of one another, because their partially occupied 3z2 − r2 orbitals would generate a net bonding interaction along c. A related bonding picture was suggested by Pardo and Pickett (38), although their particular model should not exhibit the charge modulation found here.
Fig. S7.
Charge stripe model 2 and simulated diffraction patterns. (A) Charge stripe model in the ac plane. Yellow spheres represent areas of higher valence than the average 1.33+. Blue spheres represent areas of lower valence than the average 1.33+. Solid rectangle denotes the charge stripe supercell. (B) Charge distribution in the ab plane at z = 0. (C) Charge distribution in the ab plane at z = 0.5. (D) Calculated diffraction pattern in the (h, k, 0) plane. (E) Calculated diffraction pattern in the (h + 8/3, h − 8/3, l) plane.
Fig. S8.
Charge stripe model 3 and simulated diffraction patterns. (A) Charge stripe model in the ac plane. Yellow spheres represent areas of higher valence than the average 1.33+. Blue spheres represent areas of lower valence than the average 1.33+. Solid rectangle denotes the charge stripe supercell. (B) Charge distribution in the ab plane at z = 0. (C) Charge distribution in the ab plane at z = 0.5. (D) Calculated diffraction pattern in the (h, k, 0) plane. (E) Calculated diffraction pattern in the (h + 8/3, h − 8/3, l) plane.
Fig. S9.
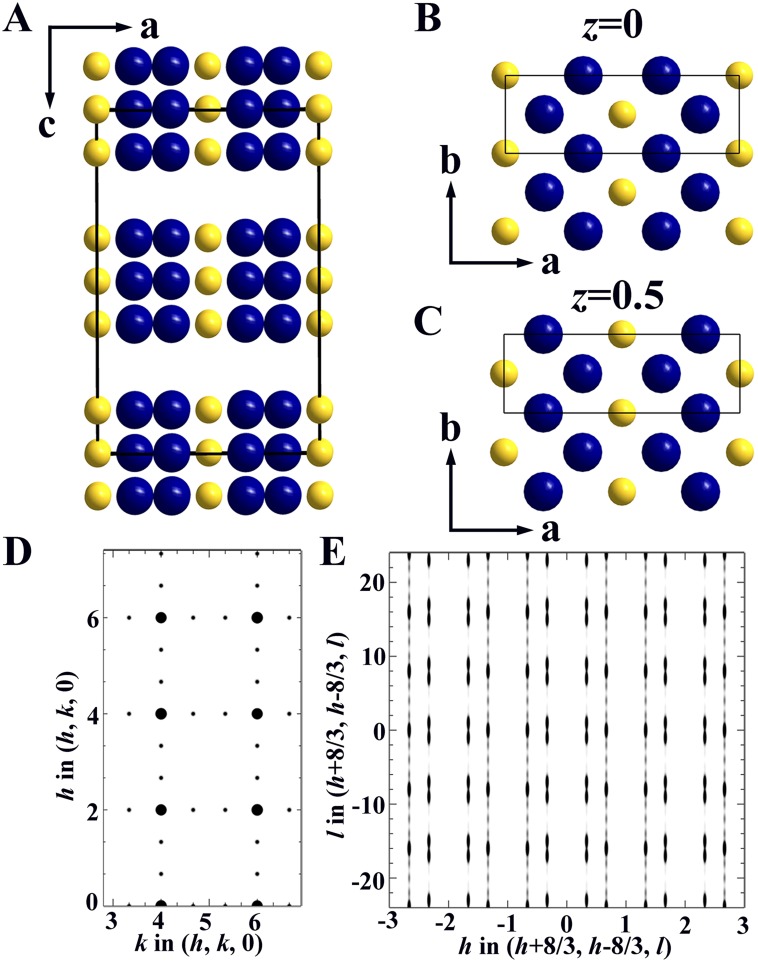
Charge stripe model 4 and simulated diffraction patterns. (A) Charge stripe model in the ac plane. Yellow spheres represent areas of higher valence than the average 1.33+. Blue spheres represent areas of lower valence than the average 1.33+. Solid rectangle denotes the charge stripe supercell. (B) Charge distribution in the ab plane at z = 0. (C) Charge distribution in the ab plane at z = 0.5. (D) Calculated diffraction pattern in the (h, k, 0) plane. (E) Calculated diffraction pattern in the (h + 8/3, h − 8/3, l) plane.
We turn now to the intertrilayer stacking of charges, which in single-layer LSNO-1/3, follows a body-centering pattern schematically shown in figure 3 in ref. 9 and figure 10C in ref. 18. This arrangement minimizes the Coulomb repulsion among the stripes. Our data indicate that La-438 adopts a competing ABAB stacking (A and B represent a trilayer) shown schematically in Fig. 3J. Fig. 3A shows that the SL spots in the hk0 plane have a nonuniform intensity distribution with reflections (h ± 1/3, k ± 1, 0) (and equivalents for the 90° rotated domain), where (h, k, 0) is an allowed reflection of F4/mmm, appearing more intense than those with index (h ± 2/3, k, 0). This distribution of intensity can be reproduced (Fig. 3B) by a model with ABAB stacking of the stripes along c, akin to that shown in figure 10B in ref. 18. Note that this ABAB stacking sequence permits even l reflections and thus, differs from the LSNO-1/3 stacking pattern in which bond- and site-centered stripes alternate along c, for which odd l reflections only are observed.
Additional support for the ABAB model can be found by interrogating the l dependence of the peak intensities. Fig. 3 E and G shows intensity plots along c* in the vicinity of the (1, −4.333, 0) and (2, −3.333, 0) SL reflections, respectively. Although both are broad, there is a clear qualitative difference in the appearance of these peaks: the former consists of a single maximum, whereas the latter appears as a poorly resolved doublet. The simulated patterns for these reflections are shown in Fig. 3 F and H and in good agreement with the corresponding data. Inspection of the simulated data in the absence of broadening shows that each peak is actually a triplet with intensity centered at l= −1, 0, 1. In the case of (1, −4.333, 0) and its equivalent SL reflections, the maximum intensity is located at l = 0, whereas for (2, −3.333, 0), the maximum intensity is located at l= −1 and 1. Hücker et al. (18) have pointed out that the difference between a double-period ABAB and a triple-period ABCABC stacking is set by the second neighbor interaction, which is expected to be weak. Because of the short correlation length of the charge stripes along c, it is almost certain that La-438 contains alternative stacking sequence faults (e.g., ABC and AA); the observed SL pattern in the (hk0) plane, however, guarantees that ABAB dominates. Although La-438 adopts a different stacking than that found in LSNO-1/3, the stacking of charge from trilayer to trilayer in the observed pattern likewise minimizes the Coulomb repulsion.
We have established that a real space ordering of charge is the underlying mechanism of the semiconductor to insulator transition in La-438. We also note that the related single-layer R-P nickelates as well as the cuprates typically exhibit spin stripes in addition to the charge stripes. Thus, it is reasonable to speculate that La-438 would likewise show similar behavior. In LSNO-1/3, the spins order at a lower temperature than the charge, which was evidenced by a signature in the magnetic susceptibility. The absence of such a signature in La-438 suggests that spin stripes, if they exist, order at the same temperature as the charge stripes. Testing for spin stripe ordering will require spin-polarized neutron measurements, because the in-plane wave vectors of the two orders are coincident for this three period case (6).
Conclusion
Our observations offer a fresh perspective on the ground state and origin of the phase transition in La-438. Primarily, we find that the low-temperature ground state of La-438 is a charge stripe ordered insulator, akin to those found in LSNO-1/3, and that this real space order into charge stripes is the cause of the semiconductor to insulator transition at 105 K. We find that this inhomogeneous charge distribution takes the form of stacked charge stripes within the trilayer, which then stagger between trilayers along c in an ABAB sequence. Thus, when framed solely within the context of a simple inverse-square law, La-438 adopts a paradoxical ground state, in which the Coulomb interaction is minimized at long distances but not at short range. Although a full quantitative understanding of this stripe organization will require theoretical input, one possibility is that bonding among partially occupied 3z2 − r2 orbitals within the trilayer, which favors locking the charge into this stacked pattern, outweighs the short-range electrostatic energy.
Additional confirmation of the connection between La-438 and LSNO nickelate physics will require understanding of the magnetic ground state of La-438, which should likewise exhibit the same in-plane wave vector; neutron and magnetic X-ray scattering measurements are planned to test this possibility. Finally, our single crystals provide a platform to address a broader set of questions about La-438, including orbital polarization and related questions regarding spin-state and ligand hole contribution. It may also be possible to dope electrons into these crystals to explore the impact on the charge ordered ground state.
Materials and Methods
Physical Properties.
Magnetic susceptibility measurements were performed on single crystals using a Quantum Design MPMS3 SQUID Magnetometer. Zero-field cooled and field cooled data in the ab plane and out of plane were collected between 1.8 and 300 K under an external field of 0.01, 0.1, 1.0, and 5.0 T. High-temperature (300–795 K) magnetic susceptibility data were collected on MPMS3 equipped with an oven under a magnetic field of 1.0 T. The electrical resistivity was measured in the ab plane of the La-438 single crystals under zero applied magnetic field using the standard four-probe alternating current (AC) technique on a Quantum Design Physical Properties Measurement System (PPMS). The heat capacity measurements were carried out in the PPMS using the relaxation method under magnetic fields of 0 and 9 T.
X-Ray Diffraction Experiments.
Single-crystal X-ray diffraction data were collected with an APEX2 Area Detector using synchrotron radiation (λ = 0.41328 Å) at beamline 15-ID-B at the APS, Argonne National Laboratory. A single crystal with dimensions of ∼5 μm on an edge was used to determine the structure at room temperature. To observe the SL peaks below the 105-K transition clearly, larger single crystals (∼20 μm on edge) and longer exposure times (e.g., 2.0 s/0.2°) were used. In this case, many Bragg peaks were found to overflow because of the limited dynamic range of the CCD detector (maximum 65,536) and the extreme intensity ratio of the Bragg/SL peaks (∼105). Several single crystals were used in this experiment, and the SL peaks are reproducible. Data were collected at room temperature first, and then, the samples were measured in the range of 90–200 K by flowing nitrogen gas and the range of 15–70 K by flowing helium gas; Φ scans were used, and 1,800 frames were collected for q-vector refinements.
Variable Temperature High-Resolution Powder X-Ray Diffraction.
High-resolution powder X-ray diffraction data were collected on pulverized La-438 crystals at beamline 11-BM (APS) in the range of 0.5° ≤ 2θ ≤ 36°, with a step size of 0.001° and step time of 0.2 s (SI Text, High-Resolution Powder X-Ray Diffraction).
Charge Stripe Ordering Simulations.
The structure factors for SL reflections were calculated by construction of SL unit cells with a modulation of charge imposed on the nickel sites, such that a charge disproportionation results in the ab plane. The stacking of stripes along the c axis is usually controlled by minimization of the Coulomb repulsion between the charge stripes (52, 53), leading to staggering, although other factors could lead to an alignment instead (21). Therefore, in the case of La-438, we tested the four most reasonable models: stacked/staggered stripes within a trilayer and stacked/staggered stripes between the trilayers (SI Text, Charge Stripe Stacking Models). Within each plane, we heuristically assign a valence of +1 or +2 for the nickel sites; thus, charge stripes run parallel to the b axis and perpendicular to the a axis with a … +1/+1/+2/+1/+1/+2 … pattern. Although only an approximation of the true charge state of the stripes, this approach allows for a qualitative comparison with the observed pattern of SL reflections and thus, provides insight into which models are consistent with experimental data and which can be eliminated. It is worth noting that the actual charge difference is almost certainly not one but rather, much smaller. This approximation only influences the scale factor linking the intensities of the main Bragg peaks and the SL peaks; it does not change the relative intensity distribution of the pattern, including the position of the maxima. We have applied a Lorentzian broadening along c* using the finite correlation length discussed in SI Text, Correlation Length. The following simplifications have been used: we have not included any lattice response, a real scattering length has been considered for each atom, no effort has been made to correct for the energy- or momentum-dependent scattering length, and Debye–Waller factors were not incorporated.
SI Text
Magnetization.
A Curie–Weiss analysis of the magnetic susceptibility in the paramagnetic phase could yield information regarding the effective magnetic moment and the strength and sign of the magnetic interactions. Fig. S1 shows the magnetic susceptibility of an La-438 single crystal on warming and cooling in the range of 300–795 K under a magnetic field of μ0H = 1 T collected on a Quantum Design MPMS3 SQUID Magnetometer equipped with an oven. A clear transition is observed at ∼600 K. On cycling, we observe irreversibility in the magnetization profile, confirming the report by Poltavets et al. (35) that La-438 decomposes above 623 K (350 °C). The coincidence of this decomposition reaction and the reported Curie temperature of Ni (∼620 K) makes it difficult to unambiguously establish that this magnetization profile reflects the presence of a metallic Ni impurity in the La-438 sample, which has been implicated in previous studies (35). However, it is clear from the data shown in Fig. S1 that a simple Curie–Weiss analysis of La-438 is not possible above the ordering temperature of Ni.
We also tried a different approach, which was to extract the magnetic susceptibility from a series of M(H) curves at various temperatures with the magnetic field oriented parallel and perpendicular to the ab plane. We found that, at low temperature (T < 50 K), hysteresis appears in M(H) curves, likely because of the aforementioned contamination of Ni nanoparticles. We tried to analyze the data following the assumption that the magnetization, as shown in Fig. S2 A–C, can be considered as a superposition of two components: a saturating component (notionally from Ni nanoparticles) and a linear in H paramagnetic signal arising from La-438. Thus, we operationally define the magnetic susceptibility of La-438 by linear fitting of the data between 5 and 7 T and calculate χ = dM/dH as the slope of this line. The results of this analysis are shown in Fig. S2D, where the La-438 phase transition is clearly seen. An attempt to fit the data to a Curie–Weiss form [χ = χ0 + C/(T − θ)] between 110 and 320 K (Fig. S2D, red curve) yields χ0 = 5.1(1) × 10−4 emu mol−1 Ni−1 Oe−1, C = 0.032(4) emu K mol−1 Ni−1 Oe−1, and θ = −34 ± 14 K. The value of C corresponds to an effective moment of μeff = 0.51(3) μB/Ni assuming g = 2. This value deviates substantially from the spin-only expectation of μeff = 1.4 μB/Ni for a 2:1 mixture of noninteracting Ni1+ (S = 1/2) and Ni2+ (S = 0) ions in square planar coordination.
We have considerable reservations about this simple analysis, however, even under the assumption that our correction for the Ni impurity contribution is appropriate. The data show a slight upturn above 350 K, indicative of a “background” of unknown origin being phenomenologically accounted for by χ0. Such a minimum has been reported in single-layer nickelates (54) and cuprates (55) and associated with the underlying square lattice antiferromagnet or pseudogap, respectively. Similar physics may be relevant in La-438, but because the values of C and θ are highly correlated to χ0, we are skeptical about the relevance of the above Curie–Weiss parameters to the intrinsic magnetism of La-438.
Heat Capacity.
Heat capacity of an La-438 single crystal was measured in a Quantum Design PPMS using the relaxation method under 0 and 9 T. As can be seen from Fig. S3, data measured at μ0H = 0 and 9 T are indistinguishable.
To estimate the entropy change of the transition, we attempted to subtract the La3Ni2O6 heat capacity data provided by K. Lokshin, University of Tennessee, Knoxville, TN, scaled by an appropriate ratio, but the agreement above and below the transition was poor. We have, thus, phenomenologically modeled the background as described in the text.
We also consider competing interpretations for the entropy change of the transition in La-438. (i) A fully AFM ordering of localized Ni1+ (S = 1/2; i.e., Ni2+ in a low-spin state with S = 0). In this case, one would expect 3.84 J mol−1 K−1 per Ni (2 × R × ln2 per formula unit), which exceeds the measured value by 94%, implying that either the transition cannot be from long-range magnetic ordering or ∼50% of the entropy has been removed in short-range ordering above the transition, a possibility in a low-dimensional material like La-438. (ii) AFM-type spin density wave (SDW). The expected entropy change at a weak-coupling SDW transition is on the order of 10−2 R ∼ 0.08 J mol−1 K−1 (50), which is far smaller than that observed in La-438 (e.g., in chromium ΔS ∼ 0.034 × R at the paramagnetic–AFM transition) (51). Thus, if an SDW is operative, additional df (e.g., structural) would be responsible for the vast majority of the entropy removed through the transition. (iii) LS-HS transition. There are two possible spin states in the trilayer compound S = 2, S = 1 (in terms of Ni triplets). Therefore, one can quantify the entropy of those states: Rln(2S + 1). The high-spin solution is based on molecular orbitals and has no orbital degeneracy; however, the S = 1 solution presents two electrons in three possible x2 − y2 orbitals (hence, that configuration has triple-orbital/site degeneracy). Thus, the entropy change in the transition from a low-temperature, high-spin state to a high-temperature, low-spin state should be Rln[3 × (2 × 1 + 1)] − Rln(2 × 2 + 1) = Rln(9/5) = 4.9 J mol−1 K−1 per formula unit or 1.63 J mol−1 K−1 per Ni. This value differs from the measured value by ∼18% but would leave only 0.35 J mol−1 K−1 per Ni for all other df, including charge, spin order, and structural order.
High-Resolution Powder X-Ray Diffraction.
High-resolution X-ray powder diffraction data were collected on pulverized La-438 crystals at beamline 11-BM at the APS. The sample was loaded into a Φ = 0.8 mm Kapton capillary tube that was spun continuously at 5,600 rpm during data collection. Diffraction patterns were recorded on cooling (λ = 0.414125 Å) at 300, 250, 200–150 (5-K interval), and 120–82 K (2-K interval). An Oxford Cryostream 700 Plus N2 Gas Blower was used to control the temperature, and the cooling rate was set to 5 K/min for 250 and 200–150 K and 1 K/min for 120–82 K. The temperature was stabilized for 2 min at each set point before data collection. Data were analyzed with the Rietveld method using the GSAS (56) software under the graphical interface EXPGUI (57). The background at each temperature was fit using a 20-term Chebyshev polynomial (function 1) and then, fixed. Refined parameters include scale factor, lattice parameters, atomic positions, isotropic atomic displacement parameters (Uiso; all atoms are grouped together), and profile shape parameters. Pseudo-Voigt functions with anisotropic microstrain broadening (function 4) (58) were used for the peak profiles. For the three-phase refinement of room temperature data, the corresponding profile parameters for each phase were constrained to be the same. The refinement of room temperature data, as shown in Fig. S4, converged at Rwp = 12.51%, Rp = 9.25%, and χ2 = 6.74 with weight fractions of 98.7%, 0.6%, and 0.7% for La-438, La3Ni2O6.35, and La2O3, respectively. The low-temperature data were refined using a single-phase model.
Single-Crystal X-Ray Diffraction.
Single-crystal X-ray diffraction data were collected at room temperature with an APEX2 Area Detector using synchrotron radiation (λ = 0.41328 Å) at beamline 15-ID-B at the APS, Argonne National Laboratory. A single crystal of La-438 with dimensions of ∼5 μm on an edge was attached to the tip of a glass fiber and mounted on the goniometer. Indexing was performed using Bruker APEX2 software (59). Data integration and cell refinement were performed using SAINT, and multiscan absorption corrections were applied using the SADABS program (59). The structure was solved by direct methods and refined with full matrix least squares methods on F2. All atoms were modeled using anisotropic ADPs, and the refinements converged for I > 2σ(I). Calculations were performed using the SHELXTL crystallographic software package (60). Details of crystal parameters, data collection, structure refinement, and atomic positions are summarized in Tables S1 and S2. Further details of the crystal structure investigation may be obtained from Fachinformationszentrum (FIZ) Karlsruhe (https://www.fiz-karlsruhe.de/en/leistungen/kristallographie/kristallstrukturdepot.html), using the Crystal Structure Depot (CSD) deposition number 429798.
Diffuse Scattering Along c*.
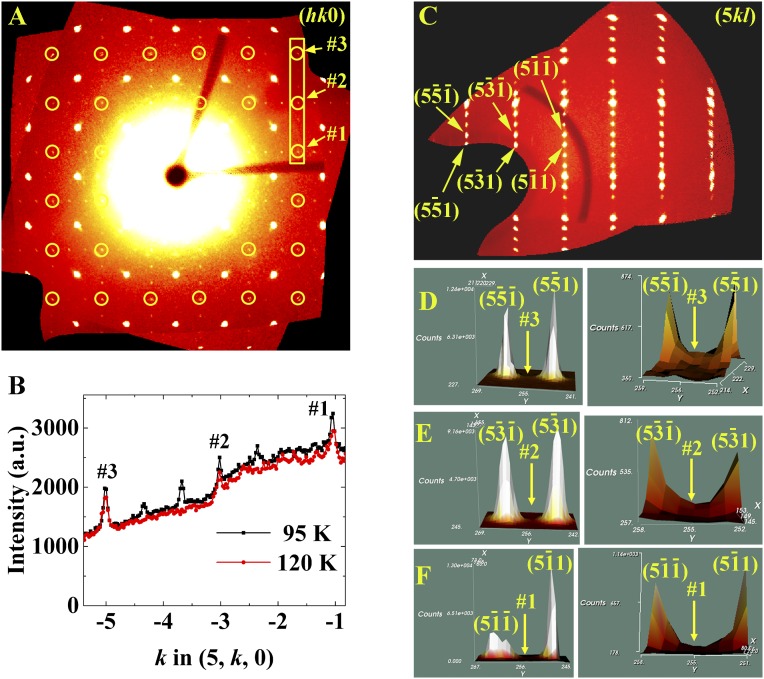
We noticed the presence of peaks in the hk0 plane that are forbidden by the F4/mmm symmetry of the high-temperature phase. Here, we show these “peaks” arise because of leakage of intensity from allowed Bragg reflections at positions (h, k, ±1). Fig. S5A shows a reconstructed hk0 reciprocal space plane of an La-438 crystal measured at 95 K using APEX2 (59). The yellow circles in Fig. S5A emphasize forbidden peaks, such as (50) (3), (50) (2), (50) (1). Fig. S5B shows a line cut of the peaks in the rectangular area shown in Fig. S5A; one can see clearly the three forbidden peaks (1–3) at 95 and 120 K. Fig. S5C shows a reconstructed 5kl plane at 95 K to check whether there is intensity for these forbidden peaks along the l direction. Fig. S5D shows the peaks (5) and (5), and an expanded picture of 3 is shown in Fig. S5D, Right. As can be seen, (5) and (5) are strong and allowed Bragg peaks, and the tails from these two neighboring peaks extend into the region of (5). We adjusted the sample detector distance but could not separate them adequately. Similar behavior is found for each forbidden peak as shown in Fig. S5A. This diffuse rod of intensity is observed as a spot in the hk0 plane but does not represent a true Bragg reflection that would indicate a lower average symmetry.
Fig. S5.
Diffuse scattering along c* in La-438. (A) Reconstructed hk0 planes (F4/mmm setting) at 95 K. (B) Intensity along the line (5, k, 0) at 95 (black squares) and 120 K (red circles). (C) Reconstructed 5kl reciprocal space planes at 95 K and (D–F) 3D plots around the forbidden peaks. Note that the units of X and Y in D–F axes are detector pixels.
Correlation Length.
In principle, the anisotropic correlation lengths associated with the charge modulation in the stripe ordered phase can be determined through analysis of the peak width of the SL reflections along different directions. It is important to note that the main (i.e., non-SL) Bragg reflections for the La-438 crystal are significantly broader than the instrumental resolution—a consequence of a broadening of the crystal mosaic as well as strain that likely arises, at least in part, during the reduction process. It is, therefore, essential to compare the observed peak width of the main reflections with those of the SL reflections.
Fig. S6A shows a comparison of the peak shape of a representative SL peak and representative main Bragg peak along the k direction (i.e., in plane), with the background subtracted and the peak heights normalized to the same value. It is apparent that the peaks are of similar width and that the data are insufficient to conclude that there is a finite size broadening in plane. Fig. S6 B and C shows cuts through sets of SL reflections along (1, −4.333, l) and (2, −3.333, l), respectively (These cuts correspond to l cuts from Fig. 3 G and H.) Note that these cuts contain several SL reflections that are not resolved from one another because of their broad width. Fig. S6D also shows a cut along l through a representative main Bragg peak. Although this peak is broader than the instrumental resolution, it can be considered as an effective resolution function for the crystal that accounts for its mosaic. Based on the structure factor calculation from the model in the text, an intrinsically Lorentzian-broadened peak shape was applied to all SL peaks in the cuts in Fig. S6 B and C, and the data in these cuts were fit with this peak shape convolved with the effective resolution function. All SL peak amplitudes were constrained in accordance with the structure factor calculations and also, constrained to have the same finite correlation length, which corresponds to the inverse of the half-width at half-maximum of the Lorentzian, in accordance with an Ornstein–Zernike correlation function. A scaling factor was applied between Fig. S6 B and C. The fitting indicates several important findings. First, the structure factors are in striking accord with the calculations. Second, the individual SL peaks (indicated by dashed blue lines in Fig. S6 B and C) are clearly broader than the effective resolution shown in Fig. S6D. The analysis provides an estimate of the correlation length of 8 Å, which roughly corresponds to the distance between neighboring Ni-O trilayer blocks.
We note that, although the analysis above provides an estimate of the correlation length, the precession image data are not ideal for this analysis. Future work on crystals possessing the best mosaics will be undertaken on a point detector system, which can provide a more suitable platform for such measurements. Furthermore, the data in Fig. S6D were measured from a short measurement on a smaller crystal than those in Fig. S6 B and C because of oversaturation of the detector pixels in the SL measurements. Nevertheless, widths of the main Bragg peaks for the two crystals are certainly within 20% of one another, and we have found that this does not appreciably affect the rest of the analyses presented above.
Charge Stripe Stacking Models.
To understand the charge stripe arrangement in La-438, we studied several models. Although there could be other possibilities, we list here those that we consider most reasonable.
Model 1. This model has in-phase stacking within each trilayer as presented in the text and Fig. 3J. It is characterized by two sets of SL reflections (weaker and stronger) around each of the main Bragg peaks in the hk0 plane, and indeed, both sets are observed in the data shown in Fig. 3A. Importantly, maxima in the structure factors are predicted for l = 8n, where n is an integer, in accordance with the observations shown in Fig. 3C. Among those tested, this model seems to be the best description for La-438.
Model 2. In this model, shown in Fig. S7, the charges are not stacked in phase within each trilayer. Instead, the charge in the center layer of each trilayer is shifted along a with respect to the top and bottom layers within the same trilayer. This pattern generates sets of SL maxima centered at l = 4 + 8n, where n is an integer, which is at odds with the observations of maxima at l = 8n.
Model 3. In this model, shown in Fig. S8, the top, middle, and bottom layers within each trilayer possess stripes that are shifted with respect to one another. This model differs from observation, because it generates zero intensity for SL reflections in the hk0 plane.
Model 4. In this model, shown in Fig. S9, charges are stacked in phase within each trilayer like in model 1. The trilayer containing the z = 0 plane is exactly the same as its counterpart in model 1; however, the charges in the z = 0.5 layer are shifted along Ni-O-Ni bond direction by one Ni-Ni distance with respect to that in model 1. In this way, the stripes in the z = 0 and z = 0.5 trilayers appear stacked when a projection is viewed along b. This model does not reproduce all of the observed SL reflections in the hk0 plane. Specifically, it generates only four SL peaks around each main Bragg reflection as shown in Fig. S9D.
Acknowledgments
We thank Mr. Wenyang Gao for his help with the synchrotron X-ray single-crystal measurements at 15-ID-B; Dr. Mati Meron for his help on instrument resolution determination; Dr. Saul Lapidus for his help with the high-resolution X-ray powder diffraction at 11-BM; and Drs. V. Pardo, W. E. Pickett, J. W. Freeland, S. Rosenkranz, A. S. Botana, Y. Ren, and C. D. Malliakas for helpful discussions. This work was supported by the US Department of Energy, Office of Science, Basic Energy Sciences, Materials Science and Engineering Division. ChemMatCARS Sector 15 is principally supported by the Divisions of Chemistry (CHE) and Materials Research (DMR), National Science Foundation, under Grant NSF/CHE-1346572. Use of the Advanced Photon Source, an Office of Science User Facility operated for the US Department of Energy (DOE) Office of Science by Argonne National Laboratory, was supported by the US DOE under Contract DE-AC02-06CH11357.
Footnotes
The authors declare no conflict of interest.
This article is a PNAS Direct Submission.
Data deposition: The structural data of La4Ni3O8 have been deposited in the Inorganic Crystal Structure Database (Crystal Structure Depot no. 429798). Further details of the crystal structure investigation may be obtained from Fachinformationszentrum Karlsruhe, https://www.fiz-karlsruhe.de/en/leistungen/kristallographie/kristallstrukturdepot.html.
This article contains supporting information online at www.pnas.org/lookup/suppl/doi:10.1073/pnas.1606637113/-/DCSupplemental.
References
- 1.Goodenough JB. Electronic and ionic transport properties and other physical aspects of perovskites. Rep Prog Phys. 2004;67(11):1915–1993. [Google Scholar]
- 2.Imada M, Fujimori A, Tokura Y. Metal-insulator transitions. Rev Mod Phys. 1998;70(4):1039–1263. [Google Scholar]
- 3.Austin IG, Mott NF. Metallic and nonmetallic behavior in transition metal oxides. Science. 1970;168(3927):71–77. doi: 10.1126/science.168.3927.71. [DOI] [PubMed] [Google Scholar]
- 4.Goodenough JB. Perspective on engineering transition-metal oxides. Chem Mater. 2014;26(1):820–829. [Google Scholar]
- 5.Coey M. Condensed-matter physics: Charge-ordering in oxides. Nature. 2004;430(6996):155–157. doi: 10.1038/430155a. [DOI] [PubMed] [Google Scholar]
- 6.Ulbrich H, Braden M. Neutron scattering studies on stripe phases in non-cuprate materials. Physica C. 2012;481(1):31–45. [Google Scholar]
- 7.Tranquada JM. Spins, stripes, and superconductivity in hole-doped cuprates. AIP Conf Proc. 2013;1550(1):114–187. [Google Scholar]
- 8.Zaliznyak IA, Tranquada JM, Gu G, Erwin RW, Moritomo Y. Universal features of charge and spin order in a half-doped layered perovskite. J Appl Phys. 2004;95(11):7369–7371. [Google Scholar]
- 9.Tranquada JM. Stripe correlations of spins and holes in cuprates and nickelates. Ferroelectrics. 1996;177(1):43–57. [Google Scholar]
- 10.Boothroyd AT, Babkevich P, Prabhakaran D, Freeman PG. An hour-glass magnetic spectrum in an insulating, hole-doped antiferromagnet. Nature. 2011;471(7338):341–344. doi: 10.1038/nature09902. [DOI] [PubMed] [Google Scholar]
- 11.Cwik M, et al. Magnetic correlations in La2-xSrxCoO4 studied by neutron scattering: Possible evidence for stripe phases. Phys Rev Lett. 2009;102(5):057201. doi: 10.1103/PhysRevLett.102.057201. [DOI] [PubMed] [Google Scholar]
- 12.Sakiyama N, Zaliznyak IA, Lee SH, Mitsui Y, Yoshizawa H. Doping-dependent charge and spin superstructures in layered cobalt perovskites. Phys Rev B. 2008;78(18):180406. [Google Scholar]
- 13.Comin R, et al. Superconductivity. Broken translational and rotational symmetry via charge stripe order in underdoped YBa₂Cu₃O6+y. Science. 2015;347(6228):1335–1339. doi: 10.1126/science.1258399. [DOI] [PubMed] [Google Scholar]
- 14.Abbamonte P, et al. Spatially modulated ‘Mottness’ in La2-xBaxCuO4. Nat Phys. 2005;1(3):155–158. [Google Scholar]
- 15.Vojta M, Vojta T, Kaul RK. Spin excitations in fluctuating stripe phases of doped cuprate superconductors. Phys Rev Lett. 2006;97(9):097001. doi: 10.1103/PhysRevLett.97.097001. [DOI] [PubMed] [Google Scholar]
- 16.Ikeda Y, et al. Transport and thermodynamic studies of stripe and checkerboard ordering in layered nickel oxides R2−xSrxNiO4 (R = La and Nd) J Phys Soc Jpn. 2015;84(2):023706. [Google Scholar]
- 17.Anissimova S, et al. Direct observation of dynamic charge stripes in La2-xSrxNiO4. Nat Commun. 2014;5:3467. doi: 10.1038/ncomms4467. [DOI] [PubMed] [Google Scholar]
- 18.Hücker M, et al. Unidirectional diagonal order and three-dimensional stacking of charge stripes in orthorhombic Pr1.67Sr0.33NiO4 and Nd1.67Sr0.33NiO4. Phys Rev B. 2006;74(8):085112. [Google Scholar]
- 19.Lee SH, Cheong SW. Melting of quasi-two-dimensional charge stripes in La5/3Sr1/3NiO4. Phys Rev Lett. 1997;79(13):2514–2517. [Google Scholar]
- 20.Ulbrich H, et al. Evidence for charge orbital and spin stripe order in an overdoped manganite. Phys Rev Lett. 2011;106(15):157201. doi: 10.1103/PhysRevLett.106.157201. [DOI] [PubMed] [Google Scholar]
- 21.Popović Z, Satpathy S. Charge stacking in the half-doped manganites. J Appl Phys. 2002;91(10):8132–8134. doi: 10.1103/PhysRevLett.88.197201. [DOI] [PubMed] [Google Scholar]
- 22.Sun Z, et al. Localization of electrons due to orbitally ordered bi-stripes in the bilayer manganite La2-2xSr1+2xMn2O7 (x ∼ 0.59) Proc Natl Acad Sci USA. 2011;108(29):11799–11803. doi: 10.1073/pnas.1018604108. [DOI] [PMC free article] [PubMed] [Google Scholar]
- 23.Abeykoon AMM, et al. Evidence for short-range-ordered charge stripes far above the charge-ordering transition in La1.67Sr0.33NiO4. Phys Rev Lett. 2013;111(9):096404. doi: 10.1103/PhysRevLett.111.096404. [DOI] [PubMed] [Google Scholar]
- 24.Woo H, et al. Mapping spin-wave dispersions in stripe-ordered La2-xSrxNiO4 (x=0.275, 0.333) Phys Rev B. 2005;72(6):064437. [Google Scholar]
- 25.Yoshizawa H, et al. Stripe order at low temperatures in La2-xSrxNiO4 with 0.289≤x≤0.5. Phys Rev B. 2000;61(2):R854–R857. [Google Scholar]
- 26.Zachar O, Kivelson SA, Emery VJ. Landau theory of stripe phases in cuprates and nickelates. Phys Rev B. 1998;57(3):1422–1426. [Google Scholar]
- 27.Cheong SW, et al. Charge-ordered states in (La,Sr)2NiO4 for hole concentrations nh=1/3 and 1/2. Phys Rev B. 1994;49(10):7088–7091. doi: 10.1103/physrevb.49.7088. [DOI] [PubMed] [Google Scholar]
- 28.Chen CH, Cheong SW, Cooper AS. Charge modulations in La2-xSrxNiO4+y: Ordering of polarons. Phys Rev Lett. 1993;71(15):2461–2464. doi: 10.1103/PhysRevLett.71.2461. [DOI] [PubMed] [Google Scholar]
- 29.Anisimov VI, Bukhvalov D, Rice TM. Electronic structure of possible nickelate analogs to the cuprates. Phys Rev B. 1999;59(12):7901–7906. [Google Scholar]
- 30.Poltavets VV, et al. La3Ni2O6: A new double T′-type nickelate with infinite Ni1+/2+O2 layers. J Am Chem Soc. 2006;128(28):9050–9051. doi: 10.1021/ja063031o. [DOI] [PubMed] [Google Scholar]
- 31.ApRoberts-Warren N, et al. NMR evidence for spin fluctuations in the bilayer nickelate La3Ni2O6. Phys Rev B. 2013;88(7):075124. [Google Scholar]
- 32.Lacorre P. Passage from T-type to T′-type arrangement by reducing R4Ni3O10 to R4Ni3O8 (R = La, Pr, Nd) J Solid State Chem. 1992;97(2):495–500. [Google Scholar]
- 33.Retoux R, Rodriguez-Carvajal J, Lacorre P. Neutron diffraction and TEM studies of the crystal structure and defects of Nd4Ni3O8. J Solid State Chem. 1998;140(2):307–315. [Google Scholar]
- 34.Poltavets VV, et al. Crystal structures of Ln4Ni3O8 (Ln = La, Nd) triple layer T′-type nickelates. Inorg Chem. 2007;46(25):10887–10891. doi: 10.1021/ic701480v. [DOI] [PubMed] [Google Scholar]
- 35.Poltavets VV, et al. Bulk magnetic order in a two-dimensional Ni1+/Ni2+ (d9/d8) nickelate, isoelectronic with superconducting cuprates. Phys Rev Lett. 2010;104(20):206403. doi: 10.1103/PhysRevLett.104.206403. [DOI] [PubMed] [Google Scholar]
- 36.ApRoberts-Warren N, et al. Critical spin dynamics in the antiferromagnet La4Ni3O8 from 139La nuclear magnetic resonance. Phys Rev B. 2011;83(1):014402. [Google Scholar]
- 37.Cheng JG, et al. Pressure effect on the structural transition and suppression of the high-spin state in the triple-layer T′-La4Ni3O8. Phys Rev Lett. 2012;108(23):236403. doi: 10.1103/PhysRevLett.108.236403. [DOI] [PubMed] [Google Scholar]
- 38.Pardo V, Pickett WE. Quantum confinement induced molecular correlated insulating state in La4Ni3O8. Phys Rev Lett. 2010;105(26):266402. doi: 10.1103/PhysRevLett.105.266402. [DOI] [PubMed] [Google Scholar]
- 39.Sarkar S, Dasgupta I, Greenblatt M, Saha-Dasgupta T. Electronic and magnetic structures of bilayer La3Ni2O6 and trilayer La4Ni3O8 nickelates from first principles. Phys Rev B. 2011;84(18):180411. [Google Scholar]
- 40.Liu T, et al. Electronic structure and magnetism of La4Ni3O8 from first principles. J Phys Condens Matter. 2012;24(40):405502. doi: 10.1088/0953-8984/24/40/405502. [DOI] [PubMed] [Google Scholar]
- 41.Pardo V, Pickett WE. Pressure-induced metal-insulator and spin-state transition in low-valence layered nickelates. Phys Rev B. 2012;85(4):045111. [Google Scholar]
- 42.Hua W. Charge–spin–orbital states in the tri-layered nickelate La4Ni3O8: An ab initio study. New J Phys. 2013;15(2):023038. [Google Scholar]
- 43.Liu T, et al. Dimensionality-induced insulator-metal crossover in layered nickelates Lan+1NinO2n+2 (n = 2, 3, and ∞) AIP Adv. 2014;4(4):047132. [Google Scholar]
- 44.Lokshin K, Egami T. 2011 Structure and Electronic Properties of the La4Ni3O8. Available at meetings.aps.org/link/BAPS.2011.MAR.T23.11. Accessed July 11, 2016.
- 45.Lee KW, Pickett WE. Infinite-layer LaNiO2: Ni+ is not Cu2+ Phys Rev B. 2004;70(16):165109. [Google Scholar]
- 46.Ling CD, Argyriou DN, Wu G, Neumeier JJ. Neutron diffraction study of La3Ni2O7: Structural relationships among n=1, 2, and 3 phases Lan+1NinO3n+1. J Solid State Chem. 2000;152(2):517–525. [Google Scholar]
- 47.Li J, Zhu Y, Tranquada JM, Yamada K, Buttrey DJ. Transmission-electron-microscopy study of charge-stripe order in La1.725Sr0.275NiO4. Phys Rev B. 2003;67(1):012404. [Google Scholar]
- 48.Hayward MA, Green MA, Rosseinsky MJ, Sloan J. Sodium hydride as a powerful reducing agent for topotactic oxide deintercalation: Synthesis and characterization of the nickel(I) oxide LaNiO2. J Am Chem Soc. 1999;121(38):8843–8854. [Google Scholar]
- 49.Klingeler R, Büchner B, Cheong SW, Hücker M. Weak ferromagnetic spin and charge stripe order in La5/3Sr1/3NiO4. Phys Rev B. 2005;72(10):104424. [Google Scholar]
- 50.Ramirez AP, Gammel PL, Cheong SW, Bishop DJ, Chandra P. Charge modulation in La1.67Sr0.33NiO4: A bulk thermodynamic study. Phys Rev Lett. 1996;76(3):447–450. doi: 10.1103/PhysRevLett.76.447. [DOI] [PubMed] [Google Scholar]
- 51.Fawcett E, Alberts HL, Galkin VY, Noakes DR, Yakhmi JV. Spin-density-wave antiferromagnetism in chromium alloys. Rev Mod Phys. 1994;66(1):25–127. [Google Scholar]
- 52.Wochner P, Tranquada JM, Buttrey DJ, Sachan V. Neutron-diffraction study of stripe order in La2NiO4+δ (δ=2/15) Phys Rev B. 1998;57(2):1066–1078. [Google Scholar]
- 53.Tranquada JM, Buttrey DJ, Sachan V. Incommensurate stripe order in La2-xSrxNiO4 with x=0.225. Phys Rev B. 1996;54(17):12318–12323. doi: 10.1103/physrevb.54.12318. [DOI] [PubMed] [Google Scholar]
- 54.Kato M, Maeno Y, Fujita T. Two-dimensional antiferromagnetic correlation with spin 1/2 in magnetic susceptibility of (La, Sr)2NiO4. Physica C. 1991;176(4):533–540. [Google Scholar]
- 55.Lubashevsky Y, Keren A. Experimental investigation of the origin of the crossover temperature in cuprate superconductors via dc magnetic susceptibility. Phys Rev B. 2008;78(2):020505. [Google Scholar]
- 56.Larson AC, Von Dreele RB. 2004. General Structure Analysis System (GSAS) (Los Alamos National Laboratory, Los Alamos, NM), Tech Rep LAUR 86-748.
- 57.Toby BH. EXPGUI, a graphical user interface for GSAS. J Appl Crystallogr. 2001;34(2):210–213. [Google Scholar]
- 58.Stephens PW. Phenomenological model of anisotropic peak broadening in powder diffraction. J Appl Crystallogr. 1999;32(2):281–289. [Google Scholar]
- 59.Bruker AXS, Inc. APEX2. Bruker AXS, Inc.; Madison, WI: 2014. [Google Scholar]
- 60.Bruker AXS, Inc. SHELXTL. Bruker AXS, Inc.; Madison, WI: 2014. [Google Scholar]


