Significance
Monitoring ocean surface winds is essential for understanding ocean and atmosphere interactions and weather forecasts. However, wind measured by satellite scatterometers and buoys are spatially and temporally coarse, particularly in coastal areas. We deployed small global positioning system units on soaring seabirds to record their tracks. Seabirds were accelerated by tail winds or slowed down by head winds during flight, so their flight speed changed in relation to wind speed and direction. Taking advantage of these changes in flight speed, we reliably estimated wind speed and direction experienced by the seabirds. The wind observed by soaring seabird’s tracks complemented the conventional observation gaps in terms of both time and space, suggesting the possibility of using soaring seabirds as a living anemometer.
Keywords: biologging, dynamic soaring, satellite scatterometer, GPS, meteorology
Abstract
Ocean surface winds are an essential factor in understanding the physical interactions between the atmosphere and the ocean. Surface winds measured by satellite scatterometers and buoys cover most of the global ocean; however, there are still spatial and temporal gaps and finer-scale variations of wind that may be overlooked, particularly in coastal areas. Here, we show that flight paths of soaring seabirds can be used to estimate fine-scale (every 5 min, ∼5 km) ocean surface winds. Fine-scale global positioning system (GPS) positional data revealed that soaring seabirds flew tortuously and ground speed fluctuated presumably due to tail winds and head winds. Taking advantage of the ground speed difference in relation to flight direction, we reliably estimated wind speed and direction experienced by the birds. These bird-based wind velocities were significantly correlated with wind velocities estimated by satellite-borne scatterometers. Furthermore, extensive travel distances and flight duration of the seabirds enabled a wide range of high-resolution wind observations, especially in coastal areas. Our study suggests that seabirds provide a platform from which to measure ocean surface winds, potentially complementing conventional wind measurements by covering spatial and temporal measurement gaps.
Recently, remote-sensing systems used to record atmospheric circulation have been developed. Satellite-borne scatterometers estimate ocean surface wind velocities each day covering the majority of the global ocean. These wide-range wind data in combination with refined ocean models are used in numerical weather predictions and describe the oceanographic features more accurately (1–3). Buoys scattered over the ocean also measure fine-time resolution in situ surface winds and are used in validating remote-sensing measurements and are assimilated into model analyses (4, 5). However, because wind data are only acquired twice per day by each satellite and buoys have limited spatial coverage, finer-scale changes of hours to days in local wind conditions could be overlooked. In addition, in coastal areas, where high biological productivity is associated with ocean and atmosphere circulation patterns (6), wind data are lacking due to variations in wind and wave caused by complex topographic effects that satellites have difficulty measuring (5, 7, 8). Obtaining in situ high-resolution atmospheric and oceanographic data to fill these spatial and temporal observation gaps would deepen our understanding of physical processes relevant to interactions between the atmosphere and ocean, contribute to improved atmospheric and ocean model analyses (7, 8), and reveal detailed structure that remains unresolved by using conventional methods (9).
The recent development of miniaturized animal-borne data loggers presented a capability to use animals as indicators of environmental variables. The extensive movement range and locomotion ability of marine mammals and seabirds enable observations to be obtained in places and scales unresolved by conventional observations. For example, instrumented seals have been providing temperature and salinity profiles in the Antarctic Ocean for more than 10 y, especially under sea ice coverage that was difficult to measure by conventional methods (10, 11). Adding these data to ocean circulation models improved the accuracy of estimated mixed layer properties (12). Bird-borne sensors are also used in measuring environmental variables such as temperature, depth, and light intensity directly from the instruments carried by the animal (13–16). Besides direct measurement from animal-borne instruments, indirect evaluation of flow velocity can be made particularly when animal movements are passively driven or strongly affected by the flow. Studies have evaluated velocity of air and water flows from bird movement trajectories, which is the consequence of bird movement itself and the drift caused by the flow. For example, wind velocity and the state of a bird in relation to the wind can be evaluated using circular statistical models (17). Three-dimensional flight paths of thermal soaring raptors have been used to estimate the horizontal and vertical component of wind in the mountain regions and agreed with measurements from meteorological stations (18). Furthermore, movements of shearwaters floating on the ocean surface were used to derive high-resolution ocean surface currents that matched with in situ and remote-sensing measurements of currents (19). These seabird-derived current data were assimilated into ocean models, resulting in refinement of the gyre patterns represented by the model (20). These studies demonstrate the potential of animal-derived environmental data in meteorological observations.
Here, we propose a simple method to use soaring seabirds as a bioindicator to estimate ocean surface winds. We deployed global positioning system (GPS) units on the backs of three species of soaring seabirds, streaked shearwater (Calonectris leucomelas; mean body mass, 0.6 kg), Laysan albatross (Phoebastria immutabilis; 3.1 kg), and wandering albatross (Diomedea exulans; 9.7 kg) to investigate fine-scale flight trajectories by recording one position per second. We further estimated wind velocities from the flight trajectories of the birds, taking advantage of the ground speed change caused by wind resistance and assistance. We examined the accuracy of the bird-based wind velocity estimations and discuss possible effects of a bird’s flight strategy to the wind estimation.
Estimating Ocean Surface Wind Using Soaring Seabirds
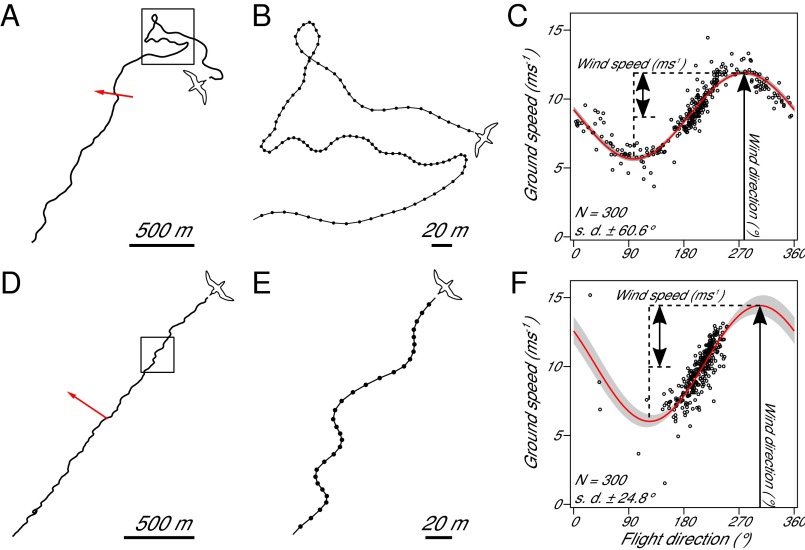
We obtained a total of 353, 74, and 185 h of positional data from streaked shearwaters (27.2 12.9 h, n = 13), Laysan albatrosses (37.1 4.0 h, n = 2), and wandering albatrosses (46.3 1.2 h, n = 4), respectively. Flight paths of shearwaters and albatrosses showed a tortuous pattern in fine-scale movement on the order of several tens of meters and ground speed fluctuated during flight (Fig. 1). We assumed that the fine-scale ground speed of soaring seabirds was mainly affected by wind along the flight direction of the bird (21, 22). According to this assumption, the ground speed of a bird would be maximized in tail winds and equals the sum of air speed and wind speed, whereas it would be minimized in head winds and equals the wind speed subtracted from air speed. In side winds, ground speed increases as the tail wind component increases. By fitting a sinusoidal curve to the relationship between ground speed and flight direction of each 5-min (301 positional fix) section of flight (Fig. 1 C and F, and Materials and Methods), we were able to estimate the ground speed in pure head and tail winds, even in sections where the birds experienced neither pure head nor tail winds (Fig. 1F). We regarded wind speed as one-half the difference between maximum and minimum ground speed values, and wind direction as the direction at the maximum ground speed of the fitted sinusoidal curve of each sections (Fig. 1 C and F, and Materials and Methods). The 5-min interval of the analysis sections was a consequence of the trade-off between the need for sufficient numbers of data points to estimate wind while keeping high temporal resolution. It is also comparable to 10-min to 1-h interval of in situ measurement from buoys and weather stations. The advantage of using these seabirds is the characteristic dynamic soaring flight, which relies heavily on the energy extracted from wind (23, 24), indicating the strong influence of wind velocity to their ground speed. This flight strategy results in a tortuous trajectory including more than 10 soaring cycles of 10–20 s, providing sufficient variation of flight direction in a short time period that enabled a successful fitting of a sinusoidal curve (Fig. 1 C and F, and Materials and Methods), even when the bird seemed to fly in a certain direction over a large scale (Fig. 1 D and E). We avoided erroneous estimation of wind when there was no relationship between ground speed and flight direction due to ambiguous flight behavior, although it excluded only under 3% of wind estimation (Materials and Methods).
Fig. 1.
(A) An example of a 5-min section of the flight path of a streaked shearwater. The red arrow indicates the estimated wind velocity. (B) Enlarged view of a meandering path shown in A. (D) Another example of a 5-min section of a flight path of a streaked shearwater when the bird seemed to travel in a certain direction. (E) Enlarged view of D showing repeated zigzag movement from a soaring maneuver. (C and F) The relationship between flight direction and ground speed of the path section in A [estimated wind speed of fitted curve, 3.11 ms−1; upper confidence interval (CI), 3.13 ms−1; and lower CI, 3.10 ms−1; estimated wind direction of fitted curve, 278°; upper CI, 280°; and lower CI, 277°] and D (estimated wind speed of fitted curve, 4.20 ms−1; upper CI, 4.34 ms−1; and lower CI, 4.10 ms−1; estimated wind direction of fitted curve, 304°; upper CI, 310°; and lower CI, 298°), respectively. Angular SDs of the flight direction are (C) 60.6° and (F) 24.8°, respectively. The red curve is the fitted sinusoidal curve. Gray area represents the 95% CI of the fitted sinusoidal curve. Estimated wind speed and direction is indicated by black arrows.
Results and Discussion
Bird-Based Winds Were Correlated with Satellite-Based Wind Measurements.
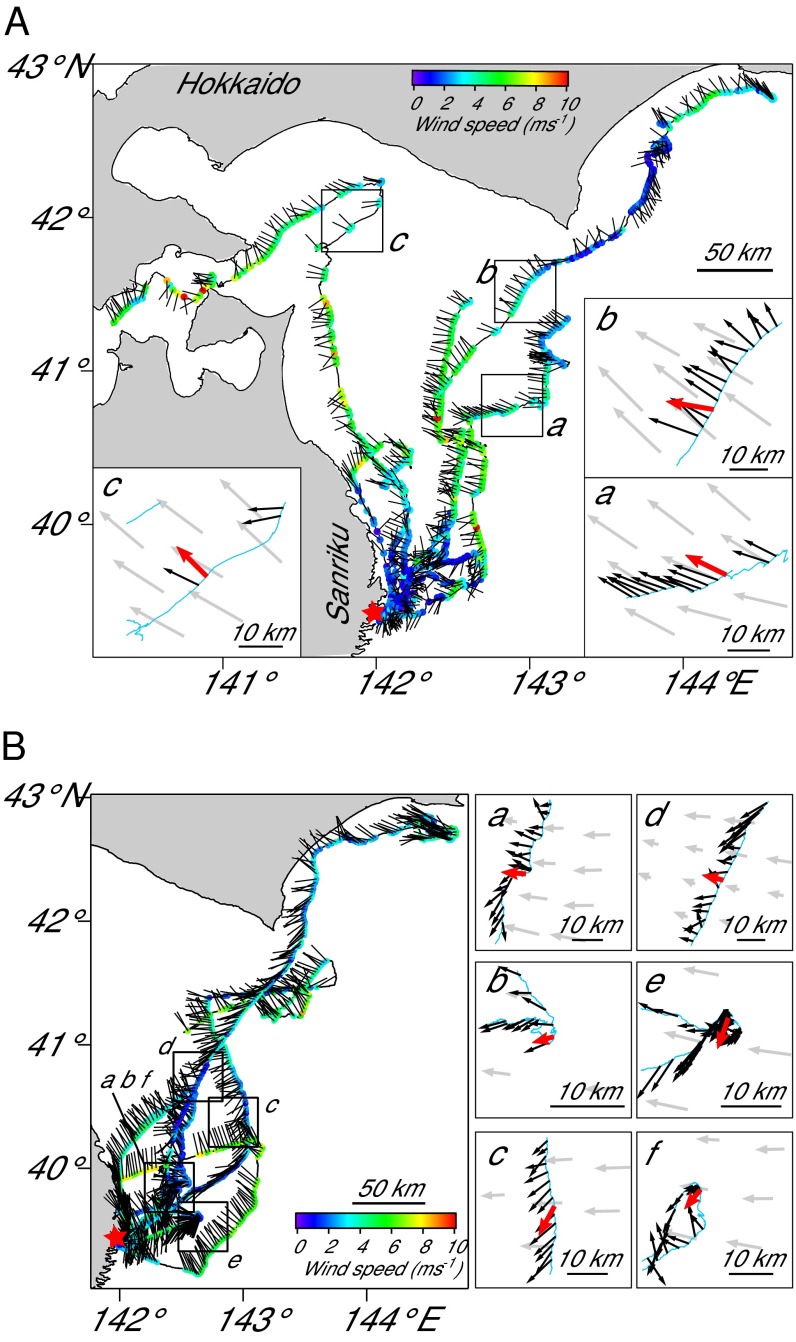
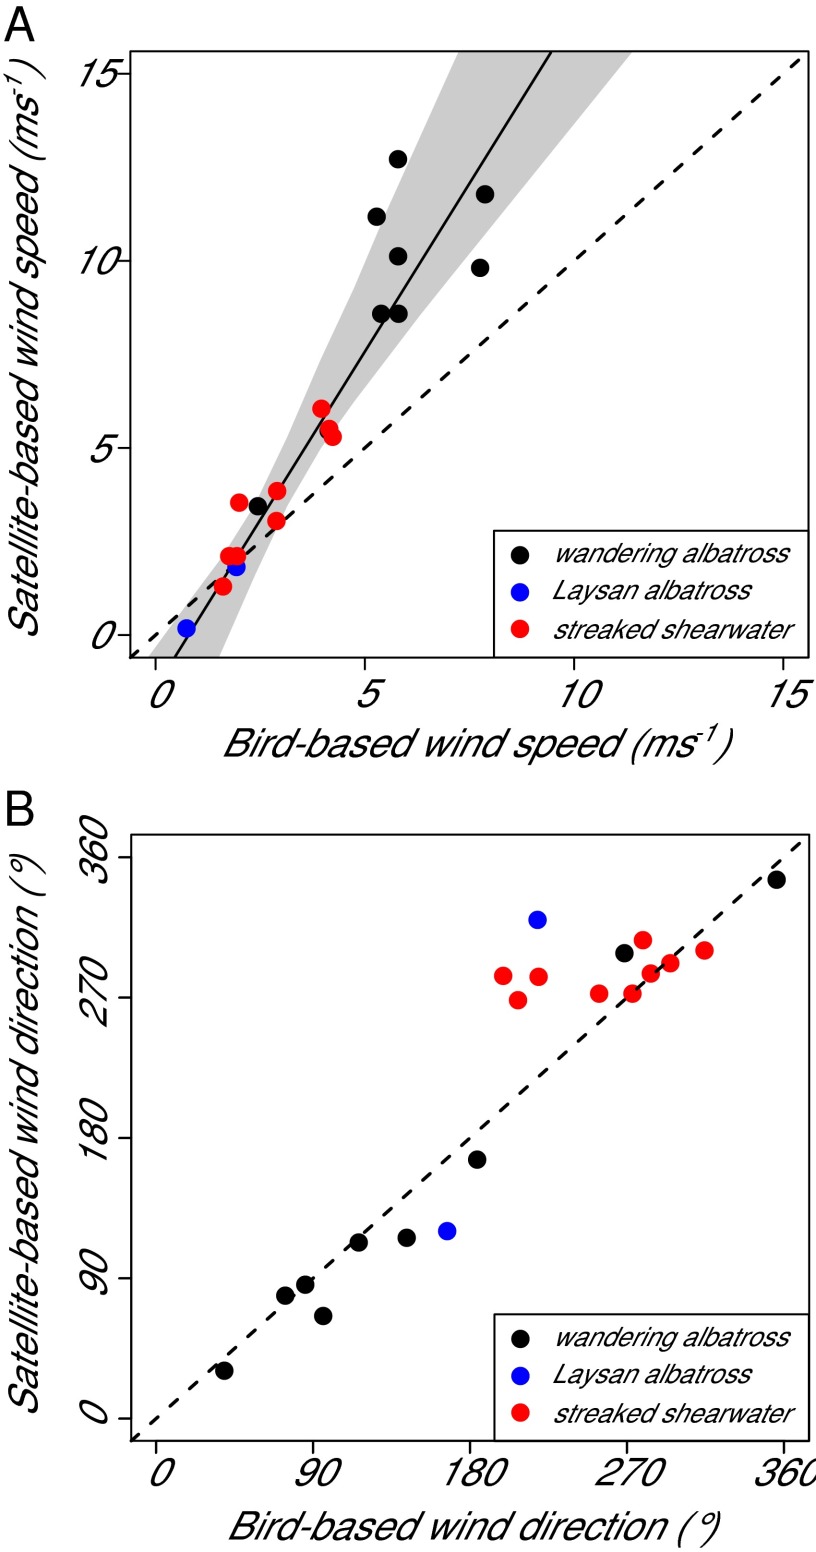
To examine the accuracy of the bird-based wind velocities, we compared it with satellite-based wind velocities estimated by the QuikSCAT and Advanced Scatterometer (ASCAT) satellite scatterometers. Many of the bird-based wind measurements were located between the swaths or time regions of the satellite coverage resulting in a total of only 20 collocated comparable points between bird-based and satellite-based winds [streaked shearwaters, n = 9 (Fig. 2 A a–c and B a–f, and Fig. S1); Laysan albatrosses, n = 2 (Figs. S2 A a and b and S3); and wandering albatrosses, n = 9 (Figs. S2 B a–i and S4)]. The generalized vector correlation coefficient (25) accounting for both wind speed and direction showed a significant correlation between the two methods ( = 1.66, n = 20, < 0.01; Materials and Methods). This was in the range of vector correlations shown in validation of satellite scatterometers measured winds compared with in situ measurements of winds by meteorological buoys (26, 27) ( = 1.28–1.90).
Fig. 2.
(A) Bird-based winds are mapped on the flight paths of seven streaked shearwaters released on August 29, 2014, and (B) six streaked shearwaters released on September 2, 2014. Colors on the flight paths indicate wind speed, and black bars indicate the direction in which the wind is blowing. Stars indicate the breeding site. Points where bird-based wind was compared with satellite-based wind are shown in boxes. Blue lines are the bird’s flight paths, and black arrows are the bird-based wind with length of the arrow indicating wind speed. Red arrow in the boxes represents the bird-based wind temporally closest to the satellite-based wind measurements shown in gray arrows.
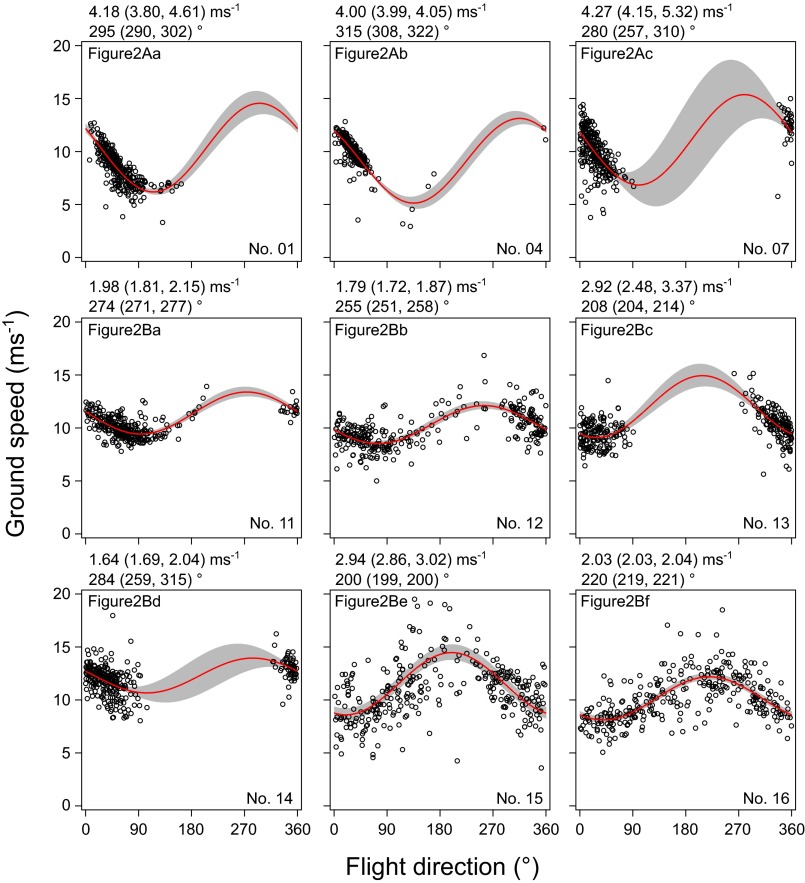
Fig. S1.
The relationship between ground speed and flight direction of streaked shearwaters in the nine points where bird-based winds and satellite-based winds were compared. Red curves are the fitted sine curves. The 95% confidence bands are shown in gray. Estimated wind speed and direction are shown above each box with estimates from lower and upper curve of the CI in parentheses. Each box is linked to the comparison points shown in Fig. 2.
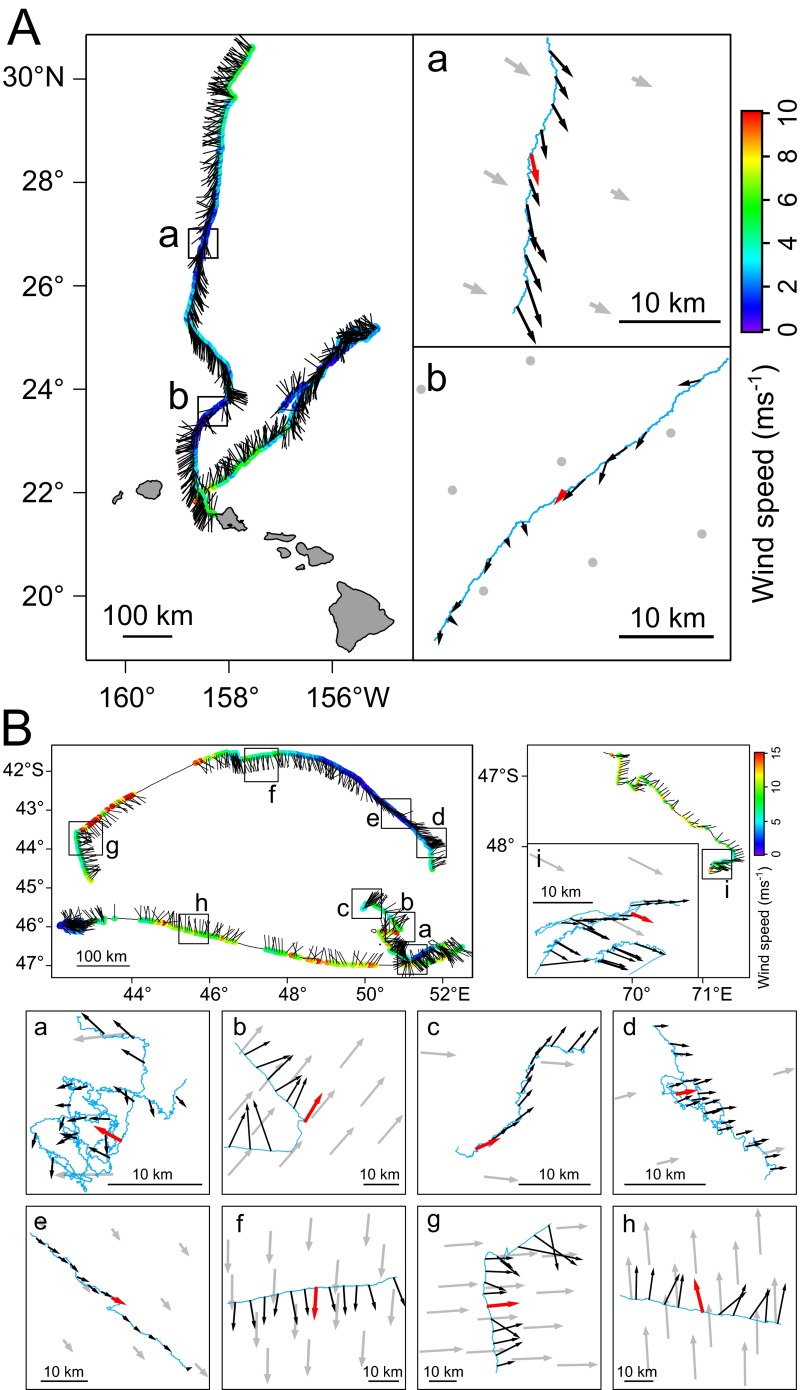
Fig. S2.
(A) Bird-based winds are mapped on the flight paths of two Laysan albatrosses and (B) four wandering albatrosses. Colors on the flight paths indicate the estimated wind speed. Black bars indicate the direction to which the wind is blowing. Points where bird-based winds were compared with satellite-based winds are shown in boxes. Blue lines are the bird’s flight path, and black arrows are the bird-based winds with length of the arrows indicating wind speed. Red arrow in the boxes represent the bird-based winds temporally closest to the satellite-based wind measurements shown in gray arrows.
Fig. S3.
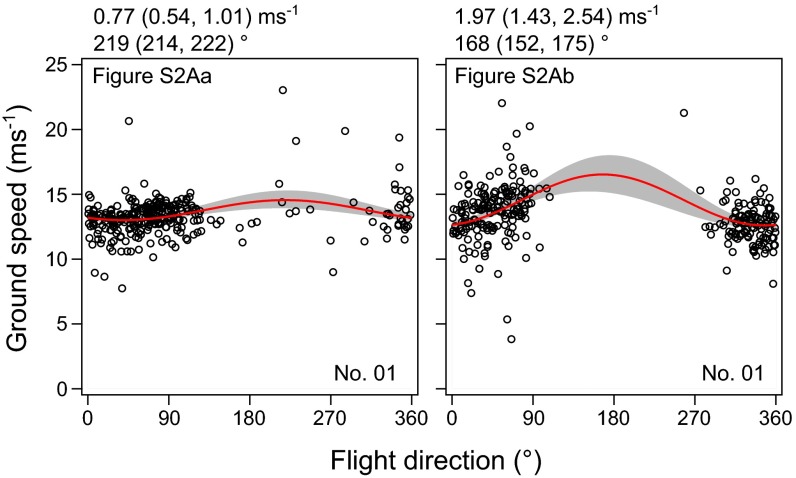
The relationship between ground speed and flight direction of Laysan albatrosses in the two points where bird-based winds and satellite-based winds were compared. Red curves are the fitted sine curves. The 95% confidence bands are shown in gray. Estimated wind speed and direction are shown above each box with estimates from lower and upper curve of the CI in parentheses. Each box is linked to the comparison points shown in Fig. S2A.
Fig. S4.
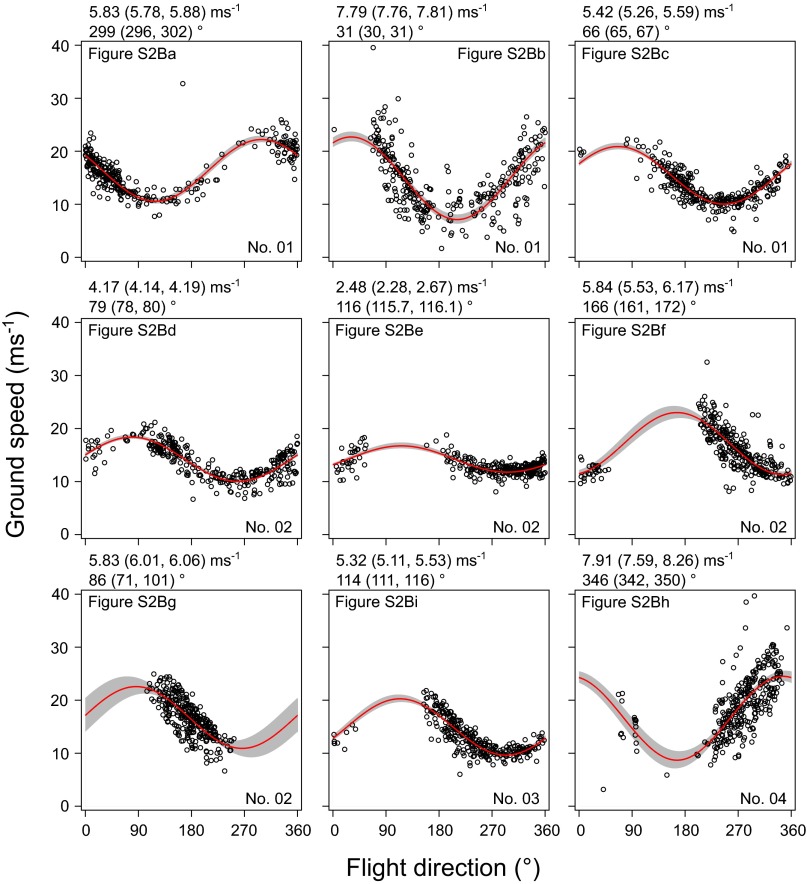
The relationship between ground speed and flight direction of wandering albatrosses in the nine points where bird-based winds and satellite-based winds were compared. Red curves are the fitted sine curves. The 95% confidence bands are shown in gray. Estimated wind speed and direction are shown above each box with estimates from lower and upper curve of the CI in parentheses. Each box is linked to the comparison points shown in Fig. S2B.
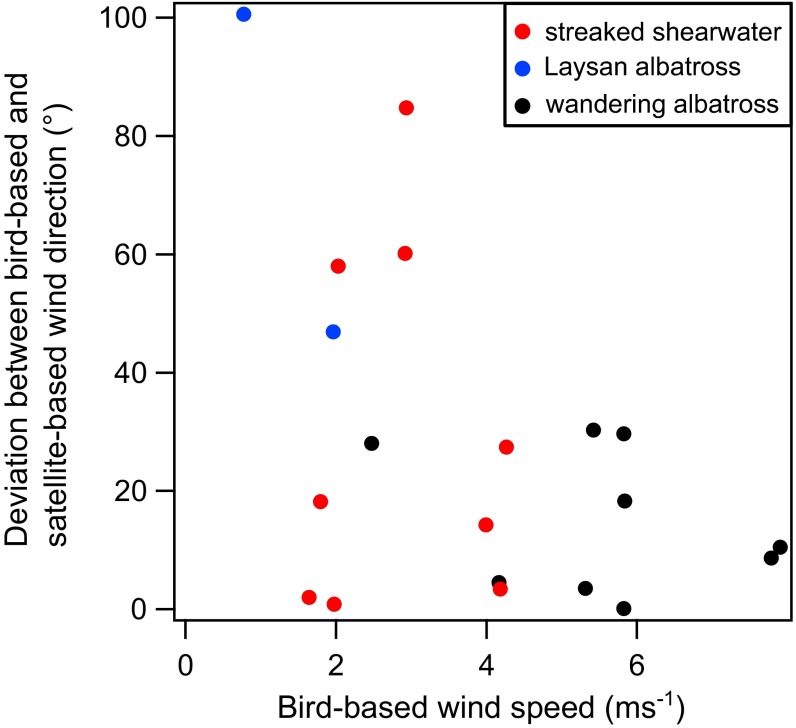
Comparison of wind direction between bird and satellite-based estimates showed good agreement (Fig. 3B; angular correlation coefficient R = 0.44, P < 0.01). Absolute difference between bird-based and satellite-based measurements of wind direction became larger in weak winds (Fig. S5), particularly in some points from shearwaters and Laysan albatross (Fig. 3B), as shown in comparison between wind direction derived by buoys and satellites (26, 27). Deviation from the true wind direction is crucial in strong winds but minor in weak winds. This issue is addressed by calculating the vector correlation coefficient considering both speeds and directions, which showed good agreement between the two methods. Scatterometers evaluate ocean surface wind velocities by measuring the ocean surface roughness. In coastal areas, accuracy of satellite wind measurements decreases because wave structure becomes complex and small-scale wind variation caused by topography is greatest. Validation of satellite-based winds show that mismatches between winds derived by satellites and buoys occur most often near the shore (26, 27). This limited accuracy and difficulty in capturing small-scale wind variation near the shore might also explain the deviation of wind direction between the two methods, especially in shearwaters flying in the coastal areas. On the other hand, wind directions estimated from flight paths of wandering albatrosses showed the strongest agreement with satellite-based wind directions (Fig. 3B) because this species flew in regions of strong persistent winds and far away from land (Fig. S2B).
Fig. 3.
(A) The relationship between bird-based () and satellite-based () wind speeds (n = 20, , Pearson’s R = 0.94, P < 0.01). Gray area represents the 99% CIs. (B) The relationship between bird-based and satellite-based wind directions (n = 20, angular correlation R = 0.44, P < 0.01). Dashed line represents equal speeds or directions. Plot color represents streaked shearwaters (red dots), Laysan albatrosses (blue dots), and wandering albatrosses (black dots).
Fig. S5.
Absolute difference of bird-based wind direction estimates from satellite-based wind direction estimates (Fig. 3B) in relation to bird-based wind speed (Fig. 3A). Plot colors represent estimates from streaked shearwaters (red dots), Laysan albatrosses (blue dots), and wandering albatrosses (black dots).
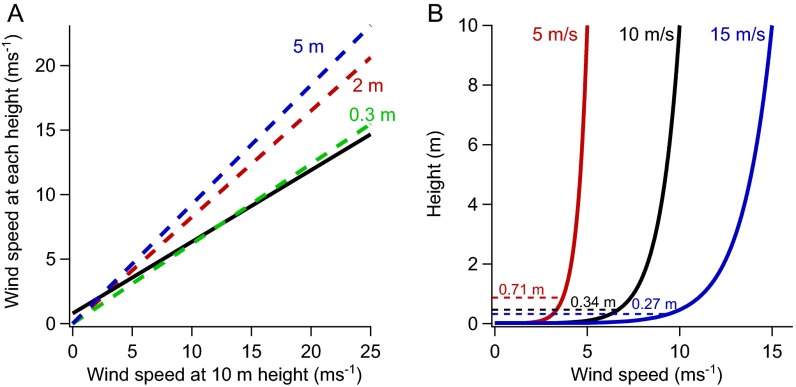
The bird-based wind speed was strongly correlated with the satellite-based wind speed (Pearson’s R = 0.94, P < 0.01) but was underestimated (Fig. 3A), which has several possible explanations. First, satellite-based wind speed is extrapolated to a 10-m reference height, whereas the average flight height of studied birds is below 10 m: ∼2 m for shearwaters and 3–8 m for albatrosses (28). This difference in height is suspected to be one of the cause of the underestimation of bird-based wind speed due to the shear of wind speed decreasing near the ocean surface. To evaluate the discrepancy of wind speed due to height difference, we used the logarithmic wind profile near the ocean surface (29), which showed that the corresponding flight height would be lower than 1 m to satisfy the underestimation of bird-based wind speed estimates (Fig. S6). This indicates that the wind shear does not solely explain the discrepancy between bird and satellite-based wind speed estimates. Second, potential sources of error that might be related to the characteristics of soaring flight of the seabirds should be considered. The unique dynamic soaring flight pattern used by shearwaters and albatrosses not only zigzags in the horizontal direction but also undulates in the vertical direction (23, 24, 30). Therefore, the variation in ground speed includes the decrease and increase of ground speed associated with the gain and loss of altitude. Altitude variation related to maneuvering of soaring birds consists of ascending in head winds and descending in tail winds. This may cause the estimated wind speed to deviate from the true wind speed experienced by the bird. However, studies of dynamic soaring flight show that potential energy associated with flight altitude is much smaller than the kinetic energy associated with fluctuating ground speed, indicating that wind resistance and assistance dominates ground speed fluctuation (23, 24). Another error can be caused by albatrosses and shearwaters adjusting their air speed in relation to head and tail winds, with air speed increasing in head winds (21, 28), because here we assumed that the bird flew in a constant air speed in each section. Although flapping effort, which increases with decreasing body size (31), might also affect wind speed estimation especially in relatively small-sized shearwaters, this is thought to have small effect because intermittent flapping of soaring seabirds is considered to keep air speed in a certain range for sustainable flight (30, 32) and we assumed that there is no rapid increase or decrease in ground speed by flapping, except during takeoffs and landings, which we excluded from our analysis (Materials and Methods). The strong correlation between bird-based and satellite-based wind speeds (Fig. 3A) suggest that bird-based wind speeds could be converted to comparable values for practical use. Further analysis of the complex dynamics of the flight of these birds can increase estimation accuracy, especially by recording flight height to determine the reference height of the estimated wind velocities.
Fig. S6.
(A) Relationship between wind speed at 10-m reference height and 5-m (blue), 2-m (red), and 0.3-m (green) height. Black line indicates the height that satisfies Vsat = 1.8 Vbird – 1.42 shown in Fig. 3A. (B) Example of a wind shear when the wind speed at 10-m height is 5 ms−1 (red), 10 ms−1 (black), and 15 ms−1 (blue). The height that satisfies Vsat = 1.8 Vbird – 1.42 is shown in dashed lines, which is much lower than the average flight height of the soaring seabirds. The logarithmic wind profile is used to represent the wind shear (29).
Bird-Based Wind Covers Spatial and Temporal Observation Gaps.
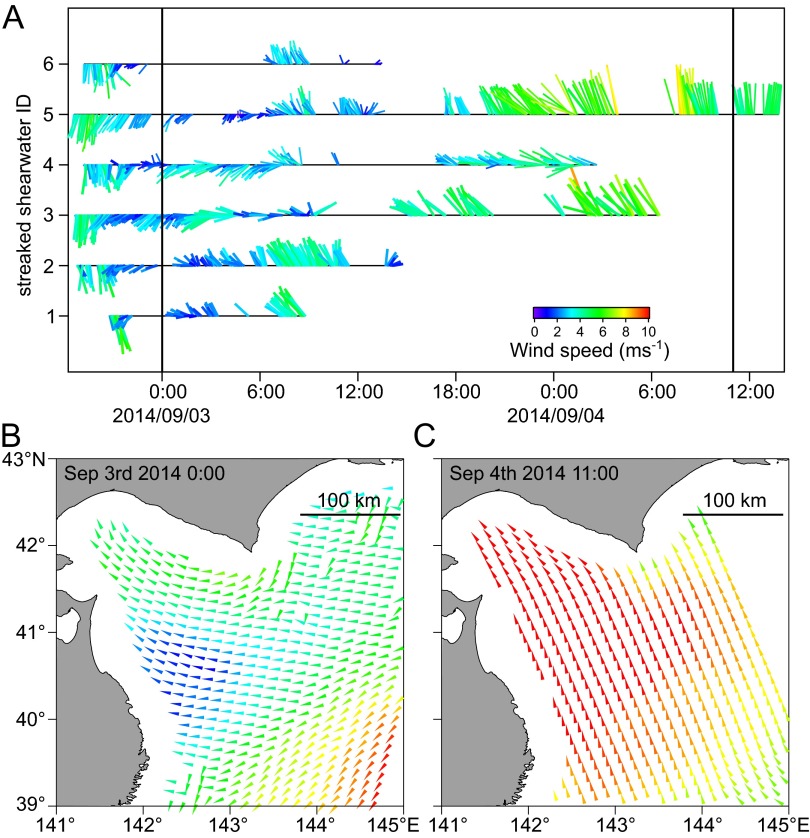
Extensive travel distance and prolonged flight duration of soaring seabirds enabled fine-scale resolution and wide range estimation of wind speed and direction covering temporal and spatial gaps between the remote-sensing measurements. A total of 1,664 bird-based wind data points was obtained from 13 streaked shearwaters released simultaneously on August 29 (n = 7) and September 2 (n = 6), 2014. Each of the bird-based wind velocity represents the wind experienced by the birds during 5-min flights of ∼2- to 3-km distance traveled, higher resolution compared with more than 12-h and 12.5-km resolution of satellite-based wind estimations. Estimated wind speed from streaked shearwater tracks ranged from 0.4 to 11.2 ms−1 with average of 3.4 1.6 ms−1. Data points were widespread in the ocean between Hokkaido and Sanriku in north eastern Japan and were densely distributed especially near the Sanriku coast (approximately <100 km from land) (Fig. 2) because the birds frequently returned to their colony at the coastal island to feed their chicks. Dense distribution of bird-based winds in coastal areas covered a key region where satellite-based wind measurements are lacking due to topographic effects (Fig. 2 and Fig. S7 B and C). Offshore winds estimated by long-distance foraging trips (∼500 km) were relatively strong, whereas speeds of coastal winds estimated by short-distance foraging trips (approximately <100 km) were weaker and changed direction frequently (Fig. 2). The high temporal resolution of the bird-based winds detected the dynamic change in wind direction from northerly winds to southerly winds that occurred between 0:00 and 12:00 UTC of September 3 with timing differing according to the location of the birds (Fig. S7). These changes were not recorded by the scatterometer wind estimation at 0:00 UTC and 11:00 UTC on September 3 and 4, respectively, because of their lack of fine temporal resolution.
Fig. S7.
(A) Temporal view of the bird-based winds by six streaked shearwaters released on September 2, 2014. Two black vertical lines indicate the times when a satellite scatterometer estimated the wind in the sea of northeastern Japan. (B) The satellite-based wind on ∼0:00 UTC of September 3, 2014, and (C) 11:00 UTC of September 4, 2014. There are data gaps at the coastal area and outside the measurement band.
Possibility of Using the Bird-Based Wind.
With this study, we have provided an initial indication of the use of seabird flight tracks to estimate ocean surface wind speed and direction with fine-scale resolution both spatially and temporally. Wind velocities can be estimated where satellite-based wind measurements are lacking, such as in coastal areas. Blending such coastal in situ wind data observed by buoys into model analyses are known to improve the fidelity between modeled and observed coastal current systems (7). This suggests that the bird-based wind estimates could be used to cover the satellite measurement gaps. In fact, geophysical data directly measured by instrumented animals or indirectly extracted from animal movements that complement conventional observation gaps have been assimilated to geophysical model analyses, as shown in currents extracted from shearwaters drift data (19) that were assimilated to ocean surface circulation models (20) and temperature and salinity profile measured by instrumented seals (11) used in Antarctic circumpolar circulation models (12). Wind stress and wind stress curl in coastal areas induce surface currents and upwelling systems that often generate areas of high biological productivity (6, 8). We can intensively monitor these productive areas using seabirds because seabirds tend to forage in such areas (19). These data can effectively complement the data from drifting buoys, which are less effective in detecting such areas. In addition, wind measurement coverage and validation can be easily expanded by increasing the number of instrumented birds. Although indirect measurement from flight paths of soaring seabirds might include errors related to behavior and flight strategy of the birds, bird-based and satellite-based wind velocities were strongly correlated, suggesting that these estimated wind velocities have sufficient accuracy for further practical use. It is necessary to carefully address the estimation errors caused by flight behavior and difference between species through validation and further improve the accuracy by analysis of 3D flight trajectories.
The wind information derived from flight paths can be used in bird’s movement ecology. Wind is treated as an important external factor in studies of large-scale seasonal migrations (33–35) and commuting flights (36–38) of seabirds. Although the migration patterns of seabirds associated with the large-scale wind systems are well documented (33–35), finer-scale movements in relation to variation of winds in scales of several minutes to hours are still unrevealed due to the lack of wind information relevant to the fine-scale movements of the seabirds. Using the methods outlined in this study, high-resolution wind information experienced by birds throughout their whole flight can be evaluated to investigate bird flight behavior in relation to more fine-scale turbulence and variation of wind.
Soaring seabirds are exposed to various physical environments throughout their journeys over the ocean. Integrating measurements of atmospheric and oceanographic variables measured by seabird-borne sensors or derived by seabird movements (13–16, 19) (e.g., water temperature, air pressure, ocean surface current, wind) presents a unique platform to monitor the pelagic environment by using seabirds as a fast-moving “living ocean buoy.”
Materials and Methods
Field Study.
In this study, we used data from three species of Procellariiformes: streaked shearwater (mean body mass, 0.6 kg), Laysan albatross (3.1 kg), and wandering albatross (9.7 kg). GPS loggers used in the field studies were GiPSy-2 (Technosmart) for streaked shearwaters and Laysan albatrosses, and GPL20 (Little Leonardo) for wandering albatrosses. GiPSy-2 was powered by Li-SOCl2 battery and wrapped by heat shrink tube for waterproofing. The approximate mass of the loggers were 25 g (GiPSy-2) and 80 g (GPL20), which corresponded to less than 5% of bird’s body mass. We attached GPS loggers to the back of the birds with waterproof tape (Tesa) and retrieved them after the birds returned to their nests. GPS loggers were set to take one positional fix every second.
We attached the GPS loggers onto eight and nine streaked shearwaters simultaneously on August 29 and September 2, 2014, respectively, at the Funakoshi–Ohshima Island breeding colony (39° 24′N, 141° 59′E) in Japan. Seven and eight loggers were retrieved, respectively. One bird lost its instrument before recapture, and another bird was not recaptured. Two of the retrieved loggers did not record enough data. The remaining seven (nos. 1–7) and six (nos. 11–16) datasets were used in further analysis. The procedures of the field study were approved by the Animal Experimental Committee of The University of Tokyo, and this work was conducted with permission from the Ministry of the Environment and Agency for Cultural Affairs, Japan.
The field study of Laysan albatross was conducted in February 2014 at the Ka’ena Point, Oahu Island breeding colony (21° 34′N, 158° 16′W) in Hawaii. GPS loggers were attached to three birds and all were recaptured. One logger did not record enough data, so the remaining two datasets (nos. 1–2) were used in further analysis. The experiment was conducted under permission from the Hawaii Department of Land and Natural Resources and the US Geological Survey Bird Banding Laboratory.
The field study of wandering albatross was conducted in March 2007 at Possession Island, Crozet archipelago (46° 25′S, 51° 44′E) in the South Indian Ocean. GPS loggers were attached to six birds, and all were recaptured. Two loggers failed to record due to exposure to seawater, and the remaining four datasets (nos. 1–4) were used in further analysis. The experiment was conducted under permission from the ethics committee of the Institute Polaire Paul Emile Victor, France.
Wind Velocity Estimation.
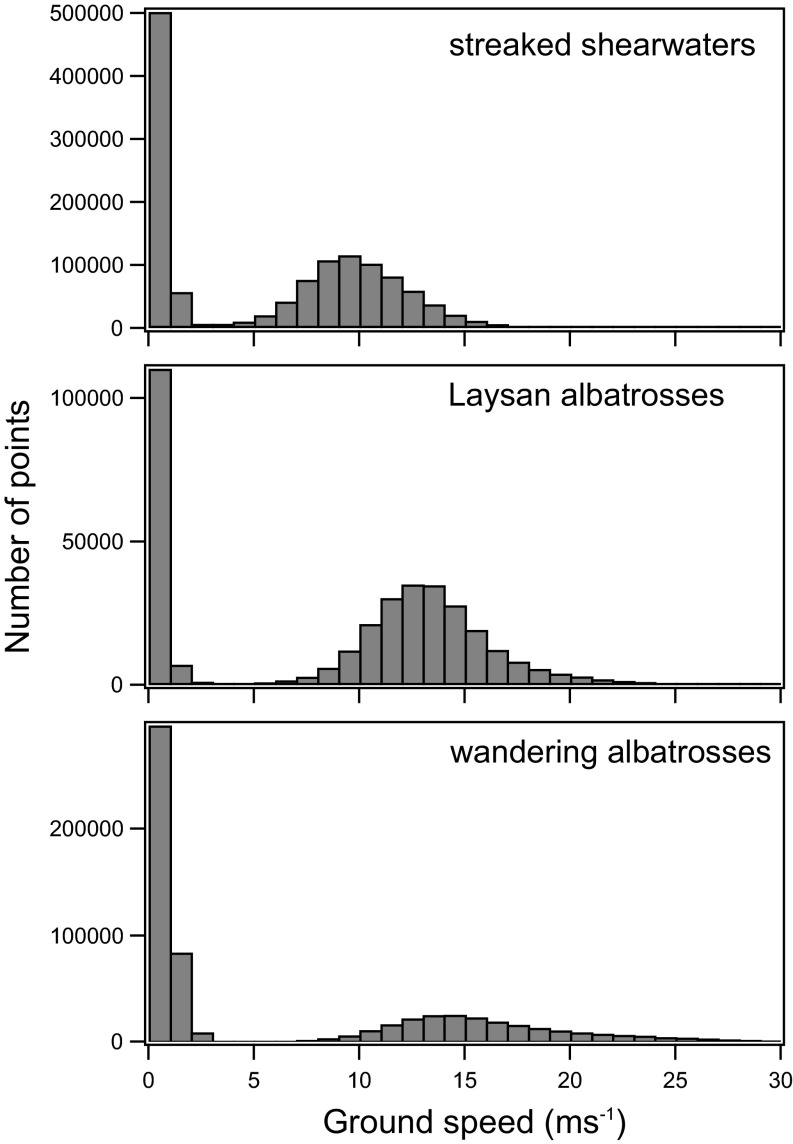
Analyses were done using Igor Pro (WaveMetrics). The developed software “Ethographer” (39) was used to calculate ground velocity of each position. The ground velocity is composed of ground speed () and flight direction (). Ground speed () of each bird was calculated from the distance between consecutive GPS positional fixes divided by the time taken (1 s) between them. Flight direction () was calculated as the clockwise angle between north and the line connecting each consecutive GPS points. The frequency distribution of ground speed was bimodal for all three species (Fig. S8). The lower ground speed values were interpreted as resting on ocean surface or on land, whereas higher ground speed values were interpreted as flight (40, 41). Based upon the bimodal distribution in the histogram of ground speed, the resting phase was defined as a period when a bird moved less than 4 ms−1 for more than 10 s (Fig. S8). Other periods were defined as the flight phase. Ground speed and flight direction during the flight phase longer than 10 min were used to estimate ocean surface winds. One minute after takeoff and 1 min before landing were not used in our analysis considering the effect of frequent flapping accompanied with takeoff and landing (31). Each flight phase was divided into series of 5-min sections. The number of sections were 1,685 for streaked shearwaters, 718 for Laysan albatrosses, and 744 for wandering albatrosses. Average latitude and longitude of each section were calculated to represent the positions of estimated wind data for each section. The angular deviation (42) of each flight section was calculated to represent the variation of flight direction.
Fig. S8.
Histogram of ground speed of streaked shearwaters, Laysan albatrosses, and wandering albatrosses. All three species show bimodal distribution of ground speed, which is divided into resting phase and flight phases at ∼4 ms−1.
Referring to Shimatani et al. (17), a sinusoidal curve was fitted against the relationship of ground speed () and flight direction () for each 5-min section using the following equation:
where Va, a, and b are coefficients. We assumed that birds flew with a constant air speed () in each 5-min section. By assuming that the ground speed of a bird is only affected by the strength of wind speed along flight direction, the ground speed of a bird would be maximized in pure tail winds and equals the sum of air speed and wind speed, whereas it would be minimized in pure head winds and equals the wind speed subtracted from air speed. Therefore, wind speed of each section () was calculated as one-half of the difference between the maximum () and the minimum () values of the fitted sinusoidal curve using the following equation (Fig. 1 C and F):
We determined wind blowing direction of each section as corresponding to the direction at the maximum flight speed () of the fitted sinusoidal curve (Fig. 1 C and F).
As wind speed becomes weaker, the peak of the fitted sinusoidal curve becomes ambiguous, resulting in an unreliable estimation of wind direction. To avoid ambiguous estimation of wind direction when wind speed is extremely low, Akaike’s information criterion (AIC) was calculated for sinusoidal curve fitting () and line fitting with a fixed slope of zero () in each section, assuming normal distribution around each fitting. Wind was not estimated when
This selection of fitting also avoided wind velocity estimation when the variation of flight direction was small or the ground speed variation seemed random, not reflecting the effect of wind speed and direction. The number of sections in which wind estimation was avoided was 21 (1.2%) for streaked shearwaters, 18 (2.5%) for Laysan albatrosses, and 5 (0.7%) for wandering albatrosses. Excluding these points resulted in 1,664 wind data obtained from streaked shearwaters, 700 from Laysan albatrosses, and 739 from wandering albatrosses.
Accuracy Test of the Bird-Based Wind.
To examine the accuracy, we compared the bird-based wind speed and direction with wind estimated by satellite-borne scatterometers. The scatterometers transmit microwave pulses to the ocean surface and measures the surface roughness from the backscattered pulses. Wind speed and direction are estimated by relating the surface roughness to wind stress. The satellites orbit around the earth two times per day and estimate wind speed and direction in continuous swaths covering large parts of the global ocean. The reference wind speed and direction data were obtained from the SeaWinds microwave scatterometer instrument flown on the QuikSCAT spacecraft (43) (QSCAT) and Advanced Scatterometer instrument flown on the EUMETSAT MetOp-A satellite (44) (ASCAT) from Physical Oceanography Distributed Active Archive Center (PODAAC) (podaac.jpl.nasa.gov/). We downloaded wind speed and direction data from OPeNDAP in PODAAC where data were gridded in 12.5 12.5-km resolution and wind speed was in a 10-m reference height for both QSCAT and ASCAT. Wind speed and direction data from QSCAT was used for comparison with 2007 dataset (wandering albatross) and ASCAT for 2014 dataset (streaked shearwater and Laysan albatross). Bird-based winds and satellite-based winds were collocated for comparison by choosing the nearest point both temporally and spatially. Temporal difference and spatial separation were limited to 2 h and 10 km, within the range of previous studies validating or comparing with satellite-based winds (26, 27), resulting in maximum difference of 89 min and 8.6 km. In many cases, the location of the bird-based wind data was between the swaths of satellite-based wind measurements, which caused large spatial separation. Twelve out of 20 compared points were from different single individual (all points from shearwaters are from different individuals) and a maximum of four points is obtained from the same individual (wandering albatross no. 2). Comparison points from the same individual were temporally separated by at least 12 h, which could sufficiently be treated as temporally independent observations.
Bird-based wind velocities and satellite-based wind velocities were both decomposed to and components in Earth-oriented Cartesian coordinates: increases along the eastward axis, and increases along the northward axis. The generalized vector correlation coefficient (25) () was calculated to evaluate the degree of correlation between bird-based and satellite-based wind velocities. This coefficient takes into account both wind speed and direction and shows a value between 0 and 2, with 0 indicating no correlation and 2 indicating complete correlation between two, 2D vector series. The generalized vector correlation coefficient is independent from the scaling effect to vector datasets by either a constant magnitude or angular shift. Therefore, only the wind speeds or the directions of satellite-based and bird-based winds were further compared. Wind speeds were compared by applying Passing–Bablok regression (45) using mcreg function in mcr package in R, version 3.0.0 (46) (Fig. 3). Although the satellite-based wind estimates used as the reference data for comparison also include error, Passing–Bablok regression compares two different methods (bird-based and satellite-based) estimating the same parameter (wind speed) taking into account that both of the estimating methods have an error. Confidence interval (CI) (99%) for the regression slope was calculated (upper CI, 2.73; lower CI, 1.40). Wind directions of satellite-based and bird-based winds were compared by the nonparametric test for angular–angular correlation (42) to test whether there was a correlation between them.
Acknowledgments
We thank Tatsuo Abe, Takanori Abe, Bungo Nishizawa, Miho Sakao, and Tatsuya Shiozaki for the logistic support in the field. We had fruitful comments from Suguru Kameda about the use of satellite data. We thank Akira Kuwano-Yoshida, Hiroshi Niino, Martina S. Müller, and Patrick J. O. Miller for assistance to improve our manuscripts. Field studies were financially supported by the Tohoku Ecosystem-Associated Marine Science; Bio-Logging Science, The University of Tokyo; and Japanese Society for the Promotion of Science Grants 24241001 and 16J09325. The work in the South Indian Ocean was supported financially and logistically by the French Polar Institute (IPEV: programme no. 109) and the French Southern Territories administration (TAAF).
Footnotes
The authors declare no conflict of interest.
This article is a PNAS Direct Submission.
Data deposition: Time series of latitude and longitude data of all the studied birds have been deposited in the Dryad Digital Repository, datadryad.org (10.5061/dryad.3pb86).
This article contains supporting information online at www.pnas.org/lookup/suppl/doi:10.1073/pnas.1523853113/-/DCSupplemental.
References
- 1.Liu WT. Progress in scatterometer application. J Oceanogr. 2002;58(1):121–136. [Google Scholar]
- 2.Chelton DB, Schlax MG, Freilich MH, Milliff RF. Satellite measurements reveal persistent small-scale features in ocean winds. Science. 2004;303(5660):978–983. doi: 10.1126/science.1091901. [DOI] [PubMed] [Google Scholar]
- 3.Chelton DB, Freilich MH, Sienkiewicz JM, Von Ahn JM. On the use of QuikSCAT scatterometer measurements of surface winds for marine weather prediction. Mon Weather Rev. 2006;134(8):2055–2071. [Google Scholar]
- 4.Ebuchi N, Graber HC, Caruso MJ. Evaluation of wind vectors observed by QuikSCAT/SeaWinds using ocean buoy data. J Atmos Ocean Technol. 2002;19(12):2049–2062. [Google Scholar]
- 5.Pickett MH, Tang W, Rosenfeld LK, Wash CH. QuikSCAT satellite comparisons with nearshore buoy wind data off the U.S. west coast. J Atmos Ocean Technol. 2003;20(12):1869–1879. [Google Scholar]
- 6.Rykaczewski RR, Checkley DM., Jr Influence of ocean winds on the pelagic ecosystem in upwelling regions. Proc Natl Acad Sci USA. 2008;105(6):1965–1970. doi: 10.1073/pnas.0711777105. [DOI] [PMC free article] [PubMed] [Google Scholar]
- 7.He R, Liu Y, Weisberg RH. Coastal ocean wind fields gauged against the performance of an ocean circulation model. Geophys Res Lett. 2004;31(14):L14303. [Google Scholar]
- 8.Albert A, Echevin V, Lévy M, Aumont O. Impact of nearshore wind stress curl on coastal circulation and primary productivity in the Peru upwelling system. J Geophys Res. 2010;115(C12):C12033. [Google Scholar]
- 9.Kawai Y, et al. Marine atmospheric boundary layer and low-level cloud responses to the Kuroshio Extension front in the early summer of 2012: Three-vessel simultaneous observations and numerical simulations. J Oceanogr. 2015;71(5):511–526. [Google Scholar]
- 10.Biuw M, et al. Variations in behavior and condition of a Southern Ocean top predator in relation to in situ oceanographic conditions. Proc Natl Acad Sci USA. 2007;104(34):13705–13710. doi: 10.1073/pnas.0701121104. [DOI] [PMC free article] [PubMed] [Google Scholar]
- 11.Charrassin J-B, et al. Southern Ocean frontal structure and sea-ice formation rates revealed by elephant seals. Proc Natl Acad Sci USA. 2008;105(33):11634–11639. doi: 10.1073/pnas.0800790105. [DOI] [PMC free article] [PubMed] [Google Scholar]
- 12.Roquet F, et al. Estimates of the Southern Ocean general circulation improved by animal-borne instruments. Geophys Res Lett. 2013;40(23):6176–6180. [Google Scholar]
- 13.Durant J, et al. Pros and cons of using seabirds as ecological indicators. Clim Res. 2009;39(2):115–129. [Google Scholar]
- 14.Charrassin J-B, Park Y-H, Le Maho Y, Bost C-A. Penguins as oceanographers unravel hidden mechanisms of marine productivity. Ecol Lett. 2002;5(3):317–319. [Google Scholar]
- 15.Weimerskirch H, Wilson R, Guinet C, Koudil M. Use of seabirds to monitor sea-surface temperatures and to validate satellite remote-sensing measurements in the Southern Ocean. Mar Ecol Prog Ser. 1995;126(1-3):299–303. [Google Scholar]
- 16.Wilson R, et al. Remote-sensing systems and seabirds: Their use, abuse and potential for measuring marine environmental variables. Mar Ecol Prog Ser. 2002;228:241–261. [Google Scholar]
- 17.Shimatani IK, Yoda K, Katsumata N, Sato K. Toward the quantification of a conceptual framework for movement ecology using circular statistical modeling. PLoS One. 2012;7(11):e50309. doi: 10.1371/journal.pone.0050309. [DOI] [PMC free article] [PubMed] [Google Scholar]
- 18.Treep J, et al. Using high resolution GPS tracking data of bird flight for meteorological observations. Bull Am Meteorol Soc. 2015;97(6):951–961. [Google Scholar]
- 19.Yoda K, Shiomi K, Sato K. Foraging spots of streaked shearwaters in relation to ocean surface currents as identified using their drift movements. Prog Oceanogr. 2014;122:54–64. [Google Scholar]
- 20.Miyazawa Y, et al. Assimilation of the seabird and ship drift data in the north-eastern sea of Japan into an operational ocean nowcast/forecast system. Sci Rep. 2015;5:17672. doi: 10.1038/srep17672. [DOI] [PMC free article] [PubMed] [Google Scholar]
- 21.Spear LB, Ainley DG. Flight speed of seabirds in relation to wind speed and direction. Ibis (Lond 1859) 1997;139(2):234–251. [Google Scholar]
- 22.Wakefield ED, et al. Wind field and sex constrain the flight speeds of central-place foraging albatrosses. Ecol Monogr. 2009;79(4):663–679. [Google Scholar]
- 23.Sachs G, et al. Flying at no mechanical energy cost: Disclosing the secret of wandering albatrosses. PLoS One. 2012;7(9):e41449. doi: 10.1371/journal.pone.0041449. [DOI] [PMC free article] [PubMed] [Google Scholar]
- 24.Sachs G, Traugott J, Nesterova AP, Bonadonna F. Experimental verification of dynamic soaring in albatrosses. J Exp Biol. 2013;216(Pt 22):4222–4232. doi: 10.1242/jeb.085209. [DOI] [PubMed] [Google Scholar]
- 25.Crosby DS, Breaker LC, Gemmill WH. A proposed definition for vector correlation in geophysics—theory and application. J Atmos Ocean Technol. 1993;10(3):355–367. [Google Scholar]
- 26.Freilich MH, Dunbar RS. The accuracy of the NSCAT 1 vector winds: Comparisons with National Data Buoy Center buoys. J Geophys Res. 1999;104(C5):11231–11246. [Google Scholar]
- 27.Adams J, Flora S. Correlating seabird movements with ocean winds: Linking satellite telemetry with ocean scatterometry. Mar Biol. 2009;157(4):915–929. [Google Scholar]
- 28.Pennycuick CJ. The flight of petrels and albatrosses (Procellariiformes), observed in South Georgia and its vicinity. Philos Trans R Soc B Biol Sci. 1982;300(1098):75–106. [Google Scholar]
- 29.Stull RB. An Introduction to Boundary Layer Meteorology. Kluwer Academic; Dordrecht, The Netherlands: 2003. [Google Scholar]
- 30.Spivey RJ, Stansfield S, Bishop CM. Analysing the intermittent flapping flight of a Manx shearwater, Puffinus puffinus, and its sporadic use of a wave-meandering wing-sailing flight strategy. Prog Oceanogr. 2014;125:62–73. [Google Scholar]
- 31.Sato K, et al. Scaling of soaring seabirds and implications for flight abilities of giant pterosaurs. PLoS One. 2009;4(4):e5400. doi: 10.1371/journal.pone.0005400. [DOI] [PMC free article] [PubMed] [Google Scholar]
- 32.Pennycuick CJ. Flight of auks (Alcidae) and other northern seabirds compared with southern Procellariiformes: Ornithodolite observations. J Exp Biol. 1987;128(1):335–347. [Google Scholar]
- 33.Liechti F. Birds: Blowin’ by the wind? J Ornithol. 2006;147(2):202–211. [Google Scholar]
- 34.Shaffer SA, et al. Migratory shearwaters integrate oceanic resources across the Pacific Ocean in an endless summer. Proc Natl Acad Sci USA. 2006;103(34):12799–12802. doi: 10.1073/pnas.0603715103. [DOI] [PMC free article] [PubMed] [Google Scholar]
- 35.Croxall JP, Silk JRD, Phillips RA, Afanasyev V, Briggs DR. Global circumnavigations: Tracking year-round ranges of nonbreeding albatrosses. Science. 2005;307(5707):249–250. doi: 10.1126/science.1106042. [DOI] [PubMed] [Google Scholar]
- 36.Jouventin P, Weimerskirch H. Satellite tracking of wandering albatrosses. Nature. 1990;343(6260):746–748. [Google Scholar]
- 37.Weimerskirch H, Guionnet T, Martin J, Shaffer SA, Costa DP. Fast and fuel efficient? Optimal use of wind by flying albatrosses. Proc Biol Sci. 2000;267(1455):1869–1874. doi: 10.1098/rspb.2000.1223. [DOI] [PMC free article] [PubMed] [Google Scholar]
- 38.Weimerskirch H, Louzao M, de Grissac S, Delord K. Changes in wind pattern alter albatross distribution and life-history traits. Science. 2012;335(6065):211–214. doi: 10.1126/science.1210270. [DOI] [PubMed] [Google Scholar]
- 39.Sakamoto KQ, et al. Can ethograms be automatically generated using body acceleration data from free-ranging birds? PLoS One. 2009;4(4):e5379. doi: 10.1371/journal.pone.0005379. [DOI] [PMC free article] [PubMed] [Google Scholar]
- 40.Shiomi K, Yoda K, Katsumata N, Sato K. Temporal tuning of homeward flights in seabirds. Anim Behav. 2012;83(2):355–359. [Google Scholar]
- 41.Weimerskirch H, et al. GPS tracking of foraging albatrosses. Science. 2002;295(5558):1259. doi: 10.1126/science.1068034. [DOI] [PubMed] [Google Scholar]
- 42.Zar HJ. Biostatistical Analysis. 5th Ed Pearson Prentice Hall; Upper Saddle River, NJ: 2010. [Google Scholar]
- 43.Lungu T. 2006. QuikSCAT Science Data Product User Manual: Overview and Geophysical Data Products, Version 3.0 (Jet Propulsion Laboratory, California Institute of Technology, Pasadena, CA)
- 44.Verhoef A, Stoffelen A. 2016. ASCAT Wind Product User Manual, Version 1.14 (Ocean and Sea Ice Satellite Application Facility, EUMETSAT, Darmstadt, Germany)
- 45.Passing H, Bablok W. A new biometrical procedure for testing the equality of measurements from two different analytical methods. Application of linear regression procedures for method comparison studies in clinical chemistry, Part I. J Clin Chem Clin Biochem. 1983;21(11):709–720. doi: 10.1515/cclm.1983.21.11.709. [DOI] [PubMed] [Google Scholar]
- 46.R Core Team 2013 R: A Language and Environment for Statistical Computing (R Foundation for Statistical Computing, Vienna). Available at www.R-project.org. Accessed November 29, 2015.


