Significance
Dietary restriction is a metabolic intervention that extends the lifespan and reduces animal size and fat content. We have used Caenorhabditis elegans to demonstrate that the homolog of human ATXN2, atx-2, is a major regulator of the animal response to dietary restriction. Down-regulation of atx-2 in dietary-restricted animals leads to increased animal size and fat levels, as well as accelerated development. Surprisingly, it does not affect the extended lifespan of dietary-restricted animals. These findings are relevant to mammals because Ataxin-2 knockout mice exhibit adult-onset obesity, owing to an unknown mechanism. atx-2 negatively regulates the mechanistic target of rapamycin pathway via its interaction with a GDP dissociation inhibitor β. Forced activation of this pathway may have therapeutic potential for obesity.
Keywords: Caenorhabditis elegans, metabolism, mTOR pathway, TORC1
Abstract
Dietary restriction (DR) is a metabolic intervention that extends the lifespan of multiple species, including yeast, flies, nematodes, rodents, and, arguably, rhesus monkeys and humans. Hallmarks of lifelong DR are reductions in body size, fecundity, and fat accumulation, as well as slower development. We have identified atx-2, the Caenorhabditis elegans homolog of the human ATXN2L and ATXN2 genes, as the regulator of these multiple DR phenotypes. Down-regulation of atx-2 increases the body size, cell size, and fat content of dietary-restricted animals and speeds animal development, whereas overexpression of atx-2 is sufficient to reduce the body size and brood size of wild-type animals. atx-2 regulates the mechanistic target of rapamycin (mTOR) pathway, downstream of AMP-activated protein kinase (AMPK) and upstream of ribosomal protein S6 kinase and mTOR complex 1 (TORC1), by its direct association with Rab GDP dissociation inhibitor β, which likely regulates RHEB shuttling between GDP-bound and GTP-bound forms. Taken together, this work identifies a previously unknown mechanism regulating multiple aspects of DR, as well as unknown regulators of the mTOR pathway. They also extend our understanding of diet-dependent growth retardation, and offers a potential mechanism to treat obesity.
Dietary restriction (DR), limiting food consumption below ad libitum to levels that do not cause malnutrition, is a highly conserved metabolic intervention. Different DR regimes extend the lifespan of most tested animal species (1). Moreover, DR regimens have been found to reduce the risk of diabetes in monkeys and to positively change metabolic health biomarkers in humans (2). Lifelong DR causes reduced body size, lower fat levels, and a smaller brood size (3–6). Although the pathways by which DR extends lifespan have been thoroughly investigated, less is known about the causes of reduced body size and fat content.
Multiple DR regimens have been developed for Caenorhabditis elegans (7). Surprisingly, the different DR regimens vary in the genes essential for lifespan extension (7). For example, DR can be achieved by diluting the bacteria in a liquid medium. This intervention, which extends the lifespan and decreases animal size, is partially dependent on both daf-16, a key transcription factor of the insulin-like signaling pathway, and aak-2, the catalytic subunit of AMP-activated protein kinase (AMPK) (7, 8). In a different DR model, a mutation in the eat-2 gene decreases the rate of pharyngeal contractions, limiting the animals’ feeding rate. Unlike bacterial dilution, this model was shown to be independent of both daf-16 and aak-2, at least with respect to lifespan (7).
The mechanistic target of rapamycin (mTOR) pathway is a key regulator of multiple processes, including transcription and translation, protein and lipid synthesis, cell growth and size, and cellular metabolism (9). It contains two main protein complexes, mTOR complex 1 (TORC1) and complex 2 (TORC2) (10). TORC1 integrates multiple environmental signals as its input, including the ATP:AMP ratio via AMPK and the availability of amino acids. A key downstream target of TORC1 is ribosomal protein S6 kinase (S6K), which regulates protein synthesis and cell proliferation via the phosphorylation of several residues of the S6 ribosomal protein (10, 11).
atx-2 is the C. elegans homolog of the mammalian ATXN2 and ATXN2-like (ATXN2L) genes. Whereas poly-Q expansions in the ATXN2 gene cause spinocerebellar ataxia type 2, the function of ATXN2 remains largely unknown. Like the mammalian protein, ATX-2 contains poly-Q sequences, along with two conserved motifs, SM and lsmAD, that are involved in RNA metabolism (12). Work in nematodes has shown a role for ATX-2 in germ-line translational regulation and early embryonic patterning (13, 14). Consistently, ATXN2 is implicated in mRNA metabolism (14, 15), and in the germ-line, both ATXN2 and ATX-2 interact with the poly (A) binding protein (PAB-1) (14). ATXN2 also interacts with growth factor receptor-bound protein 2 (Grb2) (16). Mice lacking Atxn2 are viable but show adult-onset obesity and reduced insulin receptor expression (17, 18). A recent study shows that Atxn2 modulates nutrition and metabolism by regulating the pathways for the metabolism of branched-chain and other amino acids, metabolism of fatty acids, and the citric acid cycle (19). Finally, the human locus containing SH2B3 and ATXN2 is associated with type 1 diabetes (20). We have examined the role of atx-2 in dietary-restricted C. elegans animals, and found that it is involved in the regulation of animal and cell size, fat level, rate of development, and fecundity upstream of TORC1.
Results
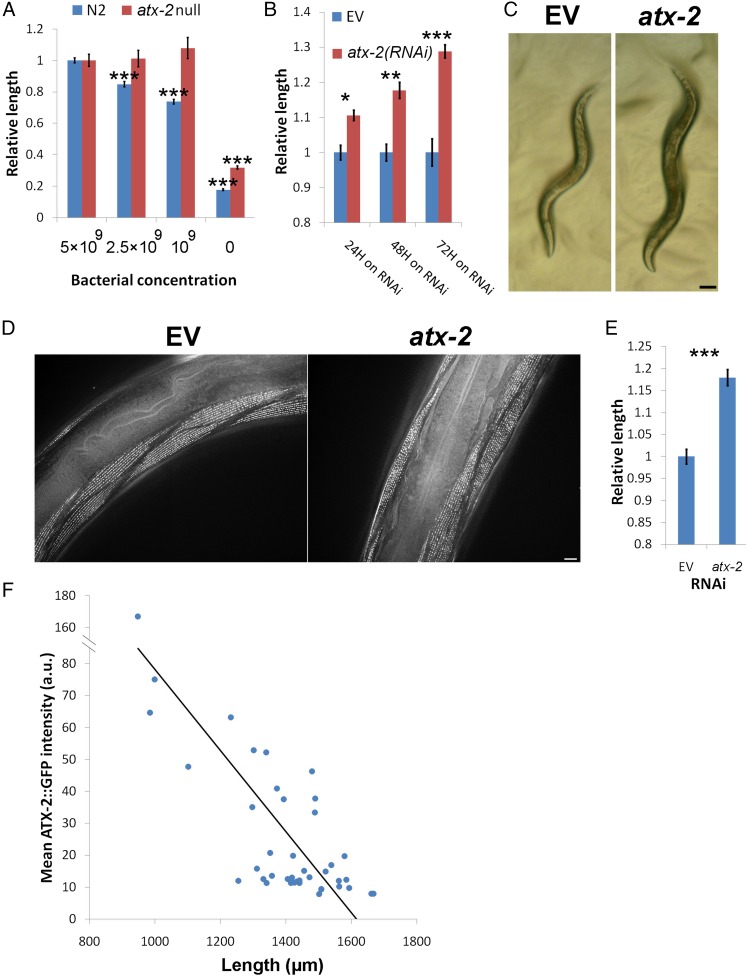
To test the effects of atx-2 on DR, we used bacterial dilutions to grow wild-type (WT; N2) and atx-2(tm3562) C. elegans animals. tm3562 is a large deletion in atx-2 that represents a complete atx-2 null phenotype (www.wormbase.org/species/c_elegans/variation/WBVar00252219), which in homozygous animals causes sterility (Japanese National Bioresource Project; shigen.nig.ac.jp/c.elegans/mutants/DetailsSearch?lang=english&seq=3562) (see Fig. S2C). As expected, bacterial dilution led to a decrease in the size of WT animals (Fig. 1A). In contrast, the atx-2(tm3562) animals did not respond to the bacterial dilution and maintained the size of well-fed animals [P < 10−16 for WT vs. P = 0.32 for atx-2(tm3562) in a fivefold bacterial dilution] (Fig. 1A). We concluded that in DR conditions, ATX-2 is required for reducing the size of the animal.
Fig. S2.
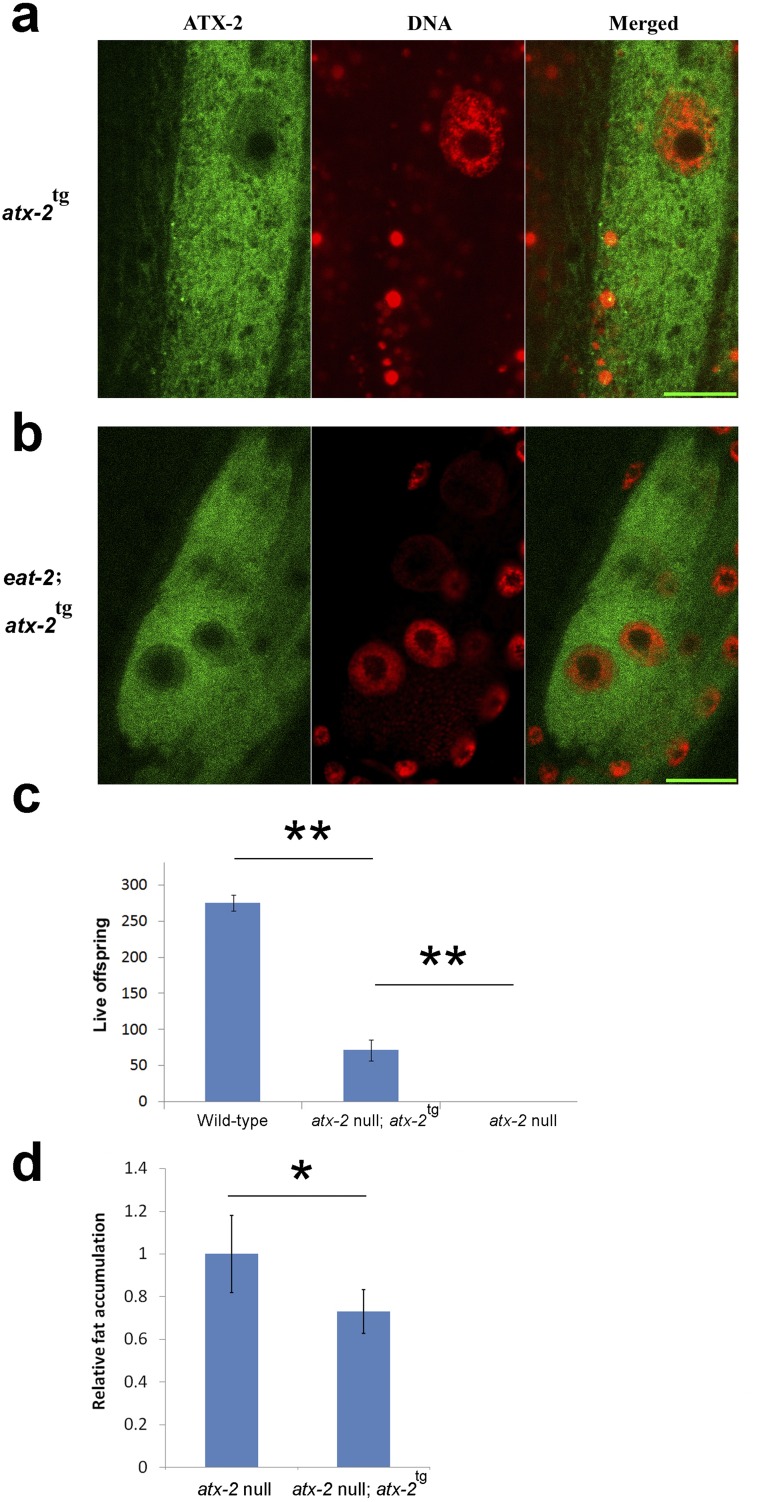
ATX-2tg is present in both the cytoplasm and the nucleus and its expression in tm3562 homozygous animals rescues their sterile phenotype. (A and B) WT (A) and eat-2 (B) young adults expressing ATX-2tg were stained with DAPI. ATX-2::GFP is shown in green; DNA, in red. Expression was observed in most or all tissues and developmental stages. Particularly strong expression was observed in embryos and gut cells. ATX-2 is present in both the nucleus and cytoplasm and absent from the nucleolus; gut nuclei are shown. (Scale bar: 10 µm.) (C) Transgenic expression of ATX-2tg in null background (sterile) partially rescued the egg-laying phenotype with 50–130 eggs/animal. WT animals laid an average of 260 eggs/animal. Error bars represent mean ± SEM. (D) Expression of transgenic ATX-2 (ATX-2tg) reduces the amount of fat accumulation in these animals. P = 0.001, two-tailed t test.
Fig. 1.
Size reduction in DR worms requires ATX-2. (A) Quantification of the length of WT (N2) and atx-2(tm3562) homozygous animals grown on a series of bacterial dilutions. Results are normalized per strain to maximal bacterial concentration. n = 146. (B) Quantification of the length of eat-2(ad1116) young adults subjected to atx-2(RNAi) after 24, 48, and 72 h. Results are normalized to age-matched controls. n = 66 (C) Stereomicroscope images showing stage-matched eat-2(ad1116) worms fed for 3 d with either EV or atx-2(RNAi). (D) Phalloidin staining of the body muscle cells of adult eat-2(ad1116) that were fed for 3 d with either EV or atx-2(RNAi). Fourteen animals and 103 nuclei were used for the analysis. P = 7 × 10⁻¹¹. (Scale bar: 10 µm.) (E) Quantification of size change of the muscle cells. P = 7 × 10⁻¹¹. (F) The effect of the transgenic expression levels of ATX-2tg in WT background on the size of 1-d-old adult worms. Error bars represent mean ± SEM. *P < 0.01; **P < 10−4; ***P < 10−6.
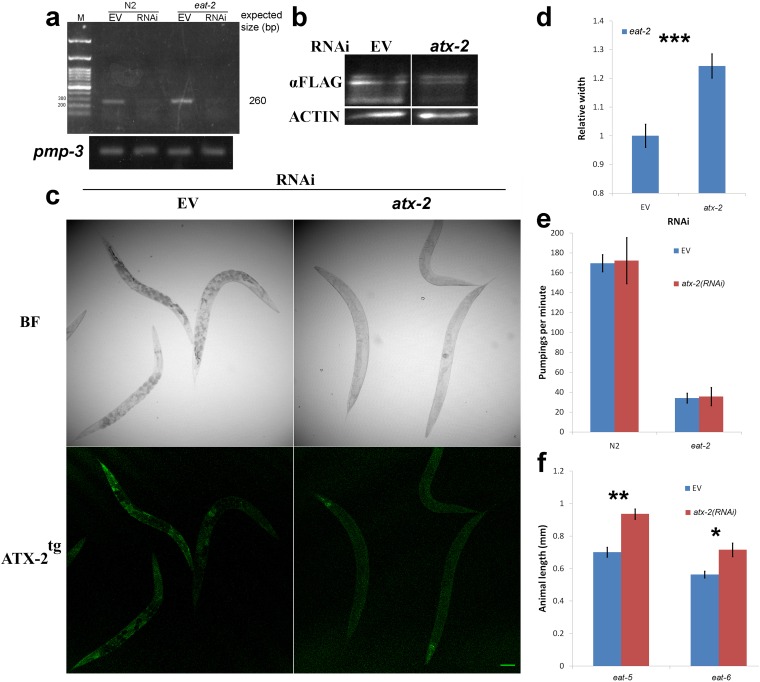
Worms that are mutated in the ligand-gated ion channel gene, eat-2; have a slower food intake; and serve as a genetic model for DR (21). We found that when atx-2 was down-regulated postdevelopmentally (Fig. S1 A–C), the smaller eat-2(ad1116) mutant animals grew longer and wider, up to the size of WT animals, with a typical size increase of 10–25% (P < 10−7) (Figs. 1 B and C and Fig. S1D). The increase in size did not result from an increased pumping rate of the pharynx, given that a down-regulation of atx-2 in eat-2(ad1116) animals did not affect the pumping rate (Fig. S1E). In addition, this increase in size appeared in other atx-2(RNAi) DR model animals as well, including eat-5(ad1402) and eat-6(ad467) (Fig. S1F).
Fig. S1.
atx-2(RNAi) efficiency and the effects on animal width, other DR model animals, and pumping rate. (A) Semiquantitative PCR of atx-2 cDNA derived from wild type (N2) and DR (eat-2) animals grown on atx-2(RNAi) or on EV (L4440). The pmp-3 gene served as a control. (B) ATX-2tg protein blot analysis using αFLAG antibodies. (C) Confocal microscopy of ATX-2tg of animals grown on atx-2(RNAi) or on EV (L4440). BF, bright field. (Scale bar = 10 µm.) (D) eat-2(ad1116) animals down-regulated for atx-2 show increase in width. n = 34. P = 0.0002. (E) Pharyngeal pumping rates do not change in WT (N2) and eat-2(ad1116) adult animals grown for 72 h on EV or atx-2(RNAi). (F) atx-2(RNAi) increases the length of eat-5(ad1402) and eat-6(ad467) animals. n = 41. P = 3 × 10⁻⁵ and 0.0029, respectfully. Animals were moved postdevelopmentally to atx-2(RNAi) plates, and length was measured after 48 h. Error bars represent mean ± SEM.
Worms have a fixed number of cells, and eat-2(ad1116) animals are exclusively smaller owing to their smaller cell size (3–6). To test whether atx-2 counteracts the DR-dependent size decrease by affecting cell size, we measured the maximal length of phalloidin-stained muscle cells in eat-2(ad1116) animals down-regulated for atx-2. The increase in length of body muscle cells in these animals was proportional to the increase in length of the entire animal, suggesting that the change in cell size constitutes the increase in animal length (Fig. 1 D and E).
We next tested whether ectopic ATX-2 expression is sufficient to control animal size by transgenic expression of ATX-2::GFP::FLAG (ATX-2tg) under its native promoter in WT (N2) animals. ATX-2tg is localized primarily to the cytoplasm and the nucleus in both WT and eat-2 animals (Fig. S2 A and B), and functions to partially rescue the fertility of atx-2(tm3562) animals (Fig. S2C). The overexpression of ATX-2tg in WT (N2) animals was sufficient to reduce animal size; its expression levels, measured as GFP intensity levels (22), were inversely correlated with animal size (r = −0.737; P = 4 × 10⁻⁸) (Fig. 1F). We conclude that atx-2 is both necessary and sufficient to suppress animal size in response to DR conditions. As discussed below, WT animals down-regulated for atx-2 consistently exhibited less than one-half of the size increase seen in dietary-restricted animals.
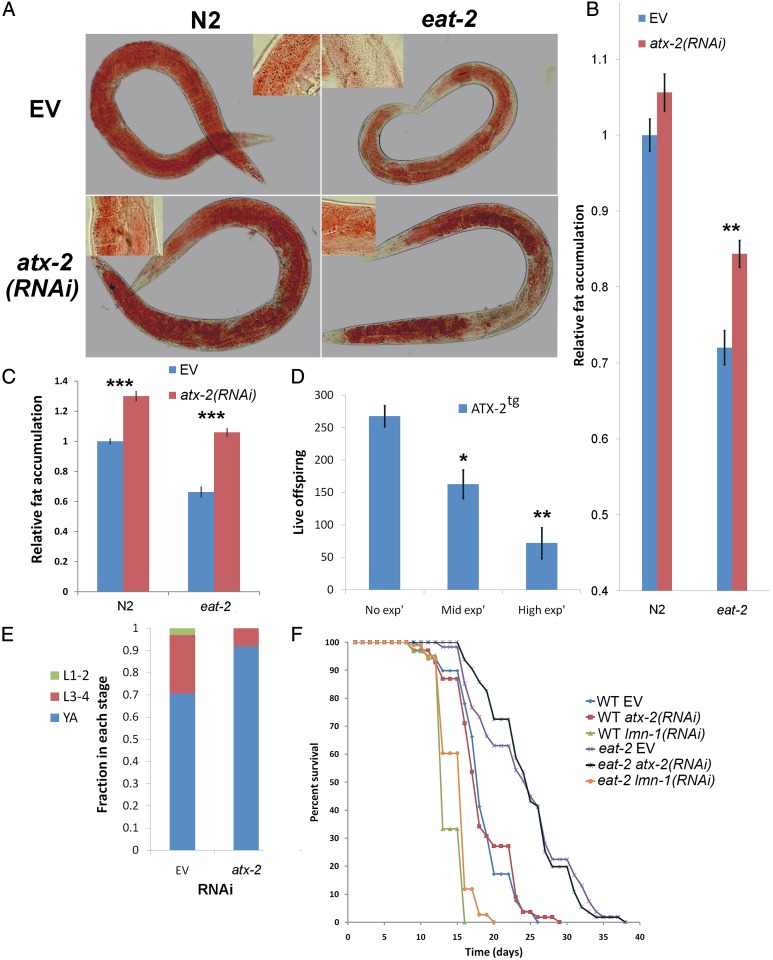
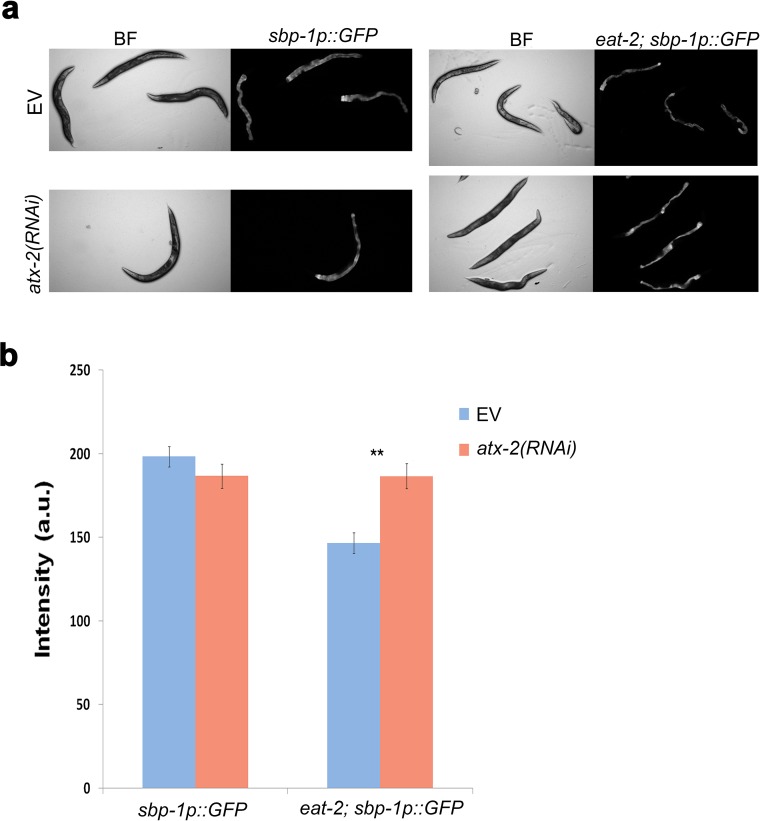
Animals subjected to DR are also leaner (5). The lower fat levels of these animals either can result from a controlled process in which nutrients are allocated to other functions or can occur passively, when a lack of resources prevents fat accumulation. To distinguish between these two possibilities, and to test whether atx-2 also regulates fat accumulation in C. elegans, we measured body fat levels by Oil Red O and Sudan Black B staining (23, 24). Whereas down-regulation of atx-2 had a minor impact on total fat levels of the WT animals, it significantly increased total fat levels of the eat-2(ad1116) animals, and also altered fat distribution (Fig. 2 A–C). The effect of atx-2 on fat levels is likely mediated by the sbp-1 gene, which is the C. elegans homolog of the mammalian sterol regulatory element-binding protein (SREBP). eat-2 animals expressing GFP driven by the sbp-1 promoter showed a lower level of GFP expression compared with WT animals. In contrast, atx-2 down-regulation resulted in similar GFP levels as seen in well-fed animals (Fig. S3 A and B). In line with these findings, overexpression of ATX-2tg decreased the fat content of atx-2(tm3562) animals (Fig. S2D). These results suggest that dietary-restricted animals consume enough food to support both growth and higher fat accumulation, but that energy from consumed food is redirected away from fat accumulation in an atx-2–dependent manner.
Fig. 2.
ATX-2 regulates fat accumulation, brood size, and pace of development, independent of lifespan, in eat-2(ad1116) animals. (A) Oil Red O staining of wild type (N2) and eat-2(ad1116) worms fed postdevelopmentally for 72 h with either EV or atx-2(RNAi). (Insets) Higher-magnification images showing the lipid droplets. (B) Quantification of the effect of atx-2(RNAi) on relative intensity of Oil Red O in eat-2 and in wild type animals. n = 90. Error bars represent mean ± SEM. **P < 10−4. (C) Quantification of fat levels by Sudan Black B staining in WT (N2) and eat-2(ad1116) 9-d-old animals fed with either EV or atx-2(RNAi). n = 160. Error bars represent mean ± SEM. ***P < 10−6. (D) Fecundity of animals overexpressing ATX-2tg. Worms were divided into three groups (no, middle, and high expression) according to the GFP intensity of the ATX-2tg transgene. n = 30. Error bars represent mean ± SEM. *P < 0.01; **P < 10−4. (E) Developmental stage reached by eat-2(ad1116) animals following down-regulation of atx-2 for 3 d posthatching. n = 200. P = 3 × 10⁻⁵, χ2 test. L1-2, larval stages 1–2; L3-4, larval stages 3–4; YA, young adults. (F) Survival curve for WT (N2) and eat-2(da1116) worms fed with EV (blue and purple), atx-2 (red and black), or lmn-1 (green and orange) at 23 °C. The RNAi treatments were initiated at larval stage 4. atx-2(RNAi) treatment did not change the lifespan of N2 or eat-2 animals, whereas lmn-1(RNAi) significantly shortened the life span of both N2 and eat-2 animals. P < 0.0005. The lifespan assay was repeated five times for N2 and eat-2 and two times for lmn-1.
Fig. S3.
atx-2 regulates sbp-1 expression in dietary-restricted animals. (A) Florescence microscopy images of wild type and eat-2 animals expressing GFP driven by the sbp-1 promoter and fed with either EV or atx-2(RNAi). The RNAi treatments were provided for 72 h starting at larval stage 4. (B) Quantification of florescence. n = 110. **P < 10−4.
An additional phenotype of eat-2 mutants is a reduced brood size. If atx-2 regulates brood size in DR animals, then overexpression of atx-2 in WT animals would mimic DR by reducing the brood size. Indeed, overexpression of ATX-2tg in WT animals led to a reduced brood size (Fig. 2D). Because the lack of ATX-2, owing either to a deletion or to RNAi knockdown, causes sterility, whereas ATX-2tg overexpression causes a smaller brood size, we concluded that optimal levels of ATX-2 are required for maximal brood size.
eat-2(ad1116) animals also show slower development. At 3 d of age, >95% of WT animals were at the young adult stage (25). When atx-2 was down-regulated in eat-2(ad1116) animals after hatching, by day 3 nearly all atx-2(RNAi)–treated animals were young adults, similar to the developmental pace in WT animals. Conversely, a significant fraction of control eat-2 animals were still at the third and fourth larval stages (Fig. 2E).
We next tested whether down-regulation of atx-2 in eat-2 animals affects their lifespan. The atx-2 gene was not reported as a lifespan modulator in any of the previous genome-wide screens. Indeed, the average lifespan of atx-2(RNAi) was similar to that of WT animals (Fig. 2F). Surprisingly, atx-2(RNAi) had no significant effect on the lifespan of eat-2 mutants (Fig. 2F), as confirmed by five independent repeats. As expected (26), down-regulation of lmn-1 in adult animals significantly shortened their lifespan (Fig. 2F), whereas nhr-62 did not significantly affect the lifespan of eat-2 animals (27) (Table S1). Thus, animal size and fat accumulation can be uncoupled from lifespan extension in eat-2 animals. We concluded that atx-2 regulates animal length, fat accumulation, and developmental rate in DR animals independent of lifespan.
We next analyzed the mechanism by which ATX-2 regulates DR. Mining of high-throughput data revealed that the mammalian ataxin-2–like protein is associated with tuberous sclerosis 1 protein (TSC1) (28), which together with TSC2 regulate the mTOR pathway (11). Therefore, we tested the role of mTOR pathway proteins in the atx-2–dependent size determination. Ribosomal protein S6K phosphorylates several residues of the S6 ribosomal protein, leading to increased protein synthesis and cell proliferation. S6K functions downstream of TSC1/TSC2 in the mTOR pathway to regulate metabolism (11) (Fig. 4B). A deletion of rsks-1(ok1255), the homologous C. elegans gene of S6K, abolished the size increase of atx-2(RNAi) in both WT and eat-2(ad1116) background animals (Fig. 3A and Fig. S4A). We conclude that ATX-2 regulates size by the mTOR pathway, upstream of RSKS-1.
Fig. 4.
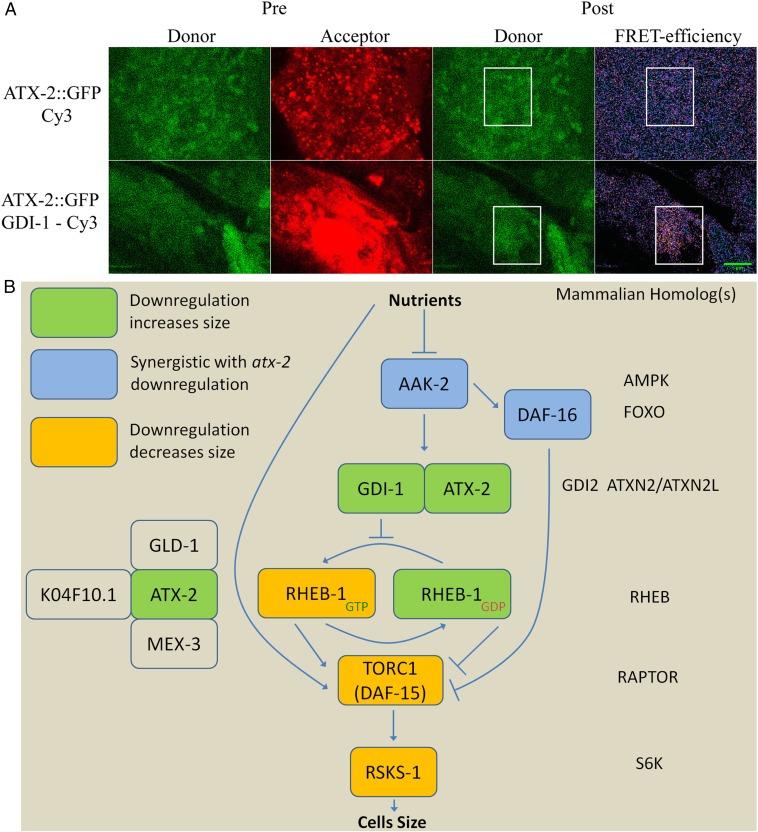
ATX-2 regulatory model. (A) FRET indicates a direct interaction between GDI-1 and ATX-2. Animals expressing both ATX-2tg and GDI-1::MYC in an atx-2(tm3562) background were stained with mouse anti-MYC-tag (9E10) and Cy3 anti-mouse. Using acceptor photobleaching, energy transfer was observed between donor (ATX-2::GFP) and acceptor (Cy3 bound to GDI-1::MYC). Control animals expressing only ATX-2tg were stained with MYC antibody with minimal washes. (Scale bar: 5 µm.) (B) Schematic model of the control of cell size by an ATX-2 complex in the mTOR pathway.
Fig. 3.
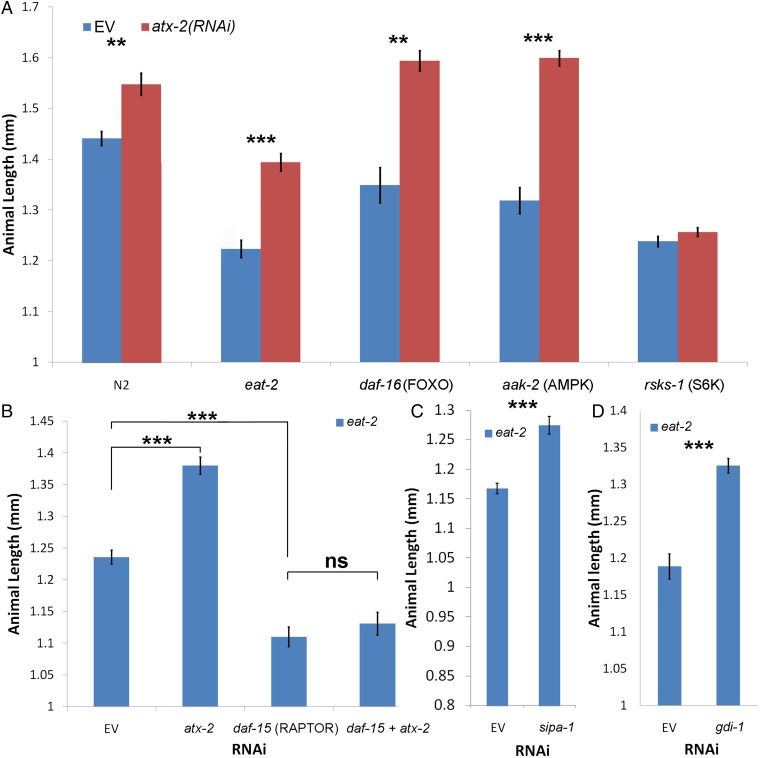
atx-2 regulates animal size via the mTOR pathway. (A) The size effect of atx-2(RNAi) on different strains mutated in key metabolism regulating genes. n = 194. (B) Down-regulation of daf-15 (RAPTOR) suppresses the increase in animal length size following atx-2(RNAi) treatment. n = 117. (C) SIPA-1 shows structural similarity to TSC2. sipa-1(RNAi) causes an increase in animal length. n = 56. (D) gdi-1(RNAi) treatment increases the length of eat-2 mutants. n = 57. In A–D, error bars represent mean ± SEM. *P < 0.01; **P < 10−4; ***P < 10−6.
Fig. S4.
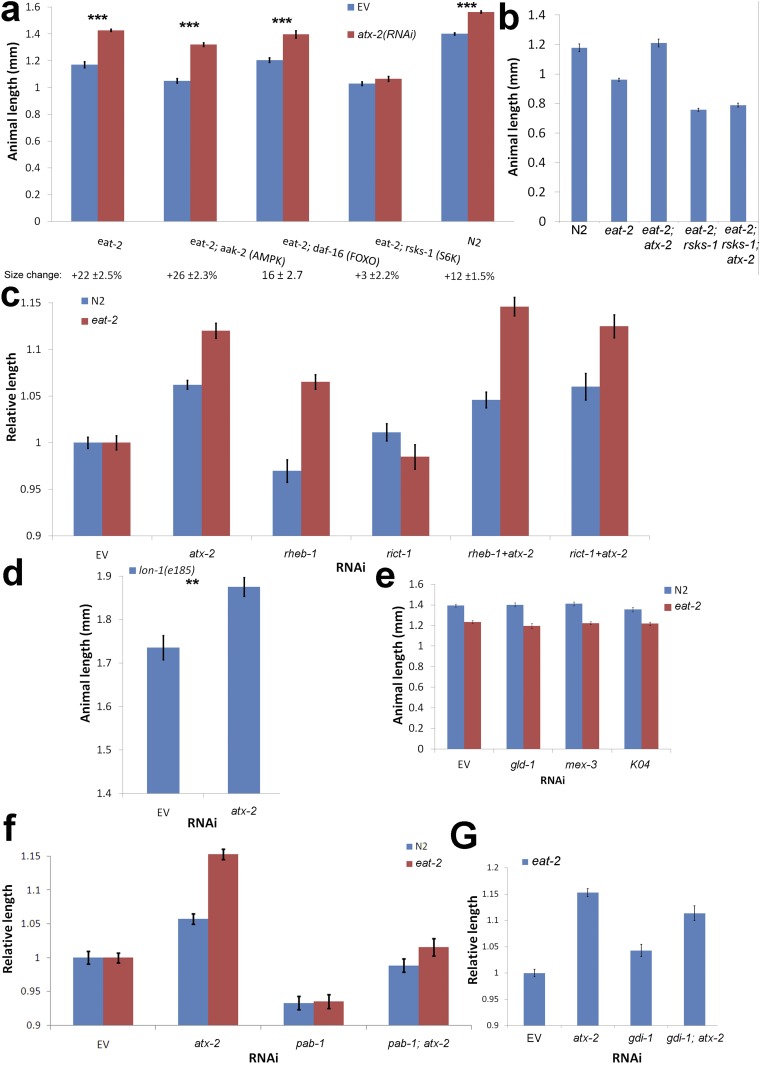
Mapping atx-2 to the mTOR pathway. (A) Postdevelopmental down-regulation of key metabolic genes shows that S6K (rsks-1) is essential for the effect of atx-2 on animal length. n = 231. (B) Deletion of rsks-1 prevents a size increase in atx-2 null animals in an eat-2 background. n = 61. (C) Postdevelopmental down-regulation of mTOR pathway genes demonstrates that rheb-1, but not rict-1 (RICTOR), affects the length of eat-2 animals. n = 217. (D) atx-2(RNAi) further increases the length of lon-1 mutants. Shown is the length of lon-1(e185) animals grown on EV or atx-2(RNAi) plates. n = 61. P = 0.0003, two tailed t test. (E) Down-regulation of proteins known to bind ATX-2 in the gonad has no effect on animal size. The length of DR (eat-2; red) and WT (N2; blue) animals was measured following down-regulation of gld-1, mex-3, or K04F10.1. n = 225. (F) Down-regulation of pab-1 decreases animal size. The length of eat-2 and WT (N2) animals was measured following down-regulation of pab-1, atx-2, or both. n = 239. (G) gdi-1(RNAi) increases the length of eat-2 mutants. n = 124. The size measurements in B and E were normalized to the same strain fed with EV. *P < 0.01; **P < 10−4; ***P < 10−6. Error bars represent mean ± SEM.
We next mapped where ATX-2 acts in the mTOR pathway. AMP-activated protein kinase (AMPK) and its target DAF-16 (FOXO) are master regulators of cellular energy homeostasis that function upstream of TSC1/TSC2 (29, 30) (Fig. 4B). A deletion of aak-2(ok524), the catalytic unit of AMPK, or daf-16(mu86), was synergistic with the down-regulation of atx-2, showing a similar effect to that of eat-2(ad1116). Animals lacking aak-2 were smaller in size; however, on atx-2(RNAi), the animals grew longer, reaching the same size as atx-2(RNAi) WT animals (Fig. 3A). We conclude that ATX-2 functions downstream of AMPK and DAF-16.
To further validate these results, we tested the effect of atx-2 null on the size of rsks-1 null eat-2(ad1116) animals. If ATX-2 indeed acts upstream of RSKS-1, then these animals would not exhibit a significant size increase compared with atx-2 WT. Indeed, atx-2 null had no effect on the size of eat-2(ad1116); rsks-1(ok1255) null animals, but rescued the size of eat-2(ad1116) animals (Fig. S4B).
At low energy levels, AMPK acts on the TSC1/2 complex, a GTPase-activating protein for Ras homolog enriched in brain (RHEB), to change its form from RHEB-GTP, which activates TORC1, to RHEB-GDP, which represses TORC1. This repression results in the suppression of both S6K activity and cell growth (11). Indeed, eat-2(ad1116) animals down-regulated for rheb-1 showed an increase in length (6.5%; P < 10−6) (Fig. S4C). Down-regulation of both atx-2 and rheb-1 had no significant additive effect over the down-regulation of atx-2 alone, suggesting that these genes share a pathway or downstream targets (12% for atx-2 vs. 14.6% for atx-2; rheb-1; P = 0.046) (Fig. S4C). Furthermore, down-regulation of RAPTOR (daf-15), a key member of TORC1, mildly decreased the size of eat-2 mutants and blocked the size increase caused by atx-2(RNAi) (Fig. 3B). In contrast, perturbing the TORC2 complex by down-regulation of RICTOR (F29C12.3) had no effect on the size of eat-2(ad1116) animals (Fig. S4C). We conclude that ATX-2 acts upstream of RHEB-1 and RAPTOR in the mTOR pathway to regulate animal size.
Whereas human ataxin-2-like protein associates with TSC1 (28), C. elegans has no known homologs for either TSC1 or TSC2. The C. elegans signal-induced proliferation-associated gene sipa-1, a member of the tuberous sclerosis protein complex (28), shows a partial homology to TSC2 (BLAST comparison) (31). Down-regulation of sipa-1 in eat-2(ad1116) animals caused a size increase (9.2%; P < 10−5) (Fig. 3C). Immunoprecipitation of ATX-2 revealed multiple interacting partners (Table S2), including (among others) a known member of the tuberous sclerosis protein complex, dihydrolipoamide S-succinyltransferase (28), and a GDP dissociation inhibitor (GDI-1). BLAST analysis showed that GDI-1 is homologous to the human GDI2, a GDP–GTP exchange inhibitor acting on members of the Ras family. Down-regulation of gdi-1 increased the size of eat-2(ad1116) animals by 11.5% (P < 10−7) (Fig. 3D), whereas down-regulation of both atx-2 and gdi-1 produced no additive effect over down-regulation of atx-2 alone (Fig. S4G). We conclude that GDI-1 and ATX-2 regulate animal size via a shared pathway.
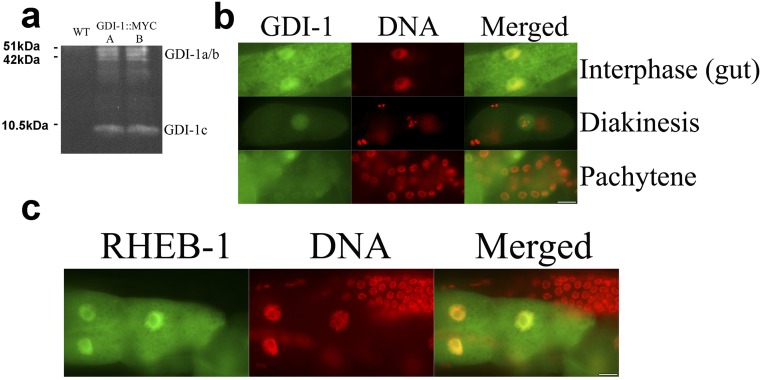
To further demonstrate the interaction between ATX-2 and GDI-1, we generated transgenic animals expressing GDI-1::MYC under its native promoter. At various stages of the cell cycle, GDI-1::MYC exhibited three isoforms (www.wormbase.org/species/c_elegans/gene/WBGene00001558) and was localized mainly to the nucleus, but not to the chromatin (Fig. S5 A and B). A similar localization pattern was seen in RHEB::GFP (Fig. S5C). Whereas the GDI-1::MYC transgenic animals grew normally, when crossed into an ATX-2tg background, these animals had few embryos and a high embryonic lethality. Despite several attempts, we did not manage to produce a stable strain overexpressing both ATX-2tg and GDI-1::MYC in an atx-2(tm3562) background. This result suggests that ATX-2tg is sensitive to GDI-1 overexpression. Nonetheless, Förster resonance energy transfer (FRET) experiments in the animals that survived showed a direct interaction between ATX-2 and GDI-1 (FRET efficiency of 0.3 vs. <0.1 in all controls (Fig. 4A). Taken together, these results suggest that ATX-2 in direct association with GDI-1 in a TSC1-like complex suppresses animal size by inhibiting TORC1, downstream of AMPK and DAF-16 and upstream of RHEB-1 and S6K (Fig. 4B).
Fig. S5.
GDI-1 and RHEB-1 localize to both the nucleus and the cytoplasm. (A) Protein blot analysis of two lines expressing GDI-1 fused to a MYC tag. (B and C) animals expressing GDI-1::MYC (B) or RHEB-1::GFP (C) were stained with DAPI. Images show gonad (B) and gut (B and C) of young adult animals. (Scale bars: 10 µm.) Control WT animals stained with anti-MYC antibodies did not show specific staining.
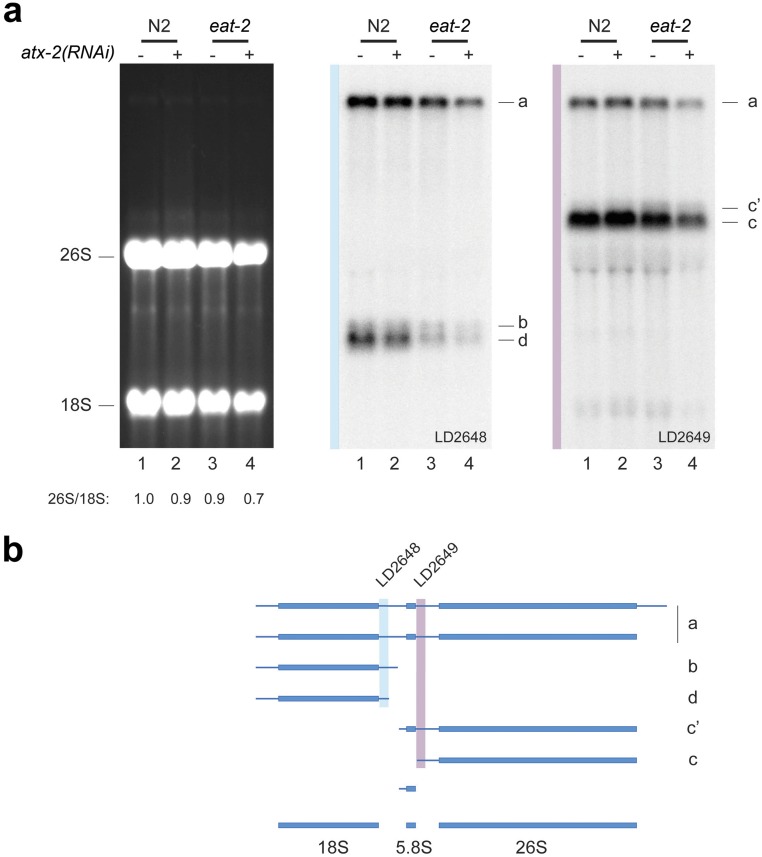
Cell growth requires protein production and thus active ribosome synthesis (32, 33). Mutations in genes that affect ribosome synthesis in Drosophila result in animals with small cells [the “minute” phenotype (33–35)]. ATX-2 does not regulate cell size and body fat content simply through ribosome synthesis, however. Depletion of ATX-2 in WT animals (N2) did not significantly impact ribosome synthesis while conferring markedly increased animal size (Fig. 3A and Fig. S6; compare lanes 1 and 2). Moreover, the mild ribosome synthesis reduction observed in eat-2 worms was not suppressed, but rather was slightly exacerbated, on ATX-2 depletion, whereas both animal size and body fat content were at least partially restored (Figs. 1 and 2 and Fig. S6; compare lanes 3 and 4). We conclude that ribosome synthesis does not play a role in the ATX-2–dependent regulation of animals’ response to DR.
Fig. S6.
ATX-2 does not control animal size and body fat content through ribosome synthesis. (A) Northern blot analysis of total RNA extracted from worms. (Left) Digital capture of an ethidium bromide-stained denaturing agarose gel, showing the steady-state accumulation of mature 18S and 26S rRNAs. 26S/18S rRNA ratio calculated from Agilent electropherograms. (Middle and Right) Gel transferred to nylon and hybridized to probes to detect major pre-rRNA intermediates. (B) A pre-rRNA processing pathway in worms (35).
The down-regulation of atx-2 in eat-2(ad1116) animals caused an increase in animal size of 10–25%, compared with 5–12% in WT animals (Fig. 3A and Fig. S4). To exclude the possibility that physical constraints were the cause of the limited size effect of atx-2(RNAi) in WT animals, and to investigate the role of TGF-β signaling in atx-2 size regulation, we knocked down atx-2 in lon-1(e185) mutant animals, which are long owing to a single nucleotide substitution in a target of DBL-1 (TGF-β homolog). Nonetheless, following atx-2(RNAi), the lon-1(e185) animals grew even longer (Fig. S4D), with some animals exceeding 2 mm in length. To the best of our knowledge, these are the longest C. elegans reported to date. These results indicate that the size effect in previously tested animals is not limited by physical constraints on the size of the animal, and that atx-2 can act independently of the TGF-β pathway.
Previous elegant studies have characterized proteins that interact with atx-2 and regulate germ-line translation (14). However, down-regulating these factors showed no size effect (Fig. S4E), suggesting that these previously assigned roles for atx-2 are independent of its role in regulating animal size. Ataxin-2 also interacts with the poly (A)-binding protein, PAB-1 (14); however, down-regulation of pab-1 decreased animal size in both WT and eat-2(ad1116) animals to a similar extent, and down-regulation of atx-2 could only partially rescue this phenotype, suggesting that ATX-2 acts independently of PAB-1 in regulating the DR phenotypes (Fig. S4F).
Discussion
ATX-2 Regulates Animal and Cell Size.
DR reduces animal size, fat levels, rate of development, and brood size and can extend lifespan. A master regulator of these traits is the mTOR pathway, which is inhibited by DR (36). Here we have shown that atx-2 is a key regulator of four of these phenotypes: animal size, fat content, developmental rate, and brood size. Down-regulation of atx-2 in DR animals mimics the WT state, causing them to grow faster, grow larger, and accumulate more fat. In contrast, overexpression of atx-2 in well-fed animals decreases animal size and fecundity. Knockdown of ATX-2 causes sterility, whereas overexpression reduces brood size. These effects may be the result of tissue-specific roles of ATX-2. Whereas down-regulation of ATX-2 affects germ-line translation, causing sterility, up-regulation of ATX-2 inhibits the mTOR pathway, previously shown to decrease fecundity (37). In C. elegans, DR does not alter the number of cells; thus, the increase in size of the body muscle cells in atx-2(RNAi) animals, which is proportional to the increase in animal size, indicates that atx-2 increases animal size by regulating cell size. We found that atx-2 down-regulation had no effect on animal lifespan.
Multiple studies have explored the link between size and lifespan (36, 38). Here we show that ameliorating the reduced size and fat content of eat-2 animals does not compromise their long lifespan. Nonetheless, previous studies have shown that some genes are essential for lifespan extension in some DR regimens, but not in others (7). Thus, we cannot exclude the possibility that atx-2 is essential for lifespan extension under other DR regimens. It is worth mentioning that although atx-2 has a pivotal role in determining cell size and animal size through the mTOR pathway, other genes control animal size independent of atx-2, including the TGF-β homolog dbl-1. In nematodes, DBL-1 regulates polyploidization and body length through LON-1 (39, 40). It will be interesting to investigate whether ATX-2 affects the polyploidity of hypodermal nuclei.
ATX-2 Regulates Animal and Cell Size via the mTOR Pathway.
The mTOR pathway is a key regulator of growth and metabolism. Multiple indicators of energy and nutrient availability flow into this pathway, and global regulation of translation is a key output. For example, AMPK senses the AMP:ATP ratio. Deletion of the catalytic subunit of AMPK without malnutrition is sufficient to decrease animal size (Fig. 2A). This further supports the notion that the size changes in DR result from a genetically controlled process. On down-regulation of atx-2, no significant difference was seen between WT [atx-2(RNAi)] and aak-2 null [atx-2(RNAi)] animals (P = 0.068) (Fig. 2A). We conclude that atx-2(RNAi) completely suppresses the size decrease resulting from aak-2 knockout. Interestingly, deletion of daf-16, a key transcription factor of the insulin-like signaling pathway and a known target of AMPK, has a similar, but milder effect. In support of these findings, previous research has shown that mutations in daf-2, an inhibitor of daf-16, also rescue the size of eat-2 mutants (41). These results suggest cross-talk between the insulin-like signaling pathway and the mTOR pathway.
ATX-2 Regulates Animal and Cell Size Upstream to RHEB-1, RAPTOR, and S6 Kinase.
S6K is a major target of the mTOR pathway. When activated by phosphorylation, S6K phosphorylates S6 to regulate the translational rate of multiple mRNAs. Unlike atx-2 and other key components of the mTOR pathway [e.g., daf-15 (RAPTOR), rsks-1], the catalytic subunit of S6K in C. elegans is not essential. Deletion of rsks-1 almost completely blocks the size increase of atx-2(RNAi). Thus, S6K translational regulation is an essential mTOR branch for atx-2–dependent size regulation; however, other functions of atx-2, including gonadal functionality, likely are independent of S6K activity.
At the molecular level, we found that ATX-2 directly associates with GDI-1 to inhibit TORC1. Genetic analysis suggests that atx-2 functions upstream of RHEB-1 (Fig. S4C). The predicted function of GDI-1 is to inhibit the dissociation of GDP from Ras family member proteins, like RHEB-1. In addition, RHEB-1 contains a predicted GDI-1 binding domain (42). These results lead us to speculate that GDI-1 regulates the dissociation of GDP from RHEB-1. Given that down-regulation of RHEB-1 has opposing effects on the size of DR and WT animals, this work supports the previously suggested role of RHEB-1 unbound to GTP as an active repressor of mTOR (43). Taken together, these results suggest that the switch of RHEB-1 from GDP to GTP, a key regulator of the mTOR pathway, is inhibited by GDI-1.
ATX-2 Regulates the Decrease in Fat Levels in DR Animals.
DR is known to reduce body size and fat levels, increase insulin sensitivity and stress resistance, and reduce the risk of diabetes. Some dietary regimens manage to separate these effects. Intermittent fasting (i.e., alternate-day fasting) in mice can have beneficial outcomes without significantly affecting total calories consumed or body weight (44). Intermittent fasting in C. elegans is mediated by signaling through RHEB-1 (45). We found that atx-2 regulates fat accumulation under DR, upstream of RHEB-1. The regulation of fat accumulation is mediated, at least in part, by the sbp-1 gene, which is a known target of the mTOR pathway.
On down-regulation of atx-2, DR animals accumulate more fat, without any obvious associated defects. However, Oil Red O staining suggests that these animals fail to reach WT levels. Future studies will determine the mechanism of ATX-2–dependent fat reduction in DR animals.
Our results also suggest that the decreases in animal size and fat content are not passive processes resulting from lack of resources. Active processes are responsible for directing available nutrients away from growth and fat accumulation in DR animals, because overexpression of atx-2 leads to a decrease in animal size, despite the abundance of food, thereby mimicking the DR state. Interestingly, adult-onset obesity was observed in Atxn2 null mice (17), and a recent study found that the ATXN2 containing the 12q24 human locus is associated with type I diabetes (20). These data suggest conserved roles for ATXN2 in regulating metabolism.
Although we chose to focus on the interaction of ATX-2 with GDI-1, other identified interactions also may play key roles in regulating metabolism. These include the acyl-CoA dehydrogenases acdh-10 and acdh-7 (bound to both WT and DR ATX-2) and acdh-1 and acdh-3 (bound to WT ATX-2 only); clpp-1, an essential member of the mitochondrial unfolded protein stress response (46); and succinyl CoA synthetase (suca-1), an enzyme that catalyzes the reaction of succinyl-CoA to succinate, coupled with formation of a nucleoside triphosphate molecule (ATP or GTP) (47). C. elegans lacks well-conserved TSC1/2 proteins (48). We found that other members of the TSC complex, including ATX-2, actively regulate RHEB-1 and likely serve a similar function.
Obesity is a leading risk factor for many severe chronic diseases, including diabetes, cardiovascular diseases, and cancers. Our present findings also provide insight into understanding the processing and regulation of body fat, potentially contributing to the development of effective therapies to combat one of the developed world's largest epidemics.
Materials and Methods
C. elegans Strains.
Strain maintenance and manipulations were performed under standard conditions as described previously (49). All experiments were performed at 23 °C. A complete list of the C. elegans strains used in this work is available in Table S3. Strains created for this work were generated by microinjections and genetic crossings. The progeny of heterozygous animals not expressing the hT2 pharyngeal GFP marker were selected as homozygous null animals. Some strains were provided by the Caenorhabditis Genetics Center, which is funded by National Institutes of Health’s Office of Research Infrastructure Programs (P40 OD010440). Some strains were also provided by the National BioResource Project of Japan, and some constructs were provided by TransgeneOme (50).
Statistics.
Unless noted otherwise, pairwise comparisons were performed using an unpaired two-tailed Student t test.
RNAi Experiments.
RNAi feeding experiments were done essentially as described previously (www.wormbook.org/chapters/www_introreversegenetics/introreversegenetics.html). In brief, nematode growth medium (NGM) plates containing 25 μg/mL ampicillin and 1 mM isopropyl β-d-thiogalactoside (IPTG) were seeded with the appropriate bacteria taken from either the Ahringer library (51) or the Vidal library (52) or Escherichia coli HT115(DE3) cells transformed with an appropriate vector (atx-2a,c,d; atx-2d; daf-15 (RAPTOR); or sipa-1). Worms were placed on plates at the appropriate developmental stage and analyzed for various phenotypes. When antibodies or GFP fusions were available, the down-regulation efficiency was verified by analyzing the levels of proteins. In most other cases, either the level of mRNAs of the interested genes was analyzed by quantitative PCR or the animal phenotypes matched the published data.
Size Experiments.
Animals were synchronized by bleaching or by allowing them to lay eggs on plates for 6 h. In RNAi experiments, except for daf-15 (Fig. 3B), animals were allowed to develop on NGM plates for 48 h until the eat-2 worms reached larval stage 3. Animals were transferred to RNAi plates, and then to fresh RNAi plates every 48 h, to exclude progeny. Unless noted otherwise, size measurements were performed after 72 h of growth on RNAi plates. After bleaching, animals down-regulated for RAPTOR (daf-15) were moved to daf-15 RNAi plates, and then moved again to appropriate plates (daf-15 or daf-15 + atx-2) after 48 h. For liquid culture experiments, synchronized embryos were placed in a 24-well plate (Nalge Nunc) with 2 mL of S medium (www.wormbook.org/chapters/www_strainmaintain/strainmaintain.html), supplemented with 1 mM IPTG and bacteria at the appropriate concentrations. For genetic validation experiments, offspring of YG2244 [eat-2(ad1116), rsks-1(ok1255), and atx-2(tm3562/hT2)] were sorted to separate out the atx-2 null (tm3562; fosmid loss) animals. All animals in the experiment were allowed to develop for 4 d on plates seeded with OP50. Animals were imaged with an Olympus MVX10 dissecting microscope with an Axiocam CCD (Carl Zeiss) or a Dino-Lite Microscope with a Dino-Eye camera (AnMo Electronics). Size was measured using ImageJ. Between 10 and 50 animals were used for each data point, and key experiments were repeated more than seven times. Length was measured from head to tail along the animal’s body, and width was measured at the widest point. P values were calculated using a two-tailed t test.
Lifespan Assay.
Synchronized animals were grown on NGM plates seeded with OP50 for 48 h and then moved to RNAi plates. Between three and five plates containing ∼90 animals per strain per treatment were used for each experiment. Animals were moved to new plates every other day while laying eggs and at least every week after the egg-laying period. Animals were considered dead when they no longer responded to gentle prodding with a platinum wire. Scoring was performed every other day. Survival plots were generated using OASIS (53). Lifespans were calculated after all animals in the experiment died. Experiments were repeated six times. Results from the different experiments are reported in Table S1.
Microscopy.
The image shown in Fig 1C was acquired using a Dino-Eye camera mounted on an Olympus MVX10 dissecting microscope, and that shown in Fig. 1D was acquired using an ORCA-R2 camera (Hamamatsu Photonics) mounted on an Axioplan 2 microscope. Images were deconvolved using AutoQuant X. All other microscopy images, including those used to generate Fig. 1F, were acquired with a Leica SP5 confocal microscope. FRET experiments were performed using the FRET Acceptor PhotoBleaching (AB) mode of the SP5 confocal microscope. For controls, YG2239 was stained nonspecifically with MYC antibodies without washing.
Oil Red O, Sudan Black B, and Nile Red Staining.
Oil Red O staining and quantification were performed as described previously (23). Animals were imaged on a Nikon Eclipse E200 microscope with an X4 lens fitted with a Moticam 2300 color camera (Motic). Exposure levels were adjusted to give clear staining but avoid saturation. Experiments were repeated three times. To avoid background from eggs, the Sudan Black B staining and quantification were performed on 9-d-old animals, as described previously (54). Animals were imaged on a Zeiss Axioplan II microscope with a Hamamatsu CCD camera. Quantification was performed with the ImageJ package. P values were calculated using a two-sample t test for unequal variances.
sbp-1p::GFP Analysis.
Transgenic WT (N2) and eat-2 animals expressing GFP driven by the promoter of the sbp-1 gene were synchronized to the fourth larval stage. Animals were then down-regulated for 48 h for atx-2. After 48 h, the animals were transferred to new RNAi feeding plates and held for an additional 24 h. Each experiment included ∼30 worms. Empty L4440 vector (EV) served as a control. GFP expression was recorded using an Olympus MVX10 microscope. Quantification was performed with the ImageJ package. P values were calculated using a two-sample t test for unequal variances.
Fecundity.
Animals at the third or fourth larval stage, expressing ATX-2tg in a wild-type background, were divided to three groups: no expression (animals showing minimal or no ATX-2tg expression, either due to low expression level, transgene silencing or transgene loss), medium ATX-2tg expression, and high ATX-2tg expression. Expression levels were determined by visual inspection with a MVX10 dissecting microscope. Ten animals from each group were placed on NGM plates, one worm per plate, and were then moved to new plates every day until egg-laying ceased. Live offspring were counted at 48 h after adults were removed from the plate. Each experiment was repeated twice.
Development.
eat-2 embryos were synchronized by bleaching of young adults and immediately placed on control (EV) or atx-2 RNAi plates. Animal developmental stage was visually inspected under a dissecting microscope at 3 d after bleaching. Approximately 100 animals were scored for each treatment.
Western Blot Analysis.
Equal numbers of animals were washed in PBS and heated for 10 min to 100 °C in sample loading buffer. Aliquots were loaded onto a 12% SDS-polyacrylamide gel and blotted onto a nitrocellulose membrane. Membranes were blocked with PBST-milk (10%) and then incubated for 1 h at room temperature with anti-FLAG antibody (F1804, 1:1,000; Sigma-Aldrich) or anti-MYC (9E10; 1:300; Sigma-Aldrich). Affinity-purified HRP anti-mouse (Jackson ImmunoResearch) served as the secondary antibody. Detection was performed using MF-ChemiBIS 3.2 (DNR Bio-Imaging Systems).
RNA Electrophoresis and Northern Blot Analysis.
For analysis of rRNA processing, 5 µg of total RNA was resolved on agarose denaturing gels (6% formaldehyde/1.2% agarose in Hepes-EDTA buffer) for 16 h at 60 V. Agarose gels were transferred by capillarity overnight in 10× SSC on nylon membranes (GE Healthcare). The membranes were prehybridized for 1 h at 65 °C in 50% formamide, 5× SSPE, 5× Denhardt’s solution, 1% wt/vol SDS, and 200 µg/mL fish sperm DNA solution (Roche). The 32P-labeled oligonucleotide probe was added, followed by incubation for 1 h at 65 °C and then overnight at 37 °C. The probe sequences were as follows: LD2648 (ITS1): 5′-CACTCAACTGACCGTGAAGCCAGTCG; LD2649 (ITS2): 5′-GGACAAGATCAGTATGCCGAGACGCG. Northern blots were exposed to Fuji imaging plates (Fujifilm), and signals were acquired with a Fuji FLA-7000 PhosphorImager (Fujifilm). The 26S/18S rRNA ratio was calculated from electropherograms using an Agilent Bioanalyzer.
Coimmunoprecipitation.
Strains YG2239 and YG2240 were each grown on 10-cm NGM plates. WT (N2) animals served as controls for nonspecific binding. Mixed-stage animals were washed several times to remove bacteria, then flash-frozen in liquid nitrogen and homogenized on ice. ATX-2tg was immunoprecipitated using anti-FLAG M2 magnetic beads (Sigma-Aldrich). The samples were analyzed by LC-MS/MS (OrbitrapXL; Thermo Fisher Scientific) and identified against the National Center for Biotechnology Information nonredundant C. elegans database with the SEQUEST search engine, using Discoverer version 1.4.
Supplementary Material
Acknowledgments
We thank Alon Zaslaver and Ehud Cohen for a critical reading of the manuscript, and the members of the Y.G. laboratory for technical assistance and suggestions. This work was supported by the United States–Israel Binational Science Foundation (Grant 2007215), the Muscular Dystrophy Association, the Niedersachsen-Israeli Research Cooperation, the Israel Science Foundation, and the European Cooperation in Science and Technology Action (Grant BM1002; Nanonet).
Footnotes
The authors declare no conflict of interest.
This article is a PNAS Direct Submission.
This article contains supporting information online at www.pnas.org/lookup/suppl/doi:10.1073/pnas.1512156113/-/DCSupplemental.
References
- 1.Mair W, Dillin A. Aging and survival: The genetics of life span extension by dietary restriction. Annu Rev Biochem. 2008;77:727–754. doi: 10.1146/annurev.biochem.77.061206.171059. [DOI] [PubMed] [Google Scholar]
- 2.Trepanowski JF, Canale RE, Marshall KE, Kabir MM, Bloomer RJ. Impact of caloric and dietary restriction regimens on markers of health and longevity in humans and animals: A summary of available findings. Nutr J. 2011;10:107. doi: 10.1186/1475-2891-10-107. [DOI] [PMC free article] [PubMed] [Google Scholar]
- 3.McCay CM, Crowell MF, Maynard LA. The effect of retarded growth upon the length of life span and upon the ultimate body size. 1935. Nutrition. 1989;5(3):155–171, discussion 172. [PubMed] [Google Scholar]
- 4.Mörck C, Pilon M. Caloric restriction and autophagy in Caenorhabditis elegans. Autophagy. 2007;3(1):51–53. doi: 10.4161/auto.3418. [DOI] [PubMed] [Google Scholar]
- 5.Palgunow D, Klapper M, Döring F. Dietary restriction during development enlarges intestinal and hypodermal lipid droplets in Caenorhabditis elegans. PLoS One. 2012;7(11):e46198. doi: 10.1371/journal.pone.0046198. [DOI] [PMC free article] [PubMed] [Google Scholar]
- 6.Walker G, Houthoofd K, Vanfleteren JR, Gems D. Dietary restriction in C. elegans: From rate-of-living effects to nutrient sensing pathways. Mech Ageing Dev. 2005;126(9):929–937. doi: 10.1016/j.mad.2005.03.014. [DOI] [PubMed] [Google Scholar]
- 7.Greer EL, Brunet A. Different dietary restriction regimens extend lifespan by both independent and overlapping genetic pathways in C. elegans. Aging Cell. 2009;8(2):113–127. doi: 10.1111/j.1474-9726.2009.00459.x. [DOI] [PMC free article] [PubMed] [Google Scholar]
- 8.Depuydt G, et al. Reduced insulin/insulin-like growth factor-1 signaling and dietary restriction inhibit translation but preserve muscle mass in Caenorhabditis elegans. Mol Cell Proteomics. 2013;12(12):3624–3639. doi: 10.1074/mcp.M113.027383. [DOI] [PMC free article] [PubMed] [Google Scholar]
- 9.Cargnello M, Tcherkezian J, Roux PP. The expanding role of mTOR in cancer cell growth and proliferation. Mutagenesis. 2015;30(2):169–176. doi: 10.1093/mutage/geu045. [DOI] [PMC free article] [PubMed] [Google Scholar]
- 10.Dobashi Y, Watanabe Y, Miwa C, Suzuki S, Koyama S. Mammalian target of rapamycin: A central node of complex signaling cascades. Int J Clin Exp Pathol. 2011;4(5):476–495. [PMC free article] [PubMed] [Google Scholar]
- 11.Laplante M, Sabatini DM. mTOR signaling in growth control and disease. Cell. 2012;149(2):274–293. doi: 10.1016/j.cell.2012.03.017. [DOI] [PMC free article] [PubMed] [Google Scholar]
- 12.Satterfield TF, Jackson SM, Pallanck LJ. A Drosophila homolog of the polyglutamine disease gene SCA2 is a dosage-sensitive regulator of actin filament formation. Genetics. 2002;162(4):1687–1702. doi: 10.1093/genetics/162.4.1687. [DOI] [PMC free article] [PubMed] [Google Scholar]
- 13.Maine EM, Hansen D, Springer D, Vought VE. Caenorhabditis elegans atx-2 promotes germline proliferation and the oocyte fate. Genetics. 2004;168(2):817–830. doi: 10.1534/genetics.104.029355. [DOI] [PMC free article] [PubMed] [Google Scholar]
- 14.Ciosk R, DePalma M, Priess JR. ATX-2, the C. elegans ortholog of ataxin 2, functions in translational regulation in the germline. Development. 2004;131(19):4831–4841. doi: 10.1242/dev.01352. [DOI] [PubMed] [Google Scholar]
- 15.Mangus DA, Amrani N, Jacobson A. Pbp1p, a factor interacting with Saccharomyces cerevisiae poly(A)-binding protein, regulates polyadenylation. Mol Cell Biol. 1998;18(12):7383–7396. doi: 10.1128/mcb.18.12.7383. [DOI] [PMC free article] [PubMed] [Google Scholar]
- 16.Drost J, et al. Ataxin-2 modulates the levels of Grb2 and SRC but not ras signaling. J Mol Neurosci. 2013;51(1):68–81. doi: 10.1007/s12031-012-9949-4. [DOI] [PMC free article] [PubMed] [Google Scholar]
- 17.Kiehl TR, et al. Generation and characterization of Sca2 (ataxin-2) knockout mice. Biochem Biophys Res Commun. 2006;339(1):17–24. doi: 10.1016/j.bbrc.2005.10.186. [DOI] [PubMed] [Google Scholar]
- 18.Lastres-Becker I, et al. Insulin receptor and lipid metabolism pathology in ataxin-2 knock-out mice. Hum Mol Genet. 2008;17(10):1465–1481. doi: 10.1093/hmg/ddn035. [DOI] [PubMed] [Google Scholar]
- 19.Meierhofer D, Halbach M, Sen NE, Gispert S, Auburger G. Atxn2-knockout mice show branched chain amino acids and fatty acids pathway alterations. Mol Cell Proteomics. 2016;15(5):1728–1739. doi: 10.1074/mcp.M115.056770. [DOI] [PMC free article] [PubMed] [Google Scholar]
- 20.Auburger G, et al. 12q24 locus association with type 1 diabetes: SH2B3 or ATXN2? World J Diabetes. 2014;5(3):316–327. doi: 10.4239/wjd.v5.i3.316. [DOI] [PMC free article] [PubMed] [Google Scholar]
- 21.Lakowski B, Hekimi S. The genetics of caloric restriction in Caenorhabditis elegans. Proc Natl Acad Sci USA. 1998;95(22):13091–13096. doi: 10.1073/pnas.95.22.13091. [DOI] [PMC free article] [PubMed] [Google Scholar]
- 22.Sánchez-Blanco A, Kim SK. Variable pathogenicity determines individual lifespan in Caenorhabditis elegans. PLoS Genet. 2011;7(4):e1002047. doi: 10.1371/journal.pgen.1002047. [DOI] [PMC free article] [PubMed] [Google Scholar]
- 23.O’Rourke EJ, Soukas AA, Carr CE, Ruvkun G. C. elegans major fats are stored in vesicles distinct from lysosome-related organelles. Cell Metab. 2009;10(5):430–435. doi: 10.1016/j.cmet.2009.10.002. [DOI] [PMC free article] [PubMed] [Google Scholar]
- 24.Yen K, et al. A comparative study of fat storage quantitation in nematode Caenorhabditis elegans using label and label-free methods. PLoS One. 2010;5(9):e12810. doi: 10.1371/journal.pone.0012810. [DOI] [PMC free article] [PubMed] [Google Scholar]
- 25.Joo HJ, et al. Caenorhabditis elegans utilizes dauer pheromone biosynthesis to dispose of toxic peroxisomal fatty acids for cellular homoeostasis. Biochem J. 2009;422(1):61–71. doi: 10.1042/BJ20090513. [DOI] [PubMed] [Google Scholar]
- 26.Haithcock E, et al. Age-related changes of nuclear architecture in Caenorhabditis elegans. Proc Natl Acad Sci USA. 2005;102(46):16690–16695. doi: 10.1073/pnas.0506955102. [DOI] [PMC free article] [PubMed] [Google Scholar]
- 27.Heestand BN, et al. Dietary restriction-induced longevity is mediated by nuclear receptor NHR-62 in Caenorhabditis elegans. PLoS Genet. 2013;9(7):e1003651. doi: 10.1371/journal.pgen.1003651. [DOI] [PMC free article] [PubMed] [Google Scholar]
- 28.Guo L, et al. Tandem affinity purification and identification of the human TSC1 protein complex. Acta Biochim Biophys Sin (Shanghai) 2010;42(4):266–273. doi: 10.1093/abbs/gmq014. [DOI] [PubMed] [Google Scholar]
- 29.Hardie DG, Ross FA, Hawley SA. AMPK: A nutrient and energy sensor that maintains energy homeostasis. Nat Rev Mol Cell Biol. 2012;13(4):251–262. doi: 10.1038/nrm3311. [DOI] [PMC free article] [PubMed] [Google Scholar]
- 30.Greer EL, et al. An AMPK-FOXO pathway mediates longevity induced by a novel method of dietary restriction in C. elegans. Curr Biol. 2007;17(19):1646–1656. doi: 10.1016/j.cub.2007.08.047. [DOI] [PMC free article] [PubMed] [Google Scholar]
- 31.Altschul SF, Gish W, Miller W, Myers EW, Lipman DJ. Basic local alignment search tool. J Mol Biol. 1990;215(3):403–410. doi: 10.1016/S0022-2836(05)80360-2. [DOI] [PubMed] [Google Scholar]
- 32.Hall MN, Raff M, Thomas G. Cell Growth: Control of Cell Size. Cold Spring Harbor Lab Press; Cold Spring Harbor, NY: 2004. [Google Scholar]
- 33.Rudra D, Warner JR. What better measure than ribosome synthesis? Genes Dev. 2004;18(20):2431–2436. doi: 10.1101/gad.1256704. [DOI] [PubMed] [Google Scholar]
- 34.Lambertsson A. The minute genes in Drosophila and their molecular functions. Adv Genet. 1998;38:69–134. doi: 10.1016/s0065-2660(08)60142-x. [DOI] [PubMed] [Google Scholar]
- 35.Kay MAJ-LM. Developmental genetics of ribosome synthesis in Drosophilia. Trends Genet. 1987;3:347–351. [Google Scholar]
- 36.Morselli E, et al. Caloric restriction and resveratrol promote longevity through the Sirtuin-1–dependent induction of autophagy. Cell Death Dis. 2010;1:e10. doi: 10.1038/cddis.2009.8. [DOI] [PMC free article] [PubMed] [Google Scholar]
- 37.Pan KZ, et al. Inhibition of mRNA translation extends lifespan in Caenorhabditis elegans. Aging Cell. 2007;6(1):111–119. doi: 10.1111/j.1474-9726.2006.00266.x. [DOI] [PMC free article] [PubMed] [Google Scholar]
- 38.McCulloch D, Gems D. Body size, insulin/IGF signaling and aging in the nematode Caenorhabditis elegans. Exp Gerontol. 2003;38(1-2):129–136. doi: 10.1016/s0531-5565(02)00147-x. [DOI] [PubMed] [Google Scholar]
- 39.Flemming AJ, Shen ZZ, Cunha A, Emmons SW, Leroi AM. Somatic polyploidization and cellular proliferation drive body size evolution in nematodes. Proc Natl Acad Sci USA. 2000;97(10):5285–5290. doi: 10.1073/pnas.97.10.5285. [DOI] [PMC free article] [PubMed] [Google Scholar]
- 40.Morita K, et al. A Caenorhabditis elegans TGF-beta, DBL-1, controls the expression of LON-1, a PR-related protein, that regulates polyploidization and body length. EMBO J. 2002;21(5):1063–1073. doi: 10.1093/emboj/21.5.1063. [DOI] [PMC free article] [PubMed] [Google Scholar]
- 41.Iser WB, Wolkow CA. DAF-2/insulin-like signaling in C. elegans modifies effects of dietary restriction and nutrient stress on aging, stress and growth. PLoS One. 2007;2(11):e1240. doi: 10.1371/journal.pone.0001240. [DOI] [PMC free article] [PubMed] [Google Scholar]
- 42.Marchler-Bauer A, et al. CDD: NCBI’s conserved domain database. Nucleic Acids Res. 2015;43(Database issue):D222–D226. doi: 10.1093/nar/gku1221. [DOI] [PMC free article] [PubMed] [Google Scholar]
- 43.Long X, Lin Y, Ortiz-Vega S, Yonezawa K, Avruch J. Rheb binds and regulates the mTOR kinase. Curr Biol. 2005;15(8):702–713. doi: 10.1016/j.cub.2005.02.053. [DOI] [PubMed] [Google Scholar]
- 44.Anson RM, et al. Intermittent fasting dissociates beneficial effects of dietary restriction on glucose metabolism and neuronal resistance to injury from calorie intake. Proc Natl Acad Sci USA. 2003;100(10):6216–6220. doi: 10.1073/pnas.1035720100. [DOI] [PMC free article] [PubMed] [Google Scholar]
- 45.Honjoh S, Yamamoto T, Uno M, Nishida E. Signalling through RHEB-1 mediates intermittent fasting-induced longevity in C. elegans. Nature. 2009;457(7230):726–730. doi: 10.1038/nature07583. [DOI] [PubMed] [Google Scholar]
- 46.Haynes CM, Petrova K, Benedetti C, Yang Y, Ron D. ClpP mediates activation of a mitochondrial unfolded protein response in C. elegans. Dev Cell. 2007;13(4):467–480. doi: 10.1016/j.devcel.2007.07.016. [DOI] [PubMed] [Google Scholar]
- 47.Fraser ME, James MN, Bridger WA, Wolodko J. A detailed structural description of Escherichia coli succinly-CoA synthetase. J Mol Biol. 1999;288(3):501. doi: 10.1006/jmbi.1999.2773. [DOI] [PubMed] [Google Scholar]
- 48.Martin TD, et al. Ral and Rheb GTPase activating proteins integrate mTOR and GTPase signaling in aging, autophagy, and tumor cell invasion. Mol Cell. 2014;53(2):209–220. doi: 10.1016/j.molcel.2013.12.004. [DOI] [PMC free article] [PubMed] [Google Scholar]
- 49.Brenner S. The genetics of Caenorhabditis elegans. Genetics. 1974;77(1):71–94. doi: 10.1093/genetics/77.1.71. [DOI] [PMC free article] [PubMed] [Google Scholar]
- 50.Sarov M, et al. A genome-scale resource for in vivo tag-based protein function exploration in C. elegans. Cell. 2012;150(4):855–866. doi: 10.1016/j.cell.2012.08.001. [DOI] [PMC free article] [PubMed] [Google Scholar]
- 51.Kamath RS, et al. Systematic functional analysis of the Caenorhabditis elegans genome using RNAi. Nature. 2003;421(6920):231–237. doi: 10.1038/nature01278. [DOI] [PubMed] [Google Scholar]
- 52.Rual JF, et al. Toward improving Caenorhabditis elegans phenome mapping with an ORFeome-based RNAi library. Genome Res. 2004;14(10B):2162–2168. doi: 10.1101/gr.2505604. [DOI] [PMC free article] [PubMed] [Google Scholar]
- 53.Yang JS, et al. OASIS: Online application for the survival analysis of lifespan assays performed in aging research. PLoS One. 2011;6(8):e23525. doi: 10.1371/journal.pone.0023525. [DOI] [PMC free article] [PubMed] [Google Scholar]
- 54.Harding J. Imaging embryonic morphogenesis in C. elegans. In: Rothman JH, Singson A, editors. Methods in Cell Biology. Vol 106. Academic; New York: 2011. pp. 377–412. [DOI] [PubMed] [Google Scholar]
Associated Data
This section collects any data citations, data availability statements, or supplementary materials included in this article.


