Abstract
SuperLooper2 (SL2) (http://proteinformatics.charite.de/sl2) is the updated version of our previous web-server SuperLooper, a fragment based tool for the prediction and interactive placement of loop structures into globular and helical membrane proteins. In comparison to our previous version, SL2 benefits from both a considerably enlarged database of fragments derived from high-resolution 3D protein structures of globular and helical membrane proteins, and the integration of a new protein viewer. The database, now with double the content, significantly improved the coverage of fragment conformations and prediction quality. The employment of the NGL viewer for visualization of the protein under investigation and interactive selection of appropriate loops makes SL2 independent of third-party plug-ins and additional installations.
INTRODUCTION
Structural biology is an established but still emerging research field of life sciences, as reflected by the exponential rise of atomic models deposited in the Research Collaboratory for Structural Bioinformatics Protein Data Bank (RCSB PDB) (1). However, in more than one half of all entries deposited in the RSCB PDB segments are missing (2). These missing segments are often located in flexible and functionally important regions of proteins such as loops or turns, not resolved by X-ray crystallography or single particle cryo-electron microscopy. These regions have to be modeled to obtain a more complete structural model for further analysis of the structure, e.g. for molecular dynamics simulations (3).
Loop regions are one of the most demanding regions in homology modeling workflows. A prominent example are G protein coupled receptors (GPCRs), which constitute the largest protein family in the human genome. The number of available templates for modeling of GPCRs has increased dramatically in the last decade facilitating the generation of homology models for structure-based drug design. The common topology of the transmembrane-spanning regions, even of distantly related GPCRs, allows homology modeling of these regions and docking of small rigid orthosteric ligands with close to experimental accuracy. However, predictions of long or flexible loops remain unsolved problems, as evaluated recently by the community-wide GPCR Dock assessment (4). As the sequence similarity within loop regions is generally much lower than within other parts of proteins, specialized methods are required for modeling.
Loop modeling approaches can be divided into ab initio (5–8), fragment-based, (9–12) or a mixture of both methods (13,14). Ab initio based methods utilize molecular mechanics force fields to determine possible loop conformations. These methods are generally CPU-intensive but capable of predicting currently unknown loop conformations. Fragment-based methods on the other hand are less CPU-intensive and thus faster, but depend on known structures and precalculated fragment databases to find loop conformations. It remains unclear which method provides the better predictions. Some studies find that both methods perform on a similar level (9,12), while others describe advantages to either ab initio (15) or fragment-based (16) methods. As fragment-based methods generally provide results much faster, they are well suited for web-based tools such as SuperLooper (17), allowing instant visualization and control of the results.
The quality of fragment-based loop predictions using depends on the completeness of the fragment database. Independent studies have shown that the conformational space for short loops up to 12–14 residues is covered by structural fragments derived from the RCSB PDB (18,19). Enlargement of fragment databases may thus particularly enhance prediction of longer loops. Depending on the method used, also the prediction of shorter loops might benefit from a larger pool of available templates, e.g. when the exact fit of the stem atoms of the template loop to the gap is an evaluation criterion. The database of globular and membrane proteins has more than doubled since our previous publication (17). In order to benefit from this enlargement of available structures we updated our fragment database.
Fragment-based tools such as SuperLooper depend on databases too large to distribute as stand-alone programs (∼80 GB in the case of SL2). The rapid delivery of a large number of possible loop conformation makes web-based tools a perfect candidate. The database remains on a server and the user is able to choose a suitable loop from listed results using a web-based molecule viewer. Here, we use NGL (20) for protein and fragment visualization, which adopts capabilities of modern web browsers, such as WebGL for molecular graphics. NGL allows interactive display of even large molecular complexes and is unaffected by the retirement of third-party plug-ins such as Flash or Java-Applets. This viewer offers comprehensive molecular visualization through a graphical user interface so that life scientists can easily access and utilize available structural data without any further installations (20).
Thus, SL2 benefits from the significantly enlarged database of fragments and new fast molecule viewer. Due to the improved coverage of the conformational loop space, the quality of prediction, measured by the backbone root mean square deviation (RMSD), has improved by 20% on average compared to our previous version (17). The new version of our fragment-based web-application for loop modeling SL2 thus has an improved performance in loop prediction as well as an up-to-date visualization.
UPDATE OF THE LIP AND LIMP DATABASE
The loop database (LIP) is composed of all possible fragments of 3–35 amino acids length extracted from the RSCB PDB entries in December 2015. Here, not only loops are considered but also fragments derived from secondary structure elements like helices and β-sheets. For each fragment, the amino acid sequence, PDB identifier, chain identifier, residue number of stem atoms and a geometrical fingerprint is stored.
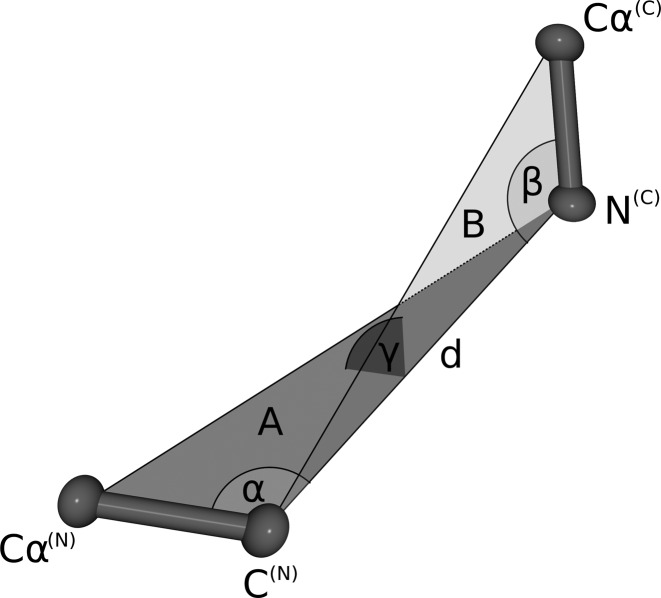
Geometrical fingerprint matching is used as a criterion to estimate the sterical fit of stem atoms of N- and C-termini of each database fragment to the C- and N-terminal stem atoms of a gap in a protein structure. The geometrical fingerprints of both the stem atoms of each database fragment and the stem atoms of the gap are composed of the distance between the N- and C-terminal stem atoms and three angles defining their relative orientation (Figure 1). Compared to our previous version, we slightly altered the geometric fingerprint. Previously, we used a combination of two distances and two angles for scoring, resulting in a higher weighting of the fit of the residue where the angle was measured. In SL2, we solved this problem employing distance and three angles.
Figure 1.
Schematic representation of the geometrical fingerprint: The geometrical fingerprint is characterized by the distance d between the N-terminal C- and the C-terminal N atom and the following three angles: α defined by the line between Cα(N), C(N) and d, β is spanned by the line between N(C), Cα(C) and d, γ is the angle between the two planes A (defined by Cα(N), C(N) and N(C)) and B (Cα(C), C(N) and N(C)).
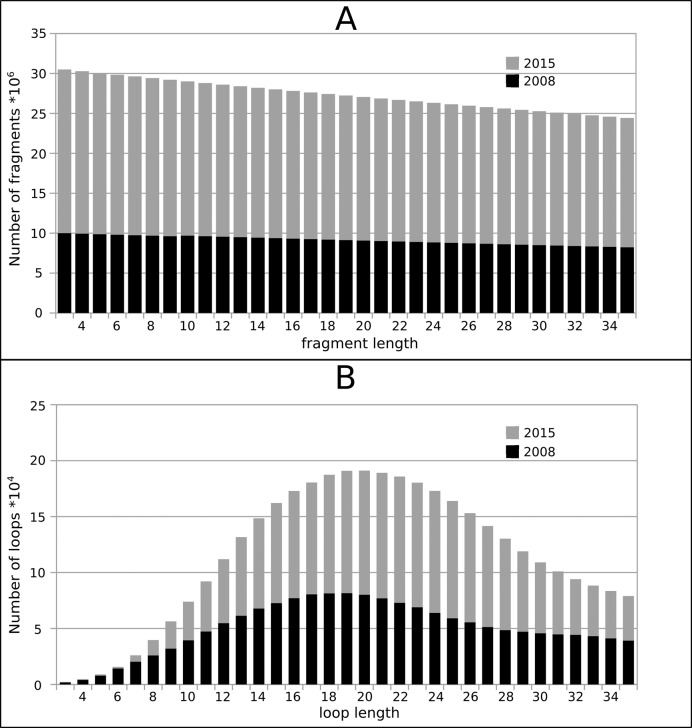
Since the first release of SuperLooper in 2008, the number of entries deposited in the RSCB PDB has more than doubled from 54 543 structures to 114 693 in 2015. A total of 901 609 231 fragments with a length of 3 to 35 residues was extracted from this enlarged pool of template structures (Figure 2A). Because more short than long overlapping fragments are extracted from a given template structure, the number of fragments decreases linearly with length. For loops with three amino acids, more than 30 million fragments are stored in the database, for 35 amino acids 24 million fragments are available. To benefit from the continuous growth of the RCSB PDB an update protocol was implemented that automatically adds novel fragments to the LIP or LIMP database every three months.
Figure 2.
Length dependency of the number of fragments stored in our previous (black) and present fragment (gray) database; (A) loops in proteins (LIP), and (B) loops in membrane proteins (LIMP).
Due to (partial) embedding into the lipid bilayer, loops of membrane proteins have a more hydrophobic amino acid composition compared to loops of globular proteins (21). Tools developed for the prediction of loops connecting transmembrane helices were indeed found to enhance prediction of GPCR loops (22). In SL2, such loops can be selected from LIMP, which is a collection of fragments extracted from loops of all helical transmembrane proteins. Loops were defined as parts without regular fold, thus also containing kinks, bulges or re-entrant loops (23). To allow selection of membrane protein loops taking the lipid bilayer into account, the extension of the lipid bilayer is indicated by two parallel planes (as described below).
The number of membrane protein structures deposited in the RCSB PDB rose from 805 (in 2008) to 2298 (in 2015) according to the Protein Data Bank of Transmembrane Proteins (24). As a result, the loops stored in LIMP doubled from 179 580 to 378 839. For LIMP is composed mainly of loop structures, the length distribution differs from LIP where the fragments also include helical fragments and fragments derived from β-sheets. In LIMP (Figure 2B), few loop templates are available for short loops of 3–5 amino acids in length. The number of loops stored in LIMP increases markedly to a maximum of 20 000 up to a length of 20 residues before it decreases again.
SEARCH PROCEDURE
To start the search the stem residues flanking the N- and C-terminus of a missing (or existing) loop in a protein model and the amino acid sequence have to be provided. As in our previous version, the search procedure is based on a stepwise approach which minimizes the calculation time. Fragments with appropriate sequence length, and with geometrical fingerprints of the fragment and the gap matching with an accuracy of at least 0.75 Å RMSD distance are selected. This RMSD value is subsequently used to determine the top 1000 loop candidates. These loop candidates are then rescored by the parameters ‘sequence similarity between missing segment and template loop’ and ‘fingerprint matching of the template loop to the gap in the model.’ Only one representative of fragments with identical primary structure and high tertiary structure similarity (with backbone RMSD < 0.5 Å) is kept in the results list to maximize the conformational space of fragments used for further calculations. The top 100 loop candidates are finally displayed in the results list. Suitable candidates can be selected from that list by visual inspection.
VISUALIZATION AND USER INTERFACE
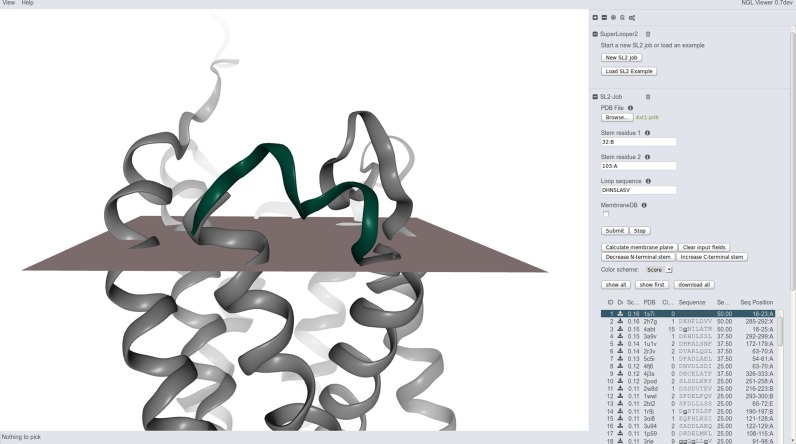
For visual inspection of results, we employed the NGL viewer which works without installation of additional plug-ins (20). As a common graphical user interface for the NGL viewer (Figure 3) the search mask and the results list were implemented within JavaScript. A protein structure uploaded via the file selection dialog is instantly loaded to the NGL viewer. The stem residues of the gap in the protein model must either be typed into the according search field or can be selected by clicking them in the NGL viewer. The sequence of the missing segment must be typed or copied into the search mask. If the membrane protein-specific LIMP data base (Membrane DB) is not checked, the LIP data base will be searched. After the submission button is pressed, the search is started. Depending on the loop length, results are expected to appear after few seconds or up to half a minute in the results list.
Figure 3.
Screenshot of the SL2 results page (NGL viewer). Structure of the human cytomegalovirus GPCR US28 (PDB-ID: 4xt1) in a gray cartoon representation with top ranked loop (green) and calculated membrane planes. The list of loop candidates filling the gap 94 to 103 in the GPCR structure is displayed as table on the right hand just below the search mask.
The top hit will automatically be loaded into the gap of the protein model depicted in the viewer window. Alternative loop conformations can be selected from the results table containing the 100 best loop candidates. For each candidate, the score ranging from 0 to 0.455, the RCSB PDB entry-code and sequence of the template protein, the number of clashes, and the sequence identity between target and template are listed. If no appropriate loop is found, the user can select ‘Decrease N-terminal stem’ or ‘Increase C-terminal stem’ to add a residue to the loop and shift the stem atoms of the gap, accordingly. As an additional visual control, for helical membrane proteins, the position of the lipid bilayer can be calculated ('Calculate membrane planes'), employing the web-service TMDET (25).
There is an option to display the complete list of loop candidates at the same time as visualizing the conformation space of the loop. Loop candidates can be colored according to score, sequence identity or clashes by selecting the corresponding color scheme from the dropdown menu. The completed structure (initial model plus selected loop) can be downloaded by clicking the download button. Alternatively, the complete list of loops can be downloaded for further analysis.
TECHNICAL ASPECTS
Visualization is carried out by the NGL viewer (20). To use the full feature set of the NGL viewer an up-to-date web browser (tested on the recent versions of Firefox, Google Chrome, Safari, IE and Edge) is recommended. The specialized graphical user interface is written in JavaScript. For job handling a simple python job server based on the Flask framework (http://flask.pocoo.org/) is used.
PERFORMANCE, LIMITATIONS AND OUTLOOK
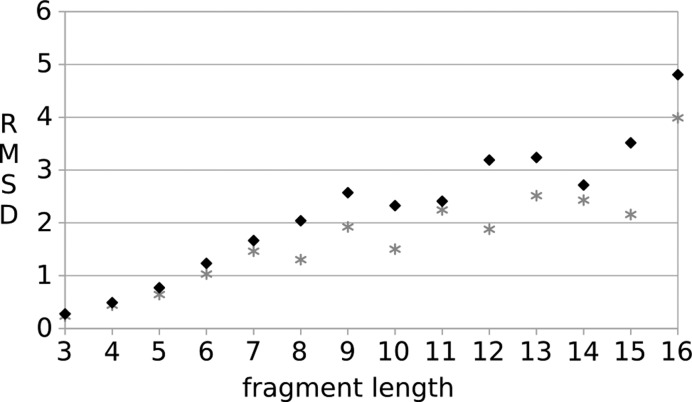
The updated version of our fragment based web-application tool for loop modeling, SL2, benefits from an enlarged fragment database and a new user interface including an updated protein viewer. As a result of the enlarged fragment database the prediction quality has been further improved. Using the same dataset (15) and validation procedure as in our previous publication (17), an average gain in prediction quality by 20% is observed for loops of 3–16 residues length (Figure 4). A drop of the backbone RMSD between experimentally determined and modeled loops (only the top hit was considered) starts to become evident for loops with eight residues length. This implies that the coverage of possible loop conformations has been further optimized starting with this length.
Figure 4.
Comparison of benchmarks of our previous (17) (black rhombus) and updated version SL2 (gray star) using a standard loop dataset (15).
Despite the gain of prediction quality, the top hit results obtained by SL2 sometimes deviate from the experimentally determined structure even for short loops. There are several possible reasons for this. First, many loops are highly flexible or are even located in structurally disordered regions of proteins (26,27). The conformations suggested by SL2 may thus indicate alternative loop conformations not observed by protein X-ray structure crystallography (e.g. Figure S6 in (28)). Second, as scoring of the loops mainly depends on the stem residues, experimentally caused distortions of these stem atoms may prevent selection of a specific conformation (29). Prediction quality drops with loop length, mainly due to the increased conformational space. A promising strategy to enhance prediction quality of longer loops would be inclusion of additional experimental constraints such as mass spectrometry (30,31) or electron density maps from single particle cryo-electron microscopy (32).
Footnotes
Present address: Alexander S. Rose, San Diego Supercomputer Center, University of California, San Diego, CA 92093-0743, USA.
FUNDING
Deutsche Forschungsgemeinschaft [Sfb740/B6, DFG HI 1502/1-2, BI 893/8]; ‘Norddeutscher Verbund für Hoch- und Höchstleistungsrechner’ (HLRN) (in part). Funding for open access charge: Sfb740 / B6.
Conflict of interest statement. None declared.
REFERENCES
- 1.Rose P.W., Bi C., Bluhm W.F., Christie C.H., Dimitropoulos D., Dutta S., Green R.K., Goodsell D.S., Prlic A., Quesada M., et al. The RCSB Protein Data Bank: new resources for research and education. Nucleic Acids Res. 2013;41:D475–D482. doi: 10.1093/nar/gks1200. [DOI] [PMC free article] [PubMed] [Google Scholar]
- 2.Brandt B.W., Heringa J., Leunissen J.A.M. SEQATOMS: a web tool for identifying missing regions in PDB in sequence context. Nucleic Acids Res. 2008;36:255–259. doi: 10.1093/nar/gkn237. [DOI] [PMC free article] [PubMed] [Google Scholar]
- 3.Rose A., Theune D., Goede A., Hildebrand P.W. MP:PD - A data base of internal packing densities, internal packing defects and internal waters of helical membrane proteins. Nucleic Acids Res. 2014;42:347–351. doi: 10.1093/nar/gkt1062. [DOI] [PMC free article] [PubMed] [Google Scholar]
- 4.Kufareva I., Katritch V., Stevens R.C., Abagyan R. Advances in GPCR modeling evaluated by the GPCR Dock 2013 assessment: meeting new challenges. Structure. 2014;22:1120–1139. doi: 10.1016/j.str.2014.06.012. [DOI] [PMC free article] [PubMed] [Google Scholar]
- 5.Fiser A., Do R.K., Sali A. Modeling of loops in protein structures. Protein Sci. 2000;9:1753–1773. doi: 10.1110/ps.9.9.1753. [DOI] [PMC free article] [PubMed] [Google Scholar]
- 6.Spassov V.Z., Flook P.K., Yan L. LOOPER: a molecular mechanics-based algorithm for protein loop prediction. Protein Eng. Des. Sel. 2008;21:91–100. doi: 10.1093/protein/gzm083. [DOI] [PubMed] [Google Scholar]
- 7.Liang S., Zhang C., Zhou Y. LEAP: Highly accurate prediction of protein loop conformations by integrating coarse-grained sampling and optimized energy scores with all-atom refinement of backbone and side chains. J. Comput. Chem. 2014;35:335–341. doi: 10.1002/jcc.23509. [DOI] [PMC free article] [PubMed] [Google Scholar]
- 8.Tang K., Zhang J., Liang J. Fast protein loop sampling and structure prediction using distance-guided sequential chain-growth Monte Carlo method. PLoS Comput. Biol. 2014;10:e1003539. doi: 10.1371/journal.pcbi.1003539. [DOI] [PMC free article] [PubMed] [Google Scholar]
- 9.Michalsky E., Goede A., Preissner R. Loops In Proteins (LIP)–a comprehensive loop database for homology modelling. Protein Eng. 2003;16:979–985. doi: 10.1093/protein/gzg119. [DOI] [PubMed] [Google Scholar]
- 10.Messih M.A., Lepore R., Tramontano A. LoopIng: a template-based tool for predicting the structure of protein loops. Bioinformatics. 2015;31:btv438. doi: 10.1093/bioinformatics/btv438. [DOI] [PMC free article] [PubMed] [Google Scholar]
- 11.Fernandez-Fuentes N., Zhai J., Fiser A. ArchPRED: A template based loop structure prediction server. Nucleic Acids Res. 2006;34:173–176. doi: 10.1093/nar/gkl113. [DOI] [PMC free article] [PubMed] [Google Scholar]
- 12.Peng H.-P., Yang A.-S. Modeling protein loops with knowledge-based prediction of sequence-structure alignment. Bioinformatics. 2007;23:2836–2842. doi: 10.1093/bioinformatics/btm456. [DOI] [PubMed] [Google Scholar]
- 13.Deane C.M., Blundell T.L. CODA: a combined algorithm for predicting the structurally variable regions of protein models. Protein Sci. 2001;10:599–612. doi: 10.1110/ps.37601. [DOI] [PMC free article] [PubMed] [Google Scholar]
- 14.van Vlijmen H.W., Karplus M. PDB-based protein loop prediction: parameters for selection and methods for optimization. J. Mol. Biol. 1997;267:975–1001. doi: 10.1006/jmbi.1996.0857. [DOI] [PubMed] [Google Scholar]
- 15.Rossi K.A., Weigelt C.A., Nayeem A., Krystek S.R. Loopholes and missing links in protein modeling. Protein Sci. 2007;16:1999–2012. doi: 10.1110/ps.072887807. [DOI] [PMC free article] [PubMed] [Google Scholar]
- 16.Choi Y., Deane C.M. FREAD revisited: Accurate loop structure prediction using a database search algorithm. Proteins. 2010;78:1431–1440. doi: 10.1002/prot.22658. [DOI] [PubMed] [Google Scholar]
- 17.Hildebrand P.W., Goede A., Bauer R.a, Gruening B., Ismer J., Michalsky E., Preissner R. SuperLooper–a prediction server for the modeling of loops in globular and membrane proteins. Nucleic Acids Res. 2009;37:W571–W574. doi: 10.1093/nar/gkp338. [DOI] [PMC free article] [PubMed] [Google Scholar]
- 18.Du P., Andrec M., Levy R.M. Have we seen all structures corresponding to short protein fragments in the Protein Data Bank? An update. Protein Eng. Des. Sel. 2003;16:407–414. doi: 10.1093/protein/gzg052. [DOI] [PubMed] [Google Scholar]
- 19.Fernandez-Fuentes N., Fiser A. Saturating representation of loop conformational fragments in structure databanks. BMC Struct. Biol. 2006;6:15. doi: 10.1186/1472-6807-6-15. [DOI] [PMC free article] [PubMed] [Google Scholar]
- 20.Rose A.S., Hildebrand P.W. NGL Viewer: a web application for molecular visualization. Nucleic Acids Res. 2015;43:W576–W579. doi: 10.1093/nar/gkv402. [DOI] [PMC free article] [PubMed] [Google Scholar]
- 21.Hildebrand P.W., Preissner R., Frömmel C. Structural features of transmembrane helices. FEBS Lett. 2004;559:145–151. doi: 10.1016/S0014-5793(04)00061-4. [DOI] [PubMed] [Google Scholar]
- 22.Goldfeld D.A., Zhu K., Beuming T., Friesner R.A. Successful prediction of the intra- and extracellular loops of four G-protein-coupled receptors. Proc. Natl. Acad. Sci. U.S.A. 2011;108:8275–8280. doi: 10.1073/pnas.1016951108. [DOI] [PMC free article] [PubMed] [Google Scholar]
- 23.Kauko A., Illergård K., Elofsson A. Coils in the membrane core are conserved and functionally important. J. Mol. Biol. 2008;380:170–180. doi: 10.1016/j.jmb.2008.04.052. [DOI] [PubMed] [Google Scholar]
- 24.Kozma D., Simon I., Tusnady G.E. PDBTM: Protein Data Bank of transmembrane proteins after 8 years. Nucleic Acids Res. 2013;41:D524–D529. doi: 10.1093/nar/gks1169. [DOI] [PMC free article] [PubMed] [Google Scholar]
- 25.Tusnády G.E., Dosztányi Z., Simon I. TMDET: web server for detecting transmembrane regions of proteins by using their 3D coordinates. Bioinformatics. 2005;21:1276–1277. doi: 10.1093/bioinformatics/bti121. [DOI] [PubMed] [Google Scholar]
- 26.Elgeti M., Rose A.S., Bartl F.J., Hildebrand P.W., Hofmann K.-P., Heck M. Precision vs flexibility in GPCR signaling. J. Am. Chem. Soc. 2013;135:12305–12312. doi: 10.1021/ja405133k. [DOI] [PubMed] [Google Scholar]
- 27.Rose A.S., Elgeti M., Zachariae U., Grubmüller H., Hofmann K.P., Scheerer P., Hildebrand P.W. Position of transmembrane helix 6 determines receptor G protein coupling specificity. J. Am. Chem. Soc. 2014;136:11244–11247. doi: 10.1021/ja5055109. [DOI] [PubMed] [Google Scholar]
- 28.Scheerer P., Heck M., Goede A., Park J.H., Choe H.-W., Ernst O.P., Hofmann K.P., Hildebrand P.W. Structural and kinetic modeling of an activating helix switch in the rhodopsin-transducin interface. Proc. Natl. Acad. Sci. U.S.A. 2009;106:10660–10665. doi: 10.1073/pnas.0900072106. [DOI] [PMC free article] [PubMed] [Google Scholar]
- 29.Lessel U., Schomburg D. Importance of anchor group positioning in protein loop prediction. Proteins Struct. Funct. Genet. 1999;37:56–64. [PubMed] [Google Scholar]
- 30.Rappsilber J. The beginning of a beautiful friendship: cross-linking/mass spectrometry and modelling of proteins and multi-protein complexes. J. Struct. Biol. 2011;173:530–540. doi: 10.1016/j.jsb.2010.10.014. [DOI] [PMC free article] [PubMed] [Google Scholar]
- 31.Schneidman-Duhovny D., Kim S., Sali A. Integrative structural modeling with small angle X-ray scattering profiles. BMC Struct. Biol. 2012;12:17. doi: 10.1186/1472-6807-12-17. [DOI] [PMC free article] [PubMed] [Google Scholar]
- 32.Wang R.Y.-R., Kudryashev M., Li X., Egelman E.H., Basler M., Cheng Y., Baker D., DiMaio F. De novo protein structure determination from near-atomic-resolution cryo-EM maps. Nat. Methods. 2015;12:335–338. doi: 10.1038/nmeth.3287. [DOI] [PMC free article] [PubMed] [Google Scholar]


