


Abstract
The next generation sequencing technologies produce unprecedented amounts of data on the genetic sequence of individual organisms. These sequences carry a substantial amount of variation that may or may be not related to a phenotype. Phenotypically important part of this variation often comes in form of protein-sequence altering (non-synonymous) single nucleotide variants (nsSNVs). Here we present StructMAn, a Web-based tool for annotation of human and non-human nsSNVs in the structural context. StructMAn analyzes the spatial location of the amino acid residue corresponding to nsSNVs in the three-dimensional (3D) protein structure relative to other proteins, nucleic acids and low molecular-weight ligands. We make use of all experimentally available 3D structures of query proteins, and also, unlike other tools in the field, of structures of proteins with detectable sequence identity to them. This allows us to provide a structural context for around 20% of all nsSNVs in a typical human sequencing sample, for up to 60% of nsSNVs in genes related to human diseases and for around 35% of nsSNVs in a typical bacterial sample. Each nsSNV can be visualized and inspected by the user in the corresponding 3D structure of a protein or protein complex. The StructMAn server is available at http://structman.mpi-inf.mpg.de.
INTRODUCTION
The ever growing amount of genetic data generated with the modern sequencing technologies presents a challenge to the researchers who want to interpret them. Genetic sequence of an individual organism can substantially differ from a reference sequence for the species, and these differences may or may not manifest themselves in the phenotype. For example, an individual may carry up to 3 · 106 SNVs and 3 · 105 insertions and deletions (1), with most mutations in a disease-affected individual being not related to the disease, except for a few that are causal. Distinguishing between benign and pathogenic alleles even in the case of a Mendelian phenotype is thus a major bottleneck in clinical genetic diagnostics. The majority of sequence variants causing Mendelian traits are coding (2–4), and, unlike synonymous and stop-gain variants, non-synonymous single nucleotide variants (nsSNVs) are difficult to interpret (5). Structural context of a mutation can suggest the interpretation of its predicted or observed functional effect. Additionally, analysis of functional effect of mutation may provide insight into potential drug resistance, and thus allow for a more rapid and precise therapy choice.
In humans, ∼1.3% of all SNVs localize in translated protein regions, with 58.8% of them leading to a change of corresponding amino acid in the protein sequence (6). Several databases exist that collect data on human genetic variation, both related to a pathological state (OMIM (2), the Cancer Genome Atlas (6), COSMIC (7), ClinVar (3), HGMD (4)) and of healthy individuals (dbSNP (8) and Exome Variation Server). For example, ClinVar (3) contains 125 017 SNVs associated with a clinical phenotype in 26 372 genes. For most of these SNVs, the mechanism, by which they are related to the phenotypes, is unknown. Several computational methods and software tools aim to predict the functional impact of SNVs. Some methods take into account protein sequence-based phylogenetic information (9–11), other also rely on combination of protein structural information, functional parameters and phylogenetic information derived from multiple sequence alignments (12–17). Meta-methods combining weighted outputs from several prediction tools in a statistical learning predictor have been also developed (18).
There is a number of tools that map SNVs to the three-dimensional (3D) structures of the corresponding proteins, and some of them can also provide clinically-relevant information (13,19–25), and some databases, such as dbNSFP (26), store the functional annotation of potential nsSNVs derived from several prediction algorithms. None of these tools, except SNP2Structure and PolyPhen-2 (13,27), consider other molecules interacting with the target proteins, which may provide additional functional clues. PolyPhen-2 (13) analyzes 3D structures of homologs and reports multiple structural features derived from them, but does not use the information about their complexes for prediction.
Protein interactions are conserved over large evolutionary distances (28), and hence information on interaction interfaces observed in some species can be relevant in other species. dSysMap (29) collected all potential protein–protein interactions, identified by homology to interacting proteins in other species and the associated disease mutations in human. Mechismo (30) provides a web-based interface for structural characterization of single amino-acid substitutions in any species. These resources advance our understanding of the structural mechanisms of disease, but they are typically restricted to a certain set of species or interaction types.
In this study, we present StructMAn, a web server that provides as much structural information for a given SNV as possible. Our tool searches for all 3D structures of the corresponding protein and other proteins with significant sequence homology to it and analyzes the location of the mutated amino acid with respect to its structural environment, such as other components of the protein complex, bound nucleic acids and low molecular-weight ligands. Additionally, the tool can perform GO enrichment as well as pathway enrichment analysis of a given gene set. To study drug resistance in connection with SNVs, we have included the possibility to search for structures that include a compound with a certain degree of similarity to a particular drug.
Input data
The input data for StructMAn comprises a list of genes or proteins and SNVs in them. This list can be submitted in the form of a standard VCF file, or in a simplified custom format that we call SMLF (simple mutation list format), see Figure 1. The gene or protein identifier in the SMLF format is the Uniprot identifier. The mutations are encoded in the form <amino acid in the wildtype><position><amino acid in the mutant>.
Figure 1.
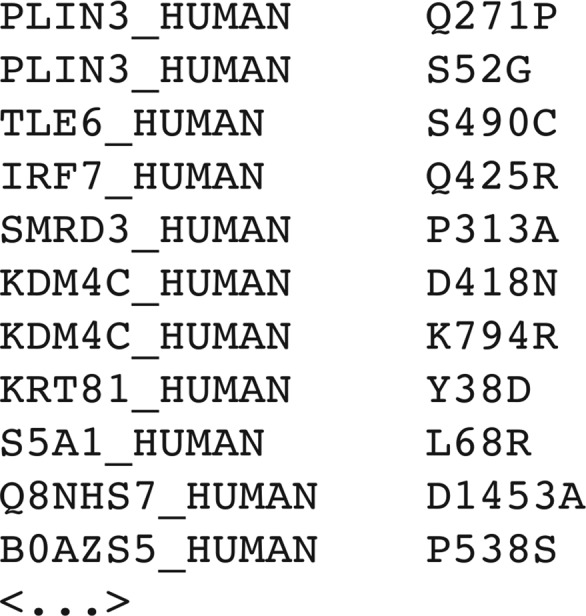
Example input of StructMAn.
Structural templates
An automated pipeline selects 3D structures in order to perform analysis. For each protein, the pipeline extracts the corresponding amino acid sequence from UniProt (31) and performs a BLAST (32) search against all proteins with resolved 3D structures from the Protein Data Bank (PDB) (33) (e-value < 10−10, the alignment is longer than 50 positions or spans over more than 50% of the target protein sequence, sequence identity >35%). The resulting list of PDB entries, which function now as template candidates, are filtered and sorted based on the following four attributes: (i) the sequence identity, (ii) the relative alignment length, (iii) resolution and (iv) the R-value. For each template, a global pairwise sequence alignment with the target sequence is performed to map the position of the SNV onto the template sequence. If it is mapped to a gap, the template is discarded. All the data are stored in a relational MySQL database for two weeks, so subsequent queries with the same set of proteins will be executed significantly faster.
In order to collect as much information as possible, the structural analysis is now performed for each template, even if the 3D structure of the target protein is available. We compute (i) the shortest distance of the mutated residue to a ligand molecule in any template structure, and (ii) the shortest distance to any other macromolecule chain in any template. A typical analysis of a dataset consisting of 100 mutations in 100 proteins will take <15 min.
Interaction score
A score assessing the relative importance of mutations for protein structure and interactions was developed. For that we assumed, that the functional influence of a mutation is larger if the corresponding residue interacts with a ligand or another macromolecule. First, we compute the structure quality score that describes how well the template represents the query protein (structure quality score):
 |
(1) |
where  1 = sequence identity weight factor,
  2 = coverage weight factor,
  3 = resolution weight factor,
  4 = r-value weight factor,
  1 = (1 + exp 10(0.4 − ID))−1 (ID is the sequence identity between template and target),
  2 = coverage,
  3 = (1 + exp 1.5 · Resolution − 4)−1,
  4 = 1 − R-value.
Then we compute a score that accounts for the interactions with other components in the complex (annotation candidate score):
 |
(2) |
where  1 = ligand distance weight factor,
  2 = chain distance weight factor,
  1 = (1 + exp SLD − 10)−1,
  2 = (1 + exp SCD − 10)−1, where SLD is the shortest distance between the substituted residue and an arbitrary ligand molecule, SCD is the shortest distance between the substituted residue and any other macromolecule.
We assume that the physical contact occurs if the distance to the interacting molecule is below 5 Å, so the function was designed in such a way, that values <5 Å are mapped to a score close to 1, values >5 Å are mapped to scores below 1 and values >10 Å get scores close to 0 (Supplementary Figure S1), using a typical logistic function of the distances with an intercept of 10 and a regression coefficient of 1 (see  1 and
1 and  2 in (2)). This results in two scores in the segment [0,1], one for the shortest residue-ligand distance and one for the shortest residue-macromolecule distance. The two scores are combined and normalized with the help of the weight vector. The weights
  1 and
1 and  2 can be tuned to give the user an opportunity to favor a specific kind of interaction in the ranking.
The interaction score is the product of the structure quality score and the annotation candidate score:
 |
(3) |
The interaction score displays the potential impact of the substitution corresponding to the SNV on the protein interactions. The structures are sorted eventually using the protein score:
 |
(4) |
where PS is the protein pcore, s ∈ Sg, if template structure s is homologous to protein p, m ∈ Ms, if mutation m can be mapped to structure s.
The design of the candidate scores provides that genes containing a small number of high scoring mutations have a higher combined score than genes containing hundreds of low scoring mutations.
GO term- and pathway-enrichment analysis
StructMAn is capable of grouping the proteins that contain mutations from the input set according to recurring GO terms or pathways that are associated with them. The output in this case is sorted in such a way that the proteins corresponding to the most frequent GO terms in the dataset are reported first. The GO term specific groups are then scored by the sum of their protein scores, normalized by total number of proteins of the input set. This analysis reflects the over-representation of critical mutations in proteins with a certain biological function, process or localization. The pathway enrichment analysis is done similarly using the pathways from the Reactome Database (34).
To eliminate bias in the input dataset, one might prefer to perform a differential GO term analysis of a given input set versus a reference dataset. In this case, two sets of mutations have to be uploaded. The server performs the simple GO term analysis on both sets and then compares the results to each other. The protein scores for each protein annotated with a particular GO term are summed to produce a GO term score. The output is sorted by the difference of the scores for the GO terms that appear in both sets. This allows studying the relative over- or under-representation of certain GO terms corresponding to the mutations.
Ligand-centered analysis
StructMAn presents a possibility to focus on mutations that lie in the vicinity of particular ligands of interest or a chemically similar ligand. The user can upload a ligand structure in any format recognized by the OpenBabel (35) toolkit. These include the common SMILES, SDF and MOL2 formats, as well as the PDB format. The ligand file has to have a specific extension as specified by OpenBabel. Then an additional set of annotations is created by selecting only 3D structures that contain one of the specified ligands or a ligand that lies within a certain distance from the mutated amino acid residue and is similar to one of them with a Tanimoto score larger than a threshold. The distance and the Tanimoto score thresholds can also be adjusted by the user.
Visualization of the results
The results of the analysis are presented in the form of a table sorted by the interaction score. The table contains the following fields: ‘Protein’ (displays the Uniprot-ID of the protein containing the SNV), ‘Structure’ (PDB-ID of the 3D structure used for the structural annotation), ‘Mutations’ (all amino acid variants for the position provided in the input dataset), ‘Score’ (interaction score), ‘3D-Viewer’. The latter field is a button that opens a new tab in your browser with a visualization of the 3D structure of the corresponding template. The residue corresponding to the SNV and the nearest ligand molecule is shown in a balls-and-sticks model, while the rest of the protein chains are displayed as cartoons. The chain corresponding to the target protein is in green, while the chain with shortest distance to the substituted residue is colored yellow, all other chains are in different colors. The distances to all interaction partners are shown in angstrom. We use the JSmol plugin for the visualization, since it is a JavaScript application that does not require Java installation and runs in all browsers supporting HTML5.
Benchmarking
We have benchmarked StructMAn using a set of non-synonymous disease-causing mutations with experimentally-verified effect on protein–protein interactions (36). In this work, these mutations were classified as quasi-WT (wild-type, no apparent change of interactions), quasi-null (complete loss of interactions) or edgetic (specific loss of some interactions). We have calculated interaction scores (IS) and annotation candidate scores (ACS) for these mutations with weights tuned to favor protein-protein contacts (for ACS,  1 = 0 and
  2 = 1). ACS for quasi-null mutations are significantly lower than for both quasi-WT and edgetic mutations (in one-sided Wilcoxon test, P = 0.0098 and P = 0.0227, respectively, Supplementary Figure S2A). This indicates that the mutations of the quasi-null class are outside the interaction interfaces and probably buried inside the protein, in line with the lower conformational stability of such mutants confirmed by the LUMIER assay (36). IS show the same trend (Supplementary Figure S2B), although the statistical significance is lower (in one-sided Wilcoxon test, P = 0.0332 and P = 0.2176 between the distribution of IS for quasi-null mutations and the distributions for quasi-WT and edgetic mutations, respectively).
The distributions of both scores for quasi-WT and edgetic categories are not significantly different in the Wilcoxon test with the significance threshold of 0.05, although the median distance to the nearest chain for edgetic mutations is slightly lower (3.63 Å versus 5.34 Å for quasi-WT). This indicates that disease-causing mutations that do not render the affected protein completely incapable to participate in interactions (i.e. edgetic and quasi-WT classes) are located relatively close to protein–protein interaction interfaces, even in cases when they do not cause a phenotype in Y2H screens performed in (36).
We have also compared interaction scores to PolyPhen-2 (13) calculated for the same set of mutations. In this case, we have used the default parameters for ACS ( 1 = 1 and
  2 = 1). The correlation between them is low, but significantly positive (0.16, P = 0.0191, 95% confidence interval (0.03, 0.29)). The interaction scores for PolyPhen-2 ‘probably damaging’ and ‘possibly damaging’ classes pooled together are significantly higher than for ‘benign’ class (P = 0.0087 in Wilcoxon one-sided test, Supplementary Figure S3).
Finally, we investigated the relationship between the interaction scores and protein–protein interaction hotspots (37), defined as residues whose mutation greatly contributes to decrease of the binding energy between two interacting proteins. For all mutations from (36), we have predicted the energetic change cause by the disease-associated mutations compared to the WT using FoldX (38). We observe significant correlation between the estimated change of the binding energy in both IS and ACS: Pearson's correlation 0.39 and 0.35, 95% CI (0.13, 0.60) and (0.08, 0.58), P = 0.0049 and 0.1162, respectively. This demonstrated that the interaction score is a good predictor for the energetic impact of a nsSNV on the interaction of two proteins.
Example: protein kinase inhibitor-resistant EGFR kinase
The T790M substitution in EGFR (39) is associated with resistance toward gefitinib and other protein kinase inhibitors (Figure 2A) in non-small cell lung carcinoma. The mutated kinase, however, is sensitive to JAK3 inhibitor VI (Figure 2B) (40). We have queried StructMAn with the EGFR T790M mutation and the JAK3 inhibitor VI to search for similar ligands bound in the proximity to the mutated residue. We have identified a 3D structure of the cytoplasmic kinase domain of Ephrin type-B receptor 4 (EphB4) bound to an inhibitor (PDB ID: 4AW5, Figure 2C) (41). The Tanimoto score between this inhibitor and the JAK3 inhibitor VI is 0.56, so the two molecules share a common substructure (Figure 2B and C). As well as the WT EGFR, EphB4 has a threonine in the position 692, which is structurally analogous to position 790 of EGFR. The distance between Thr692 and the bound inhibitor is 3.16 Å (Figure 3). This is a credible explanation of the fact that mutation at this position impacts binding. However, WT EGFR is resistant toward the JAK3 inhibitor VI, while EphB4 can be inhibited by a related compound. This might be due to the fact that the EphB4 inhibitor has an additional substructure coordinated by the loop formed by residues 693–699, which is very evolutionary not conserved in EGFR. The relatively small threonine in the WT EGFR might not provide enough contacts for this substructure, while a larger methionine residue in EphB4 may make additional interactions. This is an example of how StrucMAn can help generate a hypothesis that may require a more detailed experimental and computational investigation.
Figure 2.

Protein kinase inhibitors considered in this study. The common substructure in the JAK3 inhibitor VI and EphB4 inhibitor is marked in red.
Figure 3.

The screenshot from StructMAn displaying the complex of EphB4 with its inhibitor (PDB ID: 4AW5). The residue corresponding to the T790M mutation in EGRF and the inhibitor are shown in the all-atom stick model. The shortest distance is marked in yellow.
Supplementary Material
Acknowledgments
We are grateful to Georg Friedrich for technical support, Nadezhda T. Doncheva, Tomas Bastys, Olga Voitenko, Thorsten Will and Lara Schneider for testing the web server and to Thomas Lengauer for fruitful discussion.
SUPPLEMENTARY DATA
Supplementary Data are available at NAR Online.
FUNDING
Funding for open access charge: MPI Core Funding.
Conflict of interest statement. None declared.
REFERENCES
- 1.1000 Genomes Project Consortium. Abecasis G.R., Altshuler D., Auton A., Brooks L.D., Durbin R.M., Gibbs R.A., Hurles M.E., McVean G.A. A map of human genome variation from population-scale sequencing. Nature. 2010;467:1061–1073. doi: 10.1038/nature09534. [DOI] [PMC free article] [PubMed] [Google Scholar]
- 2.Amberger J.S., Bocchini C.A., Schiettecatte F., Scott A.F., Hamosh A. OMIM.org: Online Mendelian Inheritance in Man (OMIM®), an online catalog of human genes and genetic disorders. Nucleic Acids Res. 2015;43:D789–D798. doi: 10.1093/nar/gku1205. [DOI] [PMC free article] [PubMed] [Google Scholar]
- 3.Landrum M.J., Lee J.M., Benson M., Brown G., Chao C., Chitipiralla S., Gu B., Hart J., Hoffman D., Hoover J., et al. ClinVar: public archive of interpretations of clinically relevant variants. Nucleic Acids Res. 2016;44:D862–D868. doi: 10.1093/nar/gkv1222. [DOI] [PMC free article] [PubMed] [Google Scholar]
- 4.Stenson P.D., Ball E.V., Mort M., Phillips A.D., Shiel J.A., Thomas N.S.T., Abeysinghe S., Krawczak M., Cooper D.N. Human gene mutation database (HGMD): 2003 update. Hum. Mutat. 2003;21:577–581. doi: 10.1002/humu.10212. [DOI] [PubMed] [Google Scholar]
- 5.Sunyaev S.R. Inferring causality and functional significance of human coding dna variants. Hum. Mol. Genet. 2012;21:R10–R17. doi: 10.1093/hmg/dds385. [DOI] [PMC free article] [PubMed] [Google Scholar]
- 6.1000 Genomes Project Consortium. Abecasis G.R., Auton A., Brooks L.D., DePristo M.A., Durbin R.M., Handsaker R.E., Kang H.M., Marth G.T., McVean G.A. An integrated map of genetic variation from 1,092 human genomes. Nature. 2012;491:56–65. doi: 10.1038/nature11632. [DOI] [PMC free article] [PubMed] [Google Scholar]
- 7.Forbes S.A., Beare D., Gunasekaran P., Leung K., Bindal N., Boutselakis H., Ding M., Bamford S., Cole C., Ward S., et al. COSMIC: exploring the world's knowledge of somatic mutations in human cancer. Nucleic Acids Res. 2015;43:D805–D8011. doi: 10.1093/nar/gku1075. [DOI] [PMC free article] [PubMed] [Google Scholar]
- 8.Sherry S.T., Ward M.H., Kholodov M., Baker J., Phan L., Smigielski E.M., Sirotkin K. dbSNP: the NCBI database of genetic variation. Nucleic Acids Res. 2001;29:308–311. doi: 10.1093/nar/29.1.308. [DOI] [PMC free article] [PubMed] [Google Scholar]
- 9.Ng P.C., Henikoff S. SIFT: Predicting amino acid changes that affect protein function. Nucleic Acids Res. 2003;31:3812–3814. doi: 10.1093/nar/gkg509. [DOI] [PMC free article] [PubMed] [Google Scholar]
- 10.Thomas P.D., Campbell M.J., Kejariwal A., Mi H., Karlak B., Daverman R., Diemer K., Muruganujan A., Narechania A. PANTHER: a library of protein families and subfamilies indexed by function. Genome Res. 2003;13:2129–2141. doi: 10.1101/gr.772403. [DOI] [PMC free article] [PubMed] [Google Scholar]
- 11.Katsonis P., Lichtarge O. A formal perturbation equation between genotype and phenotype determines the evolutionary action of protein-coding variations on fitness. Genome Res. 2014;24:2050–2058. doi: 10.1101/gr.176214.114. [DOI] [PMC free article] [PubMed] [Google Scholar]
- 12.Sunyaev S., Ramensky V., Bork P. Towards a structural basis of human non-synonymous single nucleotide polymorphisms. Trends Genet. 2000;16:198–200. doi: 10.1016/s0168-9525(00)01988-0. [DOI] [PubMed] [Google Scholar]
- 13.Adzhubei I.A., Schmidt S., Peshkin L., Ramensky V.E., Gerasimova A., Bork P., Kondrashov A.S., Sunyaev S.R. A method and server for predicting damaging missense mutations. Nat. Methods. 2010;7:248–249. doi: 10.1038/nmeth0410-248. [DOI] [PMC free article] [PubMed] [Google Scholar]
- 14.Bromberg Y., Rost B. SNAP: predict effect of non-synonymous polymorphisms on function. Nucleic Acids Res. 2007;35:3823–3835. doi: 10.1093/nar/gkm238. [DOI] [PMC free article] [PubMed] [Google Scholar]
- 15.Yue P., Melamud E., Moult J. Snps3d: candidate gene and snp selection for association studies. BMC Bioinformatics. 2006;7:166. doi: 10.1186/1471-2105-7-166. [DOI] [PMC free article] [PubMed] [Google Scholar]
- 16.Capriotti E., Calabrese R., Fariselli P., Martelli P.L., Altman R.B., Casadio R. Ws-snps&go: a web server for predicting the deleterious effect of human protein variants using functional annotation. BMC Genomics. 2013;14(Suppl. 3):S6. doi: 10.1186/1471-2164-14-S3-S6. [DOI] [PMC free article] [PubMed] [Google Scholar]
- 17.Shi Z., Moult J. Structural and functional impact of cancer-related missense somatic mutations. J. Mol. Biol. 2011;413:495–512. doi: 10.1016/j.jmb.2011.06.046. [DOI] [PMC free article] [PubMed] [Google Scholar]
- 18.Capriotti E., Altman R.B., Bromberg Y. Collective judgment predicts disease-associated single nucleotide variants. BMC Genomics. 2013;14(Suppl. 3):S2. doi: 10.1186/1471-2164-14-S3-S2. [DOI] [PMC free article] [PubMed] [Google Scholar]
- 19.Ryan M., Diekhans M., Lien S., Liu Y., Karchin R. LS-SNP/PDB: annotated non-synonymous SNPs mapped to protein data bank structures. Bioinformatics. 2009;25:1431–1432. doi: 10.1093/bioinformatics/btp242. [DOI] [PMC free article] [PubMed] [Google Scholar]
- 20.Singh A., Olowoyeye A., Baenziger P.H., Dantzer J., Kann M.G., Radivojac P., Heiland R., Mooney S.D. MutDB: update on development of tools for the biochemical analysis of genetic variation. Nucleic Acids Res. 2008;36:D815–D819. doi: 10.1093/nar/gkm659. [DOI] [PMC free article] [PubMed] [Google Scholar]
- 21.Hurst J.M., McMillan L.E.M., Porter C.T., Allen J., Fakorede A., Martin A.C.R. The SAAPdb web resource: a large-scale structural analysis of mutant proteins. Hum. Mutat. 2009;30:616–624. doi: 10.1002/humu.20898. [DOI] [PubMed] [Google Scholar]
- 22.Uzun A., Leslin C.M., Abyzov A., Ilyin V. Structure SNP (StSNP): a web server for mapping and modeling nsSNPs on protein structures with linkage to metabolic pathways. Nucleic Acids Res. 2007;35:W384–W392. doi: 10.1093/nar/gkm232. [DOI] [PMC free article] [PubMed] [Google Scholar]
- 23.Stitziel N.O., Binkowski T.A., Tseng Y.Y., Kasif S., Liang J. topoSNP: a topographic database of non-synonymous single nucleotide polymorphisms with and without known disease association. Nucleic Acids Res. 2004;32:D520–D522. doi: 10.1093/nar/gkh104. [DOI] [PMC free article] [PubMed] [Google Scholar]
- 24.Niknafs N., Kim D., Kim R., Diekhans M., Ryan M., Stenson P.D., Cooper D.N., Karchin R. MuPIT interactive: webserver for mapping variant positions to annotated, interactive 3d structures. Hum. Genet. 2013;132:1235–1243. doi: 10.1007/s00439-013-1325-0. [DOI] [PMC free article] [PubMed] [Google Scholar]
- 25.Mueller S.C., Backes C., Kalinina O.V., Meder B., Stöckel D., Lenhof H.-P., Meese E., Keller A. BALL-SNP: combining genetic and structural information to identify candidate non-synonymous single nucleotide polymorphisms. Genome Med. 2015;7:65. doi: 10.1186/s13073-015-0190-y. [DOI] [PMC free article] [PubMed] [Google Scholar]
- 26.Liu X., Wu C., Li C., Boerwinkle E. dbNSFP v3.0: A one-stop database of functional predictions and annotations for human non-synonymous and splice site SNVs. Hum. Mutat. 2016;37:235–241. doi: 10.1002/humu.22932. [DOI] [PMC free article] [PubMed] [Google Scholar]
- 27.Wang D., Song L., Singh V., Rao S., An L., Madhavan S. SNP2Structure: a public and versatile resource for mapping and three-dimensional modeling of missense SNPs on human protein structures. Comput. Struct. Biotechnol. J. 2015;13:514–519. doi: 10.1016/j.csbj.2015.09.002. [DOI] [PMC free article] [PubMed] [Google Scholar]
- 28.Aloy P., Cuelemans H., Stark A., Russell R.B. The relationship between sequence and interaction divergence in proteins. J. Mol. Biol. 2003;332:989–998. doi: 10.1016/j.jmb.2003.07.006. [DOI] [PubMed] [Google Scholar]
- 29.Mosca R., Tenorio-Laranga J., Olivella R., Alcalde V., Céol A., Soler-López M., Aloy P. dSysMap: exploring the edgetic role of disease mutations. Nat. Methods. 2015;12:167–168. doi: 10.1038/nmeth.3289. [DOI] [PubMed] [Google Scholar]
- 30.Betts M.J., Lu Q., Jiang Y., Drusko A., Wichmann O., Utz M., Valtierra-Gutiérrez I. A., Schlesner M., Jaeger N., Jones D.T., et al. Mechismo: predicting the mechanistic impact of mutations and modifications on molecular interactions. Nucleic Acids Res. 2015;43:e10. doi: 10.1093/nar/gku1094. [DOI] [PMC free article] [PubMed] [Google Scholar]
- 31.UniProt Consortium. UniProt: a hub for protein information. Nucleic Acids Res. 2015;43:D204–D212. doi: 10.1093/nar/gku989. [DOI] [PMC free article] [PubMed] [Google Scholar]
- 32.Altschul S.F., Gish W., Miller W., Myers E.W., Lipman D.J. Basic local alignment search tool. J. Mol. Biol. 1990;215:403–410. doi: 10.1016/S0022-2836(05)80360-2. [DOI] [PubMed] [Google Scholar]
- 33.Berman H.M., Westbrook J., Feng Z., Gilliland G., Bhat T.N., Weissig H., Shindyalov I.N., Bourne P.E. The protein data bank. Nucleic Acids Res. 2000;28:235–242. doi: 10.1093/nar/28.1.235. [DOI] [PMC free article] [PubMed] [Google Scholar]
- 34.Croft D., Mundo A.F., Haw R., Milacic M., Weiser J., Wu G., Caudy M., Garapati P., Gillespie M., Kamdar M.R., et al. The reactome pathway knowledgebase. Nucleic Acids Res. 2014;42:D472–D477. doi: 10.1093/nar/gkt1102. [DOI] [PMC free article] [PubMed] [Google Scholar]
- 35.O'Boyle N.M., Banck M., James C.A., Morley C., Vandermeersch T., Hutchison G.R. Open Babel: An open chemical toolbox. J. Cheminform. 2011;3:33. doi: 10.1186/1758-2946-3-33. [DOI] [PMC free article] [PubMed] [Google Scholar]
- 36.Sahni N., Yi S., Taipale M., Fuxman Bass J.I., Coulombe-Huntington J., Yang F., Peng J., Weile J., Karras G.I., Wang Y., et al. Widespread macromolecular interaction perturbations in human genetic disorders. Cell. 2015;161:647–660. doi: 10.1016/j.cell.2015.04.013. [DOI] [PMC free article] [PubMed] [Google Scholar]
- 37.Morrow L.K., Zhang S. Computational prediction of protein hot spot residues. Curr. Pharm. Des. 2012;18:1255–1265. doi: 10.2174/138161212799436412. [DOI] [PMC free article] [PubMed] [Google Scholar]
- 38.Schymkowitz J., Borg J., Stricher F., Nys R., Rousseau F., Serrano L. The FoldX web server: an online force field. Nucleic Acids Res. 2005;33:W382–W388. doi: 10.1093/nar/gki387. [DOI] [PMC free article] [PubMed] [Google Scholar]
- 39.Yun C.-H., Boggon T.J., Li Y., Woo M.S., Greulich H., Meyerson M., Eck M.J. Structures of lung cancer-derived egfr mutants and inhibitor complexes: mechanism of activation and insights into differential inhibitor sensitivity. Cancer Cell. 2007;11:217–227. doi: 10.1016/j.ccr.2006.12.017. [DOI] [PMC free article] [PubMed] [Google Scholar]
- 40.Nishiya N., Sakamoto Y., Oku Y., Nonaka T., Uehara Y. Jak3 inhibitor VI is a mutant specific inhibitor for epidermal growth factor receptor with the gatekeeper mutation T790M. World J. Biol. Chem. 2015;6:409–418. doi: 10.4331/wjbc.v6.i4.409. [DOI] [PMC free article] [PubMed] [Google Scholar]
- 41.Kim M.H., Tsuhako A.L., Co E.W., Aftab D.T., Bentzien F., Chen J., Cheng W., Engst S., Goon L., Klein R.R., et al. The design, synthesis, and biological evaluation of potent receptor tyrosine kinase inhibitors. Bioorg. Med. Chem. Lett. 2012;22:4979–4985. doi: 10.1016/j.bmcl.2012.06.029. [DOI] [PubMed] [Google Scholar]
Associated Data
This section collects any data citations, data availability statements, or supplementary materials included in this article.