

Abstract
Purpose
To obtain cerebral perfusion territories of the left, the right and the posterior circulation in humans with high SNR and robust delineation.
Materials and Methods
CASL was implemented using a dedicated RF coil, positioned over the neck, to label the major cerebral feeding arteries in humans. Selective labeling was achieved by flow-driven adiabatic fast passage and by tilting the longitudinal labeling gradient about the Y-axis by θ=±60°.
Results
Mean CBF values in gray and white matter were 74±13 ml·100g−1·min−1 and 14±13 ml·100g−1·min−1, respectively (N=14). There were no signal differences between left and right hemispheres when θ=0° (P>0.19), indicating efficient labeling of both hemispheres. When θ=+60°, the signal in GM on the left hemisphere, 0.07±0.06%, was 92% lower than on the right hemisphere, 0.85±0.30% (P<10−9), while for θ=−60°, the signal in the right hemisphere, 0.16±0.13%, was 82% lower than on the contralateral side, 0.89±0.22% (P<10−10). Similar attenuations were obtained in white matter.
Conclusions
Clear delineation of the left and right cerebral perfusion territories was obtained, allowing discrimination of the anterior and posterior circulation in each hemisphere.
Keywords: brain, cerebral blood flow, cerebrovascular diseases, magnetic resonance imaging, vascular territory
Introduction
Quantitative maps of cerebral blood flow (CBF) can be obtained with MRI according to a number of different approaches1–5. The major clinical applications of perfusion MRI are in cerebrovascular diseases, where, along with other MRI techniques such as MR angiography (MRA), diffusion-weighted imaging (DWI) and T2-weighted MRI, measurements of perfusion provide a comprehensive evaluation of the cerebral circulation under pathological conditions6. Perfusion imaging has enabled, for example, a direct comparison of regions of altered perfusion with the ischemic territory and the vascular source of compromise6, and it has been widely used for the early evaluation of stroke patients7, allowing the assessment of infarcted versus salvageable tissue and guiding the treatment strategy8.
Amongst the different perfusion MRI techniques, arterial spin labeling (ASL) has the advantage of being truly non-invasive because it uses arterial water as an endogenous perfusion tracer, and thus repeated measurements of CBF can be performed indefinitely. Shortly after the inception of ASL as a robust tool to obtain maps of whole brain perfusion came the interest to use ASL to selectively label blood flowing through specific cerebral feeding arteries1, and several ASL-based methods have been recently proposed to measure cerebral perfusion territories in humans9–24. Perfusion territories of major cerebral arteries can be used to identify flow anomalies and help predict regions at increased risk of ischemic damage21. They can be of significant prognostic value in assessing the collateral circulation for the purposes of surgical planning for patients requiring vascular interventions, such as bypass of the feeding cerebral arteries15. In cerebrovascular diseases, perfusion territory mapping can verify the extent of the ischemic region and indicate areas of flow redistribution due to compensatory collateral flow, re-canalization of previously occluded arteries, or bypass surgery to correct the occlusion21,23.
The mapping of vascular territories with ASL is based on labeling only blood flowing through the artery or arteries of interest, while leaving the other ones unlabeled. To date, this strategy has been implemented according three different approaches, as recently reviewed25: (1) using a dedicated labeling RF coil positioned over the arteries of interest1,9–11; (2) employing selective inversion of spatially confined areas where the arteries of interest are located12–23; and (3) using multi-dimensional RF pulses to directly label the artery of interest24. Previously, the use of a separate labeling RF coil in combination with an oblique labeling gradient was shown to allow separation of the left and the right cerebral perfusion territories in the rodent brain1. In the present study, we formalize that concept and extend its application to humans. We show that continuous ASL (CASL), when performed with a separate labeling RF coil, allows whole-brain quantitative perfusion imaging and the separation of the left, the right and the posterior perfusion territories in a single experimental session with high signal-to-noise ratio (SNR) and without interference caused by magnetization transfer (MT) effects.
Materials and Methods
Labeling Scheme
CASL experiments were carried out in healthy human subjects, using a dedicated dual rectangular loop labeling RF coil26, positioned at a distance Δz0 from the magnet’s isocenter, over the neck region, to label the principal feeding arteries to the brain, namely the common carotid arteries (CCA) and the vertebral arteries (VA). Selective labeling of the left, the right, or both circulations was achieved by flow-driven adiabatic fast passage27. Figure 1a illustrates the concept used to obtain selective labeling of individual arteries. The labeling plane was defined by rotating the labeling gradient, Geff, in the horizontal plane by an angle θ with respect to the longitudinal axis. Because of the confined excitation profile of the labeling coil, only the arteries passing over the intersection of the labeling plane with the labeling coil transversal plane undergo the ASL inversion. When no transverse gradient is used, θ = 0° and a regular CASL experiment is carried out, with both left and right CCAs and VAs undergoing ASL. To guarantee the validity of the conditions for efficient flow-driven adiabatic inversion, the labeling gradient in the z-direction was optimized to provide the best labeling efficiency26–28 and kept constant in all experiments. Thus, the angle θ was defined by the proper addition of a gradient in the x-direction. When θ is large enough, only the right (θ > 0°) or the left (θ < 0°) arteries are contained in the intersection of the labeling plane with the labeling coil, while the arteries located on the opposed side are intersected by the labeling plane far away from, and thus out of reach of the labeling coil (Fig. 1a). It is possible to determine the minimum angle necessary to selectively label the desired artery, taking into consideration the effective longitudinal excitation profile of the labeling coil, EPZ, and the distance δ = δL + δR between the arteries on opposite sides (see Fig. 1b):
| [1] |
Figure 1.
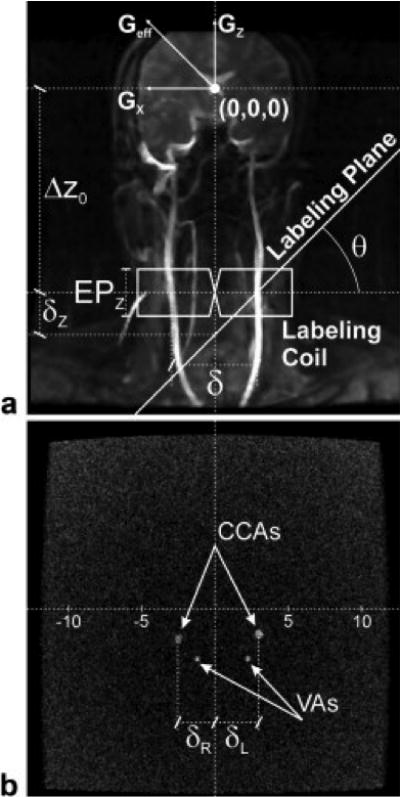
a) MRA of the neck of a typical subject illustrating the labeling scheme used to selective label blood flowing just to the cerebral hemisphere of interest. The use of a tilted labeling plane makes the RF frequency offset be on resonance at the desired side, but outside the effective excitation profile of the labeling coil on the opposed side. b) Cross-sectional image of the neck showing the CCAs and VAs. The distances δL and δR are used in the planning of the selective labeling scheme according to Eqs. [1]–[3] (see text).
To optimize selectivity, the labeling plane is offset in the longitudinal direction by δz, which is calculated from δR or δL according to:
| [2] |
The labeling frequency offset used for ASL is then defined as:
| [3] |
MRI Methods
Healthy adult volunteers (N=16, 8 males and 8 females, mean age 31 ± 8 years) were scanned under an NIH approved IRB protocol in a 3T GE Signa system equipped with gradients capable of 40mT/m amplitude and 150T/ms slew rate. A standard transmitter body coil and an 8-channel receive-only head coil were used for image acquisition. The labeling RF coil26 was placed over the neck of the subject, inferior to the 8-channel receive-only head coil, to continuously invert the blood water spins flowing through the CCA and VA on both sides of the neck. To avoid coil-to-coil interactions, all coils were equipped with active decoupling circuitry. Once in place, the labeling coil was left at a fixed position for the remainder of the experiments. The position of the labeling RF coil with respect to the magnet isocenter, Δz0, was obtained by using the laser-based bed-positioning system of the scanner to define the center of the imaging region slightly above the eye-brows of each subject, and then by measuring the net longitudinal displacement caused by moving the patient bed inside the magnet until the laser beam was positioned over the physical center of the labeling RF coil.
Following the acquisition of localizer images, angiograms of the neck region were acquired using a time-of-flight imaging sequence with TE=3.6ms and TR=15ms. Flow enhancement was achieved by using a large flip angle (90°) for excitation. Axial slices placed through the center of the labeling coil were used to determine the distance of left (δL) and right (δR) carotids from the x=0 plane (Fig. 1b). These procedures allowed for determination of δz, based on which the frequency offset used for labeling was determined according to Eq. [3].
Axial CASL perfusion-weighted images were then acquired using a 2D multi-slice gradient-echo EPI sequence with the following parameters: TR=5s, TE=13.2ms, FOV=240×240mm2, matrix size=64×64, slice thickness=3mm. The nominal spatial resolution of each voxel was 3.75 × 3.75 × 3 mm3. A labeling RF pulse of 3s was applied in the presence of a longitudinal gradient Gz=0.3G/cm at the appropriate labeling frequency offset, calculated according to Eq. [3]. The RF power used for labeling was previously optimized to produce the highest labeling efficiency26, while the control images were acquired in the absence of RF power. After a post-labeling delay of 1.2s, employed to avoid intravascular contamination29, the 23 contiguous slices were acquired in 800ms according to a sequential superior-inferior order to avoid interferences from the acquisition in the magnetization of labeled blood. Twenty-five (25) image pairs were acquired resulting in a total experiment time of 4min10s. The complete imaging protocol can be done in about 20 min, including the positioning of the separate labeling coil, scout images, angiogram, and CASL acquisitions with θ = 0° and θ = ±60°.
Data Processing
CBF values were calculated using the following equation30:
| [4] |
where ΔS is the signal difference between the labeled and unlabeled images, Sc is the control image signal intensity, R10 is the longitudinal relaxation rate of the tissue in the presence of flow, λ is the brain/blood partition coefficient, α is the labeling efficiency at the labeling position, R1a is the longitudinal relaxation rate of arterial blood, δ is the arterial blood transit time from the labeling site to the tissue, w is the post-labeling delay, TR is the effective repetition time, and τ0 is the labeling duration. Due to absence of perfusion signal, two subjects were excluded from further analysis.
Perfusion-weighted images of the flow territories of the selectively labeled cerebral arteries were obtained by subtraction of the ASL images from control images using MATLAB R2006a (The MathWorks, Natick, MA), and expressed in percent signal change. The values for ΔS and Sc were measured for all subjects, while values for R1a=0.67s−1, λ=0.9ml/g31, α=0.7526, and δ=1s were assumed. Also, T1=1.33s and T1=0.83s were assumed for gray matter (GM) and white matter (WM), respectively26, and w=1.2s, TR=5s, and τ0=3s were used in all calculations. To optimize the accuracy of image subtraction, acquisition times were kept as short as possible, determined essentially by the number of paired images required to achieve the desired SNR. Prior to subtraction, images were realigned using a rigid-body registration routine from SPM5 (Wellcome Department of Imaging Neuroscience, Queen Square, London, UK). The analyses were carried out based on regions of interests manually drawn in both left and right hemispheres superior to lateral ventricles. The average signal percentage change was assessed using Amira (Mercury Computer Systems Inc., Chelmsford, MA). Contrast-to-noise ratio (CNR) measurements were obtained dividing the mean intensity in the difference images of a tissue ROI by the standard deviation of an ROI in the noise region.
Results
The selectivity of labeling the semi-hemispheric perfusion territories was optimized by varying the angle θ of the labeling plane. Fig. 2 shows the percent signal difference in right and left GM and WM of a typical volunteer, plotted as a function of the tilt angle of the labeling plane. When θ = 0°, the condition for the regular CASL experiment, both hemispheres were efficiently labeled. As θ increased, signal in the left hemisphere decreased due to reduced efficiency of labeling of the left circulation. A sharp drop in CBF contrast occurred for θ > 30°, which is in good agreement with Eq. [1]. Indeed, the span of range of the labeling RF coil in the z-direction is EPz ≈ 45 mm, while the typical separation between the CCA was about 46 mm. Thus, it was expected that selective labeling of a single hemisphere would start to occur for θ > 26°. The percent signal change in left GM at θ = 40° was only 38% of the intensity at θ = 0°, further decreased to 5% at θ = 50° and was completely attenuated at θ = 60°. Thus, θ = ±60° was used as the optimal tilt angle for all further experiments.
Figure 2.

Percent signal differences (ΔS/Sc), obtained from ROIs drawn in the left and right GM and WM regions of a representative volunteer, plotted as a function of the angle in the labeling plane. Error bars represent the standard deviation of the signal inside the ROI. A sharp attenuation in perfusion on the left side is obtained for θ > 30°.
Figure 3a shows a subset of axial echo-planar images of a typical volunteer. The corresponding whole brain perfusion-weighted images obtained by labeling both the left and right arterial circulation are shown in Fig. 3b. Normal perfusion contrast was obtained both in GM as well as in WM, together with an excellent anatomical delineation of the cortical gyri. In this subject, the percent signal change was 1.14±0.09% in GM and 0.16±0.04% in WM, corresponding to calculated CBF values of 76±6 ml·100g−1·min−1 and 17±5 ml·100g−1·min−1, respectively. The perfusion images of the right hemisphere (Fig. 3c) show labeling of the left MCA territory in the most inferior slices. However, this is not a typical finding and the source of this contralateral contrast is likely to be a subject-specific contribution from the right ICA through the Circle of Willis which is known to have a large inter-individual variation32. Table 1 lists the signal difference and whole-brain CBF values, as well as the respective CNR obtained in GM and WM for all volunteers. The mean calculated CBF values in GM and WM across all volunteers was 74±13 ml·100g−1·min−1 (N=14) and 14±13 ml·100g−1·min−1 (N=14), respectively.
Figure 3.
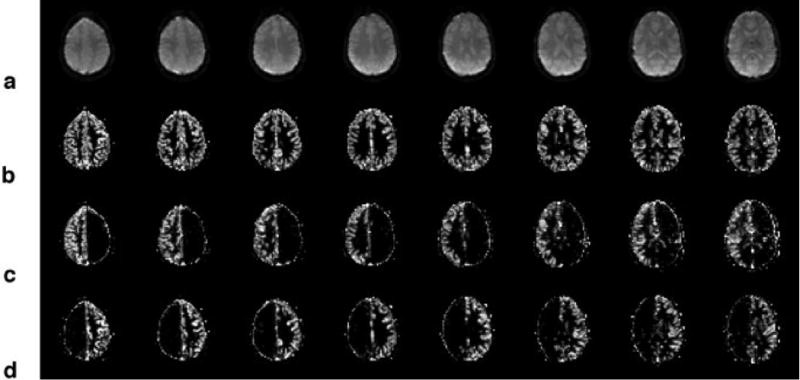
a) Axial echo-planar images of the brain of a typical subject. b) Corresponding whole-brain perfusion-weighted images acquired using θ=0°. c) Perfusion images of the right hemisphere, corresponding to the perfusion territory of the right CCA, acquired using θ=60° and d) of the left hemisphere, corresponding to the perfusion territory of the left CCA, acquired using θ=−60°.
Table 1.
Whole-brain (θ = 0°) Perfusion Signal Difference, CBF and CNR
| Subject |
Perfusion Signal Difference (%)
|
CBF (ml·100g−1·min−1)
|
CNR
|
|||||||||
|---|---|---|---|---|---|---|---|---|---|---|---|---|
| GM
|
WM
|
GM
|
WM
|
GM
|
WM
|
|||||||
| Left | Right | Left | Right | Left | Right | Left | Right | Left | Right | Left | Right | |
| 1 | 1.04 | 0.96 | −0.03 | −0.01 | 70 | 64 | −3 | −1 | 8 | 8 | 1 | 1 |
| 2 | 1.32 | 1.49 | 0.20 | 0.17 | 89 | 100 | 22 | 18 | 15 | 14 | 2 | 2 |
| 3 | 1.53 | 1.37 | 0.35 | 0.25 | 102 | 92 | 39 | 28 | 16 | 17 | 4 | 3 |
| 4 | 1.06 | 0.98 | 0.22 | 0.20 | 71 | 66 | 24 | 22 | 10 | 11 | 3 | 2 |
| 5 | 1.00 | 0.86 | 0.16 | 0.11 | 67 | 58 | 18 | 12 | 7 | 8 | 2 | 2 |
| 6 | 1.15 | 0.95 | 0.32 | 0.29 | 77 | 64 | 35 | 33 | 10 | 9 | 1 | 1 |
| 7 | 1.21 | 1.47 | 0.06 | 0.01 | 81 | 99 | 6 | 1 | 13 | 14 | 1 | 1 |
| 8 | 0.85 | 0.83 | −0.05 | −0.09 | 57 | 56 | −5 | −10 | 13 | 12 | 1 | 1 |
| 9 | 1.20 | 1.08 | 0.19 | 0.13 | 80 | 72 | 21 | 14 | 13 | 13 | 2 | 2 |
| 10 | 1.03 | 1.01 | 0.15 | 0.13 | 69 | 68 | 17 | 14 | 11 | 13 | 2 | 1 |
| 11 | 1.16 | 0.94 | 0.13 | 0.05 | 78 | 63 | 15 | 6 | 8 | 7 | 1 | 1 |
| 12 | 1.19 | 1.06 | 0.06 | −0.01 | 80 | 71 | 7 | −1 | 9 | 9 | 1 | 1 |
| 13 | 1.16 | 1.10 | 0.27 | 0.26 | 78 | 74 | 30 | 29 | 12 | 12 | 2 | 2 |
| 14 | 1.00 | 0.96 | 0.06 | 0.06 | 67 | 64 | 6 | 7 | 8 | 9 | 1 | 1 |
| Mean±SD | 1.13±0.16 | 1.08±0.21 | 0.15±0.12 | 0.11±0.12 | 76±11 | 72±14 | 17±13 | 12±13 | 11±3 | 11±3 | 2±1 | 2±1 |
All values were derived from equally-sized ROIs placed either in the left or the right brain hemisphere. Within GM and WM, paired t-tests showed no statistical differences either in the signal difference or in CBF between left and right hemispheres (P > 0.19). Negative CBF values are due to small perfusion signal relatively to noise level.
Arterial perfusion territories of the right and left cerebral hemispheres were obtained by tilting the labeling plane about the Y-axis by θ = +60° (Fig. 3c) and θ = −60° (Fig. 3d), respectively. In both cases, there was excellent CBF contrast in the hemisphere of interest, while the contralateral side showed almost no measurable contrast. In Fig. 3c and 3d, a bright ring of intensity, one pixel-wide, can be observed along the brain outline. This ring is an artifact due to the low signal of the edge pixels in the control image, which makes the ΔS/Sc ratio relatively large and perceptible due to the low signal intensity (< 2%) of the difference image.
Figure 4 shows the percent signal difference in left and right GM and WM at θ = 0°, corresponding to whole brain perfusion, along with the data obtained at θ = ±60°, corresponding to the right and left perfusion territories, averaged across all subjects. As listed in Table 1, there were no signal differences in GM or WM between left and right hemispheres when θ = 0° (P > 0.19), indicating efficient labeling of both cerebral hemispheres by the labeling RF coil. As listed in Table 2, when θ = +60°, the signal difference in GM on the left hemisphere, 0.07±0.06%, was 92% lower than on the right hemisphere, 0.85±0.30% (P < 10−9), while for θ = −60°, the signal in the right hemisphere, 0.16±0.13%, was 82% lower than on the contralateral side, 0.89±0.22% (P < 10−10). Likewise, in the WM, when θ = +60°, the average signal change on the unlabeled side was 0.02±0.05%, 85% lower than on the labeled hemisphere, 0.13±0.07% (P < 1×10⁻⁴), while when θ = −60°, the signal in the right hemisphere, 0.02±0.04%, was also 85% smaller than on the contralateral side, 0.13±0.08% (P < 10−3).
Figure 4.

Signal intensity averaged across all subjects obtained using θ = 0° and θ = ±60°. No difference between left and right hemispheres is observed when θ = 0°. However, a significant separation of left and right perfusion signal intensity is obtained with the use of a large tilt. (* P < 1×10⁻³, ** P < 1×10⁻⁹)
Table 2.
Perfusion Signal Difference using θ = ±60°
| Subject |
Perfusion Signal Difference (%)
|
|||||||
|---|---|---|---|---|---|---|---|---|
| θ = +60° | θ = −60° | |||||||
| GM
|
WM
|
GM
|
WM
|
|||||
| Left | Right | Left | Right | Left | Right | Left | Right | |
| 1 | 0.10 | 0.75 | −0.07 | 0.07 | 0.84 | 0.09 | 0.03 | 0.02 |
| 2 | −0.05 | 1.51 | −0.03 | 0.28 | 1.31 | 0.04 | 0.20 | 0.13 |
| 3 | 0.03 | 0.71 | −0.02 | 0.11 | 0.81 | 0.01 | 0.33 | 0.05 |
| 4 | −0.02 | 0.68 | 0.03 | 0.19 | 0.73 | 0.05 | 0.05 | −0.03 |
| 5 | 0.08 | 0.66 | 0.05 | 0.20 | 0.80 | 0.12 | 0.17 | 0.04 |
| 6 | 0.13 | 0.85 | −0.07 | 0.12 | 1.09 | 0.08 | 0.18 | 0.04 |
| 7 | 0.12 | 1.46 | 0.04 | 0.11 | 1.22 | 0.28 | 0.17 | 0.05 |
| 8 | 0.08 | 0.83 | 0.03 | 0.09 | 0.75 | 0.11 | 0.13 | 0.01 |
| 9 | 0.02 | 0.74 | 0.00 | 0.10 | 0.92 | 0.12 | 0.13 | 0.02 |
| 10 | 0.14 | 0.76 | 0.04 | 0.14 | 0.77 | 0.24 | 0.05 | −0.04 |
| 11 | 0.14 | 0.61 | 0.03 | 0.04 | 0.81 | 0.21 | 0.14 | −0.02 |
| 12 | 0.06 | 0.92 | 0.06 | 0.14 | 1.04 | 0.52 | 0.06 | −0.02 |
| 13 | 0.08 | 0.93 | 0.04 | 0.21 | 0.99 | 0.20 | 0.14 | 0.03 |
| 14 | 0.03 | 0.42 | 0.11 | 0.06 | 0.44 | 0.18 | 0.00 | −0.02 |
| Mean±SD | 0.07±0.06 | 0.85±0.30 | 0.02±0.05 | 0.13±0.07 | 0.89±0.22 | 0.16±0.13 | 0.13±0.08 | 0.02±0.04 |
All values were derived from equally-sized ROIs placed either in the left or the right brain hemisphere. Negative values are due to small perfusion signal relatively to noise level.
The large signal differentiation across the cerebral hemispheres, obtained with the use of a tilted (θ = ±60°) labeling gradient, allowed a clear delineation of the left and right cerebral arterial territories. In each hemisphere, the cerebral perfusion territory was composed of the anterior and middle circulations, supplied by the respective internal carotid arteries (ICA), and by the posterior circulation, supplied by the left and the right VAs. Because the VAs join to form the basilar artery (BA), labeling of either left or right circulation also labels, at least in part, the posterior circulation. Assuming identical contributions from the left and right VAs to the posterior circulation, it is possible to unravel the latter territory by employing an arithmetic post-processing algorithm, as proposed by Zimine et al18:
| [5] |
where LP and RP are the perfusion maps of the combined left and right circulations with the posterior (POST) circulation, respectively. Figure 5 shows a color-coded map of the cerebral perfusion territories obtained in a typical subject with the two-coil CASL approach. The right anterior and middle cerebral territories are colored in red, the left anterior and middle cerebral territories are colored in green and the posterior circulation is colored in blue. Except for the expected mixing of left and right circulations to form the posterior cerebral territory, the anterior and middle circulations were largely distinct, except for a small band of pixels along midline that contained contributions both from the right and the left circulation. These small common regions were primarily localized in the prefrontal and frontal superior cortices and in the middle inferior regions along thalamus and basal ganglia.
Figure 5.
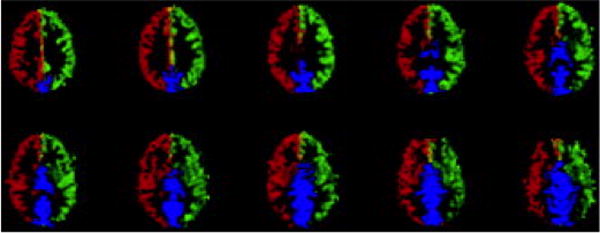
Color-coded perfusion territory maps showing the territories supplied by the right (red) and left (green) CCA. The posterior circulation (blue) can be obtained by post processing according to Eq. [5]. The mid brain region which contains contributions both from the right and the left circulation is showed in yellow.
Discussion
In the present work, we have demonstrated the successful combination of CASL with a dedicated labeling RF coil to determine the perfusion territories of the major cerebral feeding arteries in healthy human volunteers. By using a dedicated labeling RF coil and a tilted labeling plane, unilateral vascular territories were obtained with high SNR and robust delineation. In addition, because the labeling RF coil encompasses both left and right circulation in the neck, we were able to obtain whole-brain perfusion images within the same experimental session and using the same hardware setup. Furthermore, because both left and right circulations were visible in angiograms and accessible with the labeling coil, selective labeling of either the left or right vascular territories could be planned without the need to reposition the subject and/or the labeling coil. All of the above constitute significant practical advantages over previous ASL methods to obtain vascular territories with a separate labeling coil9–11. It should be noted that the technique is fully extendable to animal studies as well.
Consistent with previous studies26, good quality images were obtained over the whole brain with a separate labeling RF coil. However, long repetition times decrease the imaging efficiency, and thus SNR/time may not be optimal. Recently, several different methods have been proposed to boost the SNR/time of pulsed33 and continuous34 ASL. The method proposed here did not take advantage of the above implementations. It is possible that our SNR/time could improve with the adoption of the Turbo-CASL approach. However, such optimization was beyond the scope of the present work. Another feature that limits the SNR/time is the separate acquisition of individual perfusion territories. Significant improvements in SNR/time can be obtained if multiple territories are acquired in a single experiment. Recently, a new acquisition scheme that uses Hadamard encoding has been proposed as a way to increase the SNR/time of ASL experiments19. It will be interesting to apply Hadamard encoding in combination with a separate labeling RF coil as a way to improve the SNR/time further.
Table 1 shows perfusion values in GM were 4–6 times higher than in WM. This seems to be in discrepancy with previously published GM/WM perfusion ratios in the range of 1.635 to 3.736. A possible explanation for the high GM/WM perfusion ratio is the fact that in about half of the subjects, WM perfusion was not detectable above noise level, probably due to the longer transit time and the shorter T1 in WM when compared to GM. Indeed, if we eliminate all subjects in which WM CNR ≈ 1, the GM/WM CBF ratio would raise to 3.7±1.0, which is in agreement with values reported elsewhere.
There are a few noteworthy features related to the separate labeling RF coil that need to be discussed. The use of a dedicated labeling RF coil in CASL have the well-known advantages of: (a) avoiding magnetization transfer effects, resulting in higher signal difference between the ASL images and the control images and facilitating the acquisition of whole-brain CBF9,26,37,38; and (b) allowing for reduced RF power deposition on the subject by restricting power deposition to the immediate vicinity of the labeling RF coil and by avoiding the need to use off-resonance RF power for acquisition of the control images9,26. In the present work, we have used a dual rectangular loop RF coil, placed over the neck region, to allow bilateral labeling of the major cerebral feeding arteries, including both CCAs and VAs. As evidenced from the perfusion values obtained in left and right cerebral hemispheres (see Table 1), the labeling RF coil provides similar labeling of both left and right arterial circulations. This is an important feature that allows use of this setup to compare perfusion values across the hemispheres. In addition, this type of RF coil has limited coverage in the longitudinal and in the vertical directions. These are important features to avoid MT effects, but are also particularly critical to allow for selective unilateral labeling of the cerebral feeding arteries. As shown in Eq. [1], the ability to obtain selective unilateral labeling is governed by the individual separation δ between the left and the right circulation and by restricting the longitudinal excitation profile EPz of the labeling RF coil. The typical separation between the left and the right CCA in humans is about 46 mm, requiring, in our case, tilting the labeling plane by more than 26° to achieve any separation between left and right territories. Given that our labeling RF coil was not specifically optimized to be applied for mapping of the perfusion territories, it is possible that narrower coils may provide good selectivity at smaller tilts.
While it is possible to compensate for the large longitudinal excitation profile of the labeling coil with the use of very large tilts, in practice the angulation of the labeling plane is limited by the available gradient strength in the x-direction. Since our 3T system is equipped with gradients capable of providing 40mT/m, the maximum achievable labeling plane tilt, assuming Gz = 3mT/m, would be θmax = tan−1(40/3) = 85°. However, a disadvantage of using large labeling gradient tilts is that small errors in measuring the exact carotid position can lead to a significant decrease in selectivity of labeling, thus reducing the accuracy of delineation of the perfusion territories. Thus, the construction of an RF labeling coil with a constricted longitudinal excitation profile and accurate determination of the position of the RF coil are important in determining the successful implementation and application of the method to measure perfusion territories. Future studies may benefit from optimization of the longitudinal size of the labeling RF coil to facilitate accurate determination of its excitation profile and to reduce the tilting of the labeling plane necessary to selectively discriminate the left and right cerebral perfusion territories.
On average, the perfusion contrast obtained in GM from the ipsilateral side with the use of a tilted labeling plane, ΔS(θ = ±60°) = 0.87±0.26%, was significantly smaller than the contrast obtained without the use of tilt, ΔS(θ = 0°) = 1.11±0.19% (P < 0.001, see Fig. 4). Since measurements with and without tilt were obtained consecutively in the same experimental session, the difference in perfusion contrast could be attributed to setting the labeling frequency offset to a non-optimal value. This could be caused by errors in measuring the exact carotid position, which according to Eq. [3] would lead to a wrong frequency offset calculation. Also, if the carotids are not completely parallel to the z-direction, the addition of a transverse gradient to tilt the labeling plane would change the effective labeling gradient amplitude, potentially compromising the conditions for flow driven adiabatic inversion and reducing the labeling efficiency. However, both possibilities are likely to cause small effects. Thus, the cause of such reduction in labeling efficiency remains unclear at this point. This reduction compromises the ability to properly quantify CBF in the selected territory. However, even though the CBF quantification may yield important data on the pathophysiology of vascular disorders, the most relevant clinical information provided by measures of vascular territories is likely to be their spatial aspects. The dependence of the perfusion contrast on the tilt of the labeling plane shown in Fig. 4 indicates that the method is capable of robustly differentiating the right and the left perfusion territories. The average attenuation of the contrast on the contralateral side relative to the contrast obtained with global labeling was greater than 80% at 60° for both GM and WM, allowing for easy delineation of the ipsilateral perfusion territory. The reduced labeling efficiency was independent of the sign of the tilt of the labeling plane, suggesting that the perfusion territories can be accurately mapped in spite of a small underestimation of the perfusion values.
One significant drawback of using a separate labeling coil to obtain perfusion territories of the major cerebral feeding arteries is that labeling is restricted to the arteries situated in the neck region. This precludes the use of the method to independently obtain territories of the branches of the circle of Willis, allowing for a more detailed mapping of the regional contribution of finer cerebral arteries, such as the middle cerebral artery (MCA). Nevertheless, in a few cases it was possible to gain information about the posterior circulation due to the bilateral contribution from both VA, that merge to form the BA, as shown in Fig. 5. According to recent studies39,40, however, about a quarter of healthy population has either vertebral artery hypoplasia or aplasia, what could lead to misinterpretation of data in some subjects. In such cases, Eq. [5] would not be valid anymore and the scheme proposed here would not be able to map the posterior circulation. The same considerations are applicable to patients with occlusions in other arteries of interest. In the approach used here, each VA was jointly labeled with its collateral CCA, such that the unilateral vascular territories included contributions from both the anterior and posterior circulation. However, it is theoretically possible to separate the territory of each VA from its collateral CCA by using a double oblique labeling plane, provided the collateral VA and CCA are situated sufficiently apart from each other. Another drawback of using a separate labeling coil is that it requires use of extra hardware including a second transmit RF channel, which is currently not commonly available in clinical scanners. While this may preclude widespread clinical implementation of the method, this is likely to be a short limitation in view of the fast advancements in hardware technology achieved over the past several years.
In conclusion, the combination of a separate labeling coil with proper placement and direction of the labeling plane allowed for demarcation of the perfusion territories of the major cerebral feeding arteries with high SNR and no MT effects. The method can be applied in both the research as well as the clinical settings, allowing discrimination of the anterior and posterior circulation in each cerebral hemisphere to be obtained together with perfusion of the whole brain without the need to reposition either the labeling coil or the subject.
References
- 1.Detre JA, Zhang W, Roberts DA, et al. Tissue specific perfusion imaging using arterial spin labeling. NMR Biomed. 1994;7(1–2):75–82. doi: 10.1002/nbm.1940070112. [DOI] [PubMed] [Google Scholar]
- 2.Golay X, Hendrikse J, Lim TC. Perfusion imaging using arterial spin labeling. Top Magn Reson Imaging. 2004;15(1):10–27. doi: 10.1097/00002142-200402000-00003. [DOI] [PubMed] [Google Scholar]
- 3.Calamante F, Thomas DL, Pell GS, Wiersma J, Turner R. Measuring cerebral blood flow using magnetic resonance imaging techniques. J Cereb Blood Flow Metab. 1999;19(7):701–735. doi: 10.1097/00004647-199907000-00001. [DOI] [PubMed] [Google Scholar]
- 4.Barbier EL, Lamalle L, Decorps M. Methodology of brain perfusion imaging. J Magn Reson Imaging. 2001;13(4):496–520. doi: 10.1002/jmri.1073. [DOI] [PubMed] [Google Scholar]
- 5.Wintermark M, Sesay M, Barbier E, et al. Comparative overview of brain perfusion imaging techniques. Stroke. 2005;36(9):e83–99. doi: 10.1161/01.STR.0000177884.72657.8b. [DOI] [PubMed] [Google Scholar]
- 6.Rowley HA, Roberts TP. Clinical perspectives in perfusion: neuroradiologic applications. Top Magn Reson Imaging. 2004;15(1):28–40. doi: 10.1097/00002142-200402000-00004. [DOI] [PubMed] [Google Scholar]
- 7.Sorensen AG, Buonanno FS, Gonzalez RG, et al. Hyperacute stroke: evaluation with combined multisection diffusion-weighted and hemodynamically weighted echo-planar MR imaging. Radiology. 1996;199(2):391–401. doi: 10.1148/radiology.199.2.8668784. [DOI] [PubMed] [Google Scholar]
- 8.Warach S. Measurement of the ischemic penumbra with MRI: it’s about time. Stroke. 2003;34(10):2533–2534. doi: 10.1161/01.STR.0000092395.19554.9A. [DOI] [PubMed] [Google Scholar]
- 9.Zaharchuk G, Ledden PJ, Kwong KK, Reese TG, Rosen BR, Wald LL. Multislice perfusion and perfusion territory imaging in humans with separate label and image coils. Magn Reson Med. 1999;41(6):1093–1098. doi: 10.1002/(sici)1522-2594(199906)41:6<1093::aid-mrm4>3.0.co;2-0. [DOI] [PubMed] [Google Scholar]
- 10.Mildner T, Trampel R, Moller HE, Schafer A, Wiggins CJ, Norris DG. Functional perfusion imaging using continuous arterial spin labeling with separate labeling and imaging coils at 3 T. Magn Reson Med. 2003;49(5):791–795. doi: 10.1002/mrm.10438. [DOI] [PubMed] [Google Scholar]
- 11.Trampel R, Mildner T, Goerke U, Schaefer A, Driesel W, Norris DG. Continuous arterial spin labeling using a local magnetic field gradient coil. Magn Reson Med. 2002;48(3):543–546. doi: 10.1002/mrm.10228. [DOI] [PubMed] [Google Scholar]
- 12.Eastwood JD, Holder CA, Hudgins PA, Song AW. Magnetic resonance imaging with lateralized arterial spin labeling. Magn Reson Imaging. 2002;20(8):583–586. doi: 10.1016/s0730-725x(02)00536-2. [DOI] [PubMed] [Google Scholar]
- 13.Werner R, Alfke K, Schaeffter T, Nabavi A, Mehdorn HM, Jansen O. Brain perfusion territory imaging applying oblique-plane arterial spin labeling with a standard send/receive head coil. Magn Reson Med. 2004;52(6):1443–1447. doi: 10.1002/mrm.20253. [DOI] [PubMed] [Google Scholar]
- 14.Taoka T, Iwasaki S, Nakagawa H, et al. Distinguishing between anterior cerebral artery and middle cerebral artery perfusion by color-coded perfusion direction mapping with arterial spin labeling. AJNR Am J Neuroradiol. 2004;25(2):248–251. [PMC free article] [PubMed] [Google Scholar]
- 15.Hendrikse J, van der Grond J, Lu H, van Zijl PC, Golay X. Flow territory mapping of the cerebral arteries with regional perfusion MRI. Stroke. 2004;35(4):882–887. doi: 10.1161/01.STR.0000120312.26163.EC. [DOI] [PubMed] [Google Scholar]
- 16.Werner R, Norris DG, Alfke K, Mehdorn HM, Jansen O. Continuous artery-selective spin labeling (CASSL) Magn Reson Med. 2005;53(5):1006–1012. doi: 10.1002/mrm.20475. [DOI] [PubMed] [Google Scholar]
- 17.Golay X, Petersen ET, Hui F. Pulsed star labeling of arterial regions (PULSAR): a robust regional perfusion technique for high field imaging. Magn Reson Med. 2005;53(1):15–21. doi: 10.1002/mrm.20338. [DOI] [PubMed] [Google Scholar]
- 18.Zimine I, Petersen ET, Golay X. Dual vessel arterial spin labeling scheme for regional perfusion imaging. Magn Reson Med. 2006;56(5):1140–1144. doi: 10.1002/mrm.21049. [DOI] [PubMed] [Google Scholar]
- 19.Gunther M. Efficient visualization of vascular territories in the human brain by cycled arterial spin labeling MRI. Magn Reson Med. 2006;56(3):671–675. doi: 10.1002/mrm.20998. [DOI] [PubMed] [Google Scholar]
- 20.Jones CE, Wolf RL, Detre JA, et al. Structural MRI of carotid artery atherosclerotic lesion burden and characterization of hemispheric cerebral blood flow before and after carotid endarterectomy. NMR Biomed. 2006;19(2):198–208. doi: 10.1002/nbm.1017. [DOI] [PubMed] [Google Scholar]
- 21.van Laar PJ, Hendrikse J, Golay X, Lu H, van Osch MJ, van der Grond J. In vivo flow territory mapping of major brain feeding arteries. NeuroImage. 2006;29(1):136–144. doi: 10.1016/j.neuroimage.2005.07.011. [DOI] [PubMed] [Google Scholar]
- 22.Wong EC. Vessel encoded arterial spin labeling using pseudo-continuous tagging. Seattle, WA: 2006. [Google Scholar]
- 23.Hendrikse J, van der Zwan A, Ramos LM, et al. Altered flow territories after extracranial-intracranial bypass surgery. Neurosurgery. 2005;57(3):486–494. doi: 10.1227/01.neu.0000170563.70822.10. [DOI] [PubMed] [Google Scholar]
- 24.Davies NP, Jezzard P. Selective arterial spin labeling (SASL): perfusion territory mapping of selected feeding arteries tagged using two-dimensional radiofrequency pulses. Magn Reson Med. 2003;49(6):1133–1142. doi: 10.1002/mrm.10475. [DOI] [PubMed] [Google Scholar]
- 25.Paiva FF, Tannus A, Silva AC. Measurement of cerebral perfusion territories using arterial spin labeling. NMR Biomed. 2007 doi: 10.1002/nbm.1177. In Press. [DOI] [PMC free article] [PubMed] [Google Scholar]
- 26.Talagala SL, Ye FQ, Ledden PJ, Chesnick S. Whole-brain 3D perfusion MRI at 3.0 T using CASL with a separate labeling coil. Magn Reson Med. 2004;52(1):131–140. doi: 10.1002/mrm.20124. [DOI] [PubMed] [Google Scholar]
- 27.Williams DS, Detre JA, Leigh JS, Koretsky AP. Magnetic resonance imaging of perfusion using spin inversion of arterial water. Proc Natl Acad Sci U S A. 1992;89(1):212–216. doi: 10.1073/pnas.89.1.212. [DOI] [PMC free article] [PubMed] [Google Scholar]
- 28.Maccotta L, Detre JA, Alsop DC. The efficiency of adiabatic inversion for perfusion imaging by arterial spin labeling. NMR Biomed. 1997;10(4–5):216–221. doi: 10.1002/(sici)1099-1492(199706/08)10:4/5<216::aid-nbm468>3.0.co;2-u. [DOI] [PubMed] [Google Scholar]
- 29.Alsop DC, Detre JA. Reduced transit-time sensitivity in noninvasive magnetic resonance imaging of human cerebral blood flow. J Cereb Blood Flow Metab. 1996;16(6):1236–1249. doi: 10.1097/00004647-199611000-00019. [DOI] [PubMed] [Google Scholar]
- 30.Garraux G, Hallett M, Talagala SL. CASL fMRI of subcortico-cortical perfusion changes during memory-guided finger sequences. Neuroimage. 2005;25(1):122–132. doi: 10.1016/j.neuroimage.2004.11.004. [DOI] [PubMed] [Google Scholar]
- 31.Herscovitch P, Raichle ME. What is the correct value for the brain–blood partition coefficient for water? J Cereb Blood Flow Metab. 1985;5(1):65–69. doi: 10.1038/jcbfm.1985.9. [DOI] [PubMed] [Google Scholar]
- 32.van Laar PJ, van der Grond J, Mali WP, Hendrikse J. Magnetic resonance evaluation of the cerebral circulation in obstructive arterial disease. Cerebrovasc Dis. 2006;21(5–6):297–306. doi: 10.1159/000091534. [DOI] [PubMed] [Google Scholar]
- 33.Wong EC, Luh WM, Liu TT. Turbo ASL: arterial spin labeling with higher SNR and temporal resolution. Magn Reson Med. 2000;44(4):511–515. doi: 10.1002/1522-2594(200010)44:4<511::aid-mrm2>3.0.co;2-6. [DOI] [PubMed] [Google Scholar]
- 34.Hernandez-Garcia L, Lee GR, Vazquez AL, Noll DC. Fast, pseudo-continuous arterial spin labeling for functional imaging using a two-coil system. Magn Reson Med. 2004;51(3):577–585. doi: 10.1002/mrm.10733. [DOI] [PubMed] [Google Scholar]
- 35.Ye FQ, Berman KF, Ellmore T, et al. H(2)(15)O PET validation of steady-state arterial spin tagging cerebral blood flow measurements in humans. Magn Reson Med. 2000;44(3):450–456. doi: 10.1002/1522-2594(200009)44:3<450::aid-mrm16>3.0.co;2-0. [DOI] [PubMed] [Google Scholar]
- 36.Campbell AM, Beaulieu C. Comparison of multislice and single-slice acquisitions for pulsed arterial spin labeling measurements of cerebral perfusion. Magn Reson Imaging. 2006;24(7):869–876. doi: 10.1016/j.mri.2006.03.011. [DOI] [PubMed] [Google Scholar]
- 37.Silva AC, Zhang W, Williams DS, Koretsky AP. Multi-slice MRI of rat brain perfusion during amphetamine stimulation using arterial spin labeling. Magn Reson Med. 1995;33(2):209–214. doi: 10.1002/mrm.1910330210. [DOI] [PubMed] [Google Scholar]
- 38.Zhang W, Silva AC, Williams DS, Koretsky AP. NMR measurement of perfusion using arterial spin labeling without saturation of macromolecular spins. Magn Reson Med. 1995;33(3):370–376. doi: 10.1002/mrm.1910330310. [DOI] [PubMed] [Google Scholar]
- 39.Park JH, Kim JM, Roh JK. Hypoplastic vertebral artery; Frequency and associations with ischemic Stroke territory. J Neurol Neurosurg Psychiatry. 2006 doi: 10.1136/jnnp.2006.105767. [DOI] [PMC free article] [PubMed] [Google Scholar]
- 40.Min JH, Lee YS. Transcranial Doppler ultrasonographic evaluation of vertebral artery hypoplasia and aplasia. J Neurol Sci. 2007;260(1–2):183–187. doi: 10.1016/j.jns.2007.05.001. [DOI] [PubMed] [Google Scholar]