

Abstract
Hematopoietic stem cell (HSC) gene therapy using retroviral vectors has immense potential, but vector-mediated genotoxicity limits use in the clinic. Lentiviral vectors are less genotoxic than gammaretroviral vectors and have become the vector of choice in clinical trials. Foamy retroviral vectors have a promising integration profile and are less prone to read-through transcription than gammaretroviral or lentiviral vectors. Here, we directly compared the safety and efficacy of foamy vectors to lentiviral vectors in human CD34+ repopulating cells in immunodeficient mice. To increase their genotoxic potential, foamy and lentiviral vectors with identical transgene cassettes with a known genotoxic spleen focus forming virus promoter were used. Both vectors resulted in efficient marking in vivo and a total of 825 foamy and 460 lentiviral vector unique integration sites were recovered in repopulating cells 19 weeks after transplantation. Foamy vector proviruses were observed less often near RefSeq gene and proto-oncogene transcription start sites than lentiviral vectors. The foamy vector group were also more polyclonal with fewer dominant clones (two out of six mice) than the lentiviral vector group (eight out of eight mice), and only lentiviral vectors had integrants near known proto-oncogenes in dominant clones. Our data further support the relative safety of foamy vectors for HSC gene therapy.
Introduction
Retroviral hematopoietic stem cell (HSC) gene therapy has immense potential for being a standard treatment option for numerous hematopoietic diseases, including primary immunodeficiencies, as evidenced by recent successful clinical trials.1–4 Some of the first clinical trials for gene therapy showed that retroviral vectors could effectively deliver therapeutic genes and correct a disease phenotype. However, these successes were overshadowed by the development of serious side effects in patients, such as leukemia resulting from vector-mediated genotoxicity.5–8 Over the last two decades, significant progress has been made to improve the safety and efficacy of retroviral vectors. In many cases, the benefits of retroviral gene therapy far outweigh the risks involved with treatment. Many patients suffering from primary immunodeficiencies are unable to find matching allogeneic stem cell donors. For these patients, HSC gene therapy is a promising life-saving treatment option. While genotoxicity remains a major challenge in this field, recent phase 1 and phase 2 clinical trials using next-generation vectors have been successful in treating these disorders without serious adverse events occurring.1–4 These success stories provide encouragement that if genotoxicity can be reduced, HSC gene therapy may become the standard of care for some patients.
Gammaretroviral vectors were used in the first gene therapy clinical trials and were successful in correcting mono-allelic genetic disorders such as X-linked severe combined immunodeficiency disorder (SCID-X1), Wiskott-Aldrich syndrome, and adenosine deaminase deficiency-SCID.4–9 However, the vector-mediated leukemias that occurred in the French SCID-X1 trial caused researchers to take a step back and address safety concerns.4–8 A major focus of the field is now to evaluate and compare different vectors and to develop novel approaches to reduce vector genotoxicity to improve the safety of vectors used in the clinic. These studies have been conducted with gammaretroviral vectors10–24 as well as with other retroviral vector systems including lentiviral (LV)10,12–16,19,20,23–30 and foamy viral (FV)15,17,24,31–35 vectors.
In current clinical trials, LV vectors are the retroviral vector system of choice due to their improved safety in comparison to gammaretroviral vectors.10,12–16,19,20,23–30 LV vectors integrate less frequently near transcription start sites than gammaretroviral vectors reducing their genotoxic potential.10,12,14,19,24 LV vectors have been used to transduce a variety of cell types, including slowly dividing hematopoietic stem cells (HSCs) and progenitors.
Although LV vectors are safer relative to gammaretroviral vectors, LV vectors can still result in clonal expansion. For example, in a β-thalassemia clinical trial conducted in 2007, LV vector transduced HSCs were successfully transplanted into a patient. Despite very low gene transfer, significant therapeutic benefit was observed in this patient. However, roughly 10% of this patient’s blood cells contained viral integrants in the third intron of the high mobility group AT-hook 2 locus, and a majority of the therapeutic benefit observed can be attributed to this dominant clone. While no serious adverse events have been reported yet, it is a case of clonal expansion and therefore a cause for concern.36
FV vectors are a promising alternative to LV vectors for future clinical use in HSC gene therapy. FV vectors can be produced at high titer and have broad tissue tropism using the native FV envelope.37 FV vectors have additional advantages for HSC gene therapy including having a favorable integration profile,24,31 a large transgene capacity,38 and less read-through transcription than gammaretroviral or LV vectors.16 It has already been shown in a large animal model that FV vectors can provide long-lasting therapeutic benefit while maintaining a polyclonal distribution of gene-modified cells.33 The use of insulator elements39 and integration retargeting (Hocum et al., manuscript submitted) have the potential to further improve the safety of FV vectors.
Given that FV and LV vectors appear to have less intrinsic risk than the gammaretroviral vectors that were used in early clinical trials,10,12–16,19,20,23–29 we aimed to answer the question of whether FV vectors are intrinsically safer than the now commonly used LV vectors.
FV and LV vectors have previously been compared in human SCID repopulating cells.34 However, the FV and LV vectors used in this study utilized the less genotoxic murine stem cell virus promoter and only included a comparison of engraftment and gene marking. A thorough analysis of genotoxicity would benefit the development of vectors for clinical applications. Here, we expand on previous studies and directly compare the genotoxicity of LV and FV vectors utilizing identical transgene cassettes driven by a spleen focus forming virus (SFFV) promoter to enhance genotoxicity in human CD34+ SCID repopulating cells.
Results
For FV vectors to be used clinically for HSC gene therapy, their safety must be assessed relative to the current standard which is LV vectors. The objective of this study was to directly compare the genotoxicity of LV and FV vectors in human SCID repopulating cells. We chose to use a highly genotoxic SFFV promoter to enhance genotoxicity and reduce the time needed to observe clonal dominance in normal human cord blood CD34+ SCID-repopulating cells. NOD.Cg-Prkdcscid Il2rgtm1Wjl/SzJ (NSG) mice were transplanted with human CD34+ cells exposed to FV (n = 8 mice), LV (n = 8 mice) vectors or no vector (n = 2 mice). To directly compare the two vector systems, FV and LV vectors with identical transgene cassettes that utilized the SFFV promoter were used (Figure 1).
Figure 1.
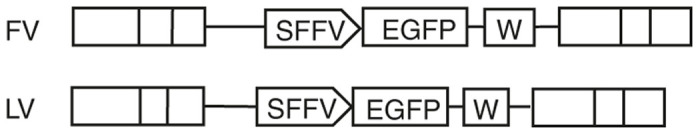
Vector design of FV-SGW-KO and LV-RSV-SGW-KO. SFFV, spleen focus forming virus promotor; EGFP, enhanced green fluorescent protein; W, woodchuck hepatitis virus post-transcriptional element (increases transgene expression).
FV vectors show similar engraftment and marking to LV vectors at a lower multiplicity of infection (MOI).
It has previously been seen that at the same MOI, FV vectors show higher engraftment and gene marking in SCID repopulating cells.34 In an attempt to achieve similar engraftment and gene marking levels, human CD34+ cord blood cells were exposed to the FV vector at an MOI of 10 and the LV vector at an MOI of 25. In preliminary experiments, these MOIs gave similar transduction efficiency of human CD34+ cells. The vector exposed cells were then either maintained in vitro or transplanted into NSG mice.
Of the FV-exposed cells, 50.1% expressed enhanced green fluorescent protein (EGFP) in liquid culture 6 days post-transduction and 60.5% expressed EGFP 9 days post-transduction (Supplementary Figure S1a). Seven days post-transduction, 55.4 ± 1.9% of the progenitors expressed EGFP in the CFU assay (Supplementary Figure S1b) with a 24 ± 4.5% plating efficiency (Supplementary Figure S1c). Of the LV vector-exposed cells, 26.3% expressed EGFP in liquid culture 6 days post-transduction and 23.3% EGFP 9 days post-transduction (Supplementary Figure S1a). Seven days post-transduction, 30.1 ± 2.1% of progenitors expressed EGFP in the CFU assay (Supplementary Figure S1b) with a 14 ± 1.1% plating efficiency (Supplementary Figure S1c). NSG mice were transplanted with 1 × 10⁵ CD34+ human cord blood cells transduced with either a FV or LV vector. A control group was transplanted with untransduced CD34+ cord blood cells. In the FV group, two tail vein injections of human CD34+ cells failed and these mice were subsequently excluded from this study. To track engraftment of human cells (CD45+) and gene marking (EGFP+), peripheral blood was collected 6 weeks post-transplant and at three week intervals thereafter until sacrifice (Figure 2a,b). In all groups, the number of human CD45+ (HuCD45+) leukocytes increased over time. The frequency of gene-marked cells decreased in both FV and LV vector-transduced cells over time before finally leveling off at 12 weeks post-transplant.
Figure 2.
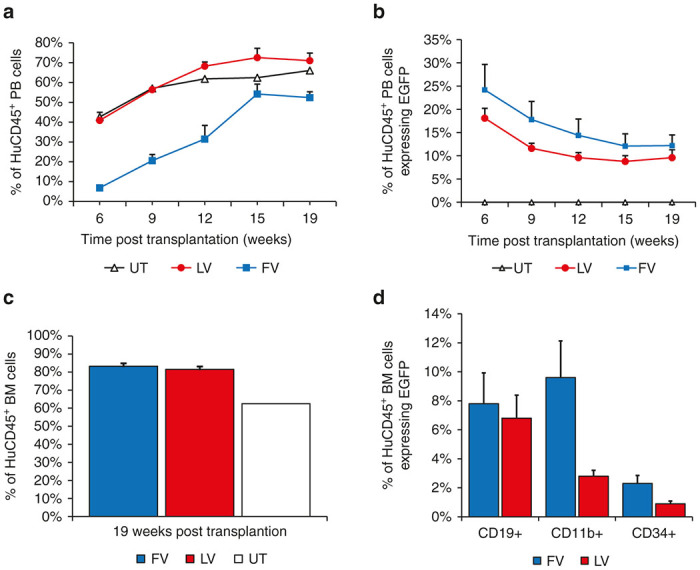
Engraftment and marking of human SCID repopulating cells (SRCs) and vector marking in peripheral blood and bone marrow samples collected from humanized NSG mice. (a) Engraftment of SRCs in peripheral blood collected 6–15 weeks post-transplant. (b) Proportion of HuCD45+ cells expressing EGFP. (c) Engraftment of human SRCs in bone marrow 19 weeks post-transplant. (d) Vector marking in specific cell lineages in bone marrow subsets. Marking was determined by expression of enhanced green fluorescent protein (EGFP). Statistical difference was determined using unpaired t-tests. HuCD45+, human CD45+ cells; PB, peripheral blood; EGFP, enhanced green fluorescent protein; BM, bone marrow.
Mice were euthanized at 19 weeks post-transplant and blood and bone marrow were collected to analyze engraftment of human SCID-repopulating cells (Figure 2a,c), gene marking (Figure 2b), and the contribution of different hematopoietic lineages using flow cytometry (Figure 2d). Engraftment of SCID-repopulating cells in the bone marrow was similarly high in FV and LV vector groups, 83.2 versus 81.5% HuCD45+ respectively (Figure 2c). In the peripheral blood, marking in the FV vector group and LV vector group were not significantly different (P = 0.367) at 19 weeks with 12.2 and 9.6% of peripheral blood HuCD45+ cells expressing EGFP, respectively (Figure 2b). Progenitor (CD34+), lymphoid (CD19+), and myeloid (CD11b/Mac-1) populations of vector expressing HuCD45+ cells were analyzed. Mice with FV vector-transduced cells showed a similar percentage of CD19+ (7.8 ± 2.1 versus 6.8 ± 1.5%; P = 0.419) populations and slightly higher percentage of CD11b/Mac-1 (9.6 ± 2.5 versus 2.8 ± 0.4%; P = 0.026), and CD34+ (2.3 ± 0.6 versus 0.90 ± 0.2%; P = 0.004) populations than mice with LV vector-transduced cells, respectively (Figure 2d). In summary, both FV and LV vector groups had high engraftment and very similar marking at 19 weeks post-transplantation even though the MOI used for FV was 2.5-fold lower than for LV.
FV vectors integrate less frequently near TSS of genes and proto-oncogenes
Genomic DNA was extracted from the bone marrow collected from the mice 19 weeks post-transplantation and was used for high-throughput analyses of integration sites. Modified genomic sequencing PCR (MGS-PCR) using the Illumina MiSeq paired-end platform40 and VISA41 were used to identify retroviral integration sites (RIS). 825 unique FV vector RIS and 460 unique LV vector RIS were recovered in human SCID repopulating cells. These RIS were analyzed to complete integration profiles for both FV and LV vectors.
Vector integrations in or near genes can dysregulate their expression and lead to malignant transformation. FV and LV vector proviruses displayed characteristic integration profiles with LV vector proviruses preferentially integrating within actively transcribed regions of RefSeq genes (Figure 3a)15,24,25 and FV vector proviruses having a slight preference for integrating near CpG islands (Figure 3b).15,31,33 FV vector proviruses showed a modest preference for integrating within 1 kb upstream of transcription start sites (TSS) while still integrating less frequently within 50 kb of transcription start sites than LV vector proviruses. It was observed that 14.2% of FV vector proviruses and 20.1% of LV vector proviruses integrated within 50 kb of TSS in RefSeq genes (Figure 3a,e). CpG islands are under-methylated sequence clusters rich in G-C content that often overlap with gene promoters and are sites of transcription initiation. Integration near CpG islands can thus upregulate transcription of nearby genes and lead to malignant transformation. As previously seen, neither FV nor LV vectors showed a strong preference for integrating near CpG islands, although FV vectors did show a slight preference for integrating 1 kb up/downstream of CpG islands (Figure 3b,e).15,24,25,31,33
Figure 3.

Integration profiles of foamy viral and lentiviral vector proviruses. (a) Percentage of integrations per kb in relation to transcription start sites of RefSeq genes. (b) Percentage of integrations per kb in relation to CpG islands. (c) Percentage of integrations in relation to transcription start sites of proto-oncogenes. (d) Number of hotspots for each vector within different bin boundaries. Statistical significance was determined using chi-square analysis. (e) Summary of statistical differences for a, b, and c. Stars indicate being significantly less at *P < 0.05, **P < 0.001. TSS, transcription start site.
We also identified enriched gene classes for FV and LV integrants using the Database for Annotation, Visualization, and Integrated Discovery 6.7 (refs. 42,43) as previously described.14 Both FV and LV proviral integrants were enriched in genes involved in transcription and neither were enriched in proto-oncogenes (Supplementary Table S1).
To identify integrations in or near known proto-oncogenes, FV and LV vector integrations from all transplanted mice were pooled, respectively, and compared with 2,048 known proto-oncogenes listed in The Network of Cancer Genes 4.0.44 The distributions of FV and LV vector RIS near proto-oncogenes were similar (Figure 3c,e), however, FV vector proviruses integrated less frequently within 50 kb of TSS in proto-oncogenes than LV vectors (9.5 versus 12.6%; P value = 0.027).
FV vectors have fewer integration hotspots than LV vectors in human SCID repopulating cells
Hotspots, defined as three RIS in a 50 kb genomic region or four RIS within a 100 kb genomic region,45 may indicate increased genotoxicity when observed near growth regulatory genes or proto-oncogenes. In order to compare hotspots, it is necessary to use size-matched data sets; so, we normalized the datasets by matching the number of FV and random RIS to the smallest dataset (LV). We then analyzed 460 FV, LV, and random RIS for integration hotspots and observed that FV had a lower frequency of hotpots than LV (Figure 3d). FV had two hotspots comprised of seven RIS total, whereas LV had three hotspots comprised of eleven RIS total. Neither FV nor LV vectors had hotspots within 100 kb of proto-oncogenes (Supplementary Figures S2 and S3). We also analyzed the complete FV dataset (not normalized to the smaller LV dataset) for hotspots and observed one hotspot that was located 76 kb upstream from the proto-oncogene KDM5A (Supplementary Figure S3c). However, this integrant was not a dominant clone.
FV vectors are less prone to clonal dominance
RIS in each mouse were analyzed using capture frequency to detect clonal dominance. Repopulation was polyclonal in FV (Figure 4a) and more oligoclonal in LV (Figure 4b) mouse bone marrow samples. Dominant clones were defined as a single integration site accounting for over 20% of all RIS captures and were observed in mice transplanted with both FV and LV vector-transduced cells. However, a higher frequency of dominant clones was observed in the LV vector transplanted mice than for the FV vector. Thirteen dominant clones were recovered from eight mice transplanted with LV vector-transduced cells, and only three dominant clones from six mice transplanted with FV vector-transduced cells (Table 1). We performed quantitative real-time PCR to ensure that the clonal dominance observed in the LV vector-transduced cells was not based on copy number bias. The gDNA extracted from the peripheral blood of FV and LV group mice were shown to have a similar number of vector copies per cell, with FV having 1.3 vector copies per cell and LV containing 1.2 vector copies per cell.
Figure 4.

Clonality analysis of foamy viral and lentiviral proviral integrations. Each bar represents a single mouse for each vector. The last bar in each graph represents the combined analysis for each vector type. The top ten clones with the highest capture frequency for each mouse are depicted as white boxes. The total number of unique integrations is represented by the number on top of each bar. RIS, retroviral integration site, M, mouse.
Table 1. FV and LV vector clones contributing to more than 20% of all RIS.
| Vector | Mouse | Chromosome | RIS | Contribution to all RISa | Closest proto-oncogene (distance)b |
|---|---|---|---|---|---|
| LV | 6 | 22 | 40507529 | 99% | Within MKL1 |
| LV | 8 | 1 | 26500029 | 66% | RPS6KA1 (30 kb) |
| LV | 1 | 12 | 123718848 | 63% | n/a |
| 19 | 15447449 | 28% | CYP4F22 (61 kb) | ||
| LV | 3 | X | 78694471 | 63% | n/a |
| 13 | 28176971 | 33% | FLT3 (76 kb) | ||
| FV | 5 | X | 36964413 | 39% | n/a |
| 22 | 30608050 | 27% | n/a | ||
| LV | 4 | 9 | 137093265 | 34% | n/a |
| 4 | 39714912 | 22% | n/a | ||
| LV | 5 | 3 | 49761647 | 30% | MST1 (73 kb) |
| 9 | 122215765 | 25% | n/a | ||
| LV | 2 | 2 | 238004311 | 23% | n/a |
| 5 | 122826778 | 22% | n/a | ||
| LV | 7 | 1 | 207939040 | 22% | n/a |
| FV | 6 | 4 | 106716013 | 20% | n/a |
FV, foamy viral; LV, lentiviral; n/a, not applicable; RIS, retroviral integration site.
Capture frequency per mouse.
Proto-oncogenes within 100 kb of RIS.
Next, we analyzed the proviral integrations of the dominant clones for proximity to RefSeq genes associated with cell growth and proto-oncogenes. None of the three dominant clones observed in the mice transplanted with FV vector-transduced cells had integrations within 100 kb of the TSS in known proto-oncogenes, whereas 5 of the 13 dominant clones observed in the mice transplanted with LV vector-transduced cells integrated within 100 kb of TSS in proto-oncogenes (Table 1). We also expanded this analysis to include integrations of dominant clones within 500 kb of proto-oncogenes. We found two additional FV integrations within 500 kb of a proto-oncogene and seven additional LV integrations within 500 kb of a proto-oncogene (Supplementary Table S2).
Of the eight mice in the LV group, five had dominant clones with proviral integrations within or near a proto-oncogene. Each of these integrations were mapped on the human genome (Supplementary Figure S4). The most dominant clone in this study accounted for 99% of all captured RIS in LV mouse six, and contained a proviral integration within the proto-oncogene megakaryoblastic leukemia (MKL1). Ranging from a contribution of 30–66% of all captured RIS in individual mice, LV mouse one, three, five, six, and eight each had a dominant clone with a proviral integration near the proto-oncogenes ribosomal protein S6 kinase A1 (RPS6KA1), cytochrome P450 family 4 subfamily F member 22 (CYP4F22), fms related tyrosine kinase 3 (FLT3), or macrophage stimulating 1 (MST1) (Table 1). Thus in five out of eight mice from the LV group there was a dominant clone near a known proto-oncogene while zero out of six mice from the FV group had a dominant clone near a known proto-oncogene.
Discussion
Since the first appearance of serious adverse events in patients treated with HSC gene therapy during early clinical trials, much research in the field has focused on reducing retroviral vector genotoxicity. It has been established that many factors contribute to genotoxicity including the vector dose, the amount of stem cells transplanted into the patient, the integration profile of the vector type, the vector design, effects of the transgene cassette, and even the host cell environment.24,25 Given that FV and LV vectors are less genotoxic than gammaretroviral vectors,14–16,39,46 we directly compared the safety of these vector systems and found that FV vectors compare favorably to LV vectors in human SCID repopulating cells.
We have developed a sensitive and clinically relevant in vivo genotoxicity screen to compare the relative safety of different vectors. By using a highly genotoxic SFFV promoter, the genotoxic potential of both vector systems are enhanced, creating a worst-case scenario for each system. Our approach allowed us to observe statistically significant differences in normal human CD34+ repopulating cells, obviating the need for a tumor prone mouse model. In comparison to the commonly used tumor-prone mouse model,12,19 our screen employs human CD34+ SCID repopulating cells in an NSG mouse model to directly show how each vector will affect normal human cells. Although similar, there are significant differences between the mouse and human genomes. This is a particularly important consideration for predicting potential genotoxicity in clinical trials. For these reasons, we believe that human SCID repopulating cells have several advantages over the tumor prone mouse model for HSC gene therapy preclinical studies. In using this genotoxicity screen, researchers will be able to compare the intrinsic risk of different vectors in human repopulating cells.
Here, we show that at a lower MOI, FV vector-transduced human CD34+ SCID repopulating cells had a similar final marking to LV vector-transduced cells. Although FV vector-transduced CD34+ cells took a longer time to reach similar engraftment levels as LV vector-transduced CD34+ cells, we have not consistently seen this pattern.33,35 It is interesting that the marking for FV and LV vectors was similar in SCID repopulating cells in our study and similar to what was observed in a previous study that used canine long-term repopulating cells.33
Using MGS-PCR, we retrieved significantly more unique integration sites (1275 RIS in a total of 14 mice) in SCID repopulating cells than previous studies.34,35 We predict that as high-throughput sequencing evolves the number of integration sites retrieved will continue to increase. Both FV and LV vectors displayed integration profiles similar to what has previously been reported in other studies, with FV vectors having a slight integration preference near CpG islands and LV vectors having an integration preference for transcriptionally active regions of RefSeq genes.15,24,33
One of the major concerns for retroviral genotoxicity is the transactivation of proto-oncogenes. Although transactivation of proto-oncogenes has been observed by integrations as far as 500 kb away from TSS,47 it has previously been shown that integrations within a 50 kb window of TSS in proto-oncogenes increases the likelihood of transactivation.24 Similar to other studies, we observed that FV proviruses integrate less frequently within 50 and 500 kb of TSS in proto-oncogenes than LV proviruses (Figure 3b,e).24,31–34,37 Although we observed a slightly higher number of integrations within this proximity to proto-oncogenes than has previously been reported,24,31–34,37 this difference may be due to the use of the SFFV promoter. It is important to stress that while we believe our model using the SFFV promoter in human repopulating cells has several advantages over tumor prone mouse models, we would expect less genotoxicity with a housekeeping promoter like the elongation factor 1 α (EF1α) or phosphoglycerate kinase promoter (Pgk) that would likely be used in a clinical trial.
Progression toward monoclonality is another major concern for retroviral genotoxicity. Clonal dominance often occurs when a clone has a proviral integration near a proto-oncogene or a proliferative gene giving the clone a growth or survival advantage in comparison to other clones.24,25,47–51 Multiple mutations are typically necessary for malignant transformation to occur, with the first mutagenic event being proviral integration. Even if all dominant clones do not immediately lead to clonal outgrowth, the risk of activating proto-oncogenes significantly increases as more mutations accumulate over time.50
In our study, analysis of clonality within repopulating cells in individual mice showed that FV had a more polyclonal distribution with less dominant clones than LV. Potentially even more important, five of the clones in the LV group had integrations within 100 kb of proto-oncogenes as compared to zero of the dominant clones in the FV group. All of the dominant clones identified are expressed in hematopoietic cells.52
LV mouse 6 had the most severe case of clonal dominance in this study, with a dominant clone accounting for 99% of all captured RIS. Aside from clearly indicating progression towards monoclonality, the proviral integration within this clone occurred within the proto-oncogene MKL1. MKL1 is a transcriptional coactivator of serum response factor, with the translocation of MKL1 and RBM15 being a leading cause of acute megakaryoblastic leukemia.53,54 Aberrant expression of MKL1 contributes to leukemogenesis, with both up and downregulation of the gene resulting in a diseased phenotype. Overexpression of MKL1 inhibits tumor necrosis factor-induced apoptosis and activation of caspases and contributes to leukemogenesis.53 In contrast, a study done with knock-out mice by Record et al.54 showed that MKL-1-deficient mice resulted in an immunodeficient phenotype similar to acute megakaryoblastic leukemia.
The other LV dominant clones with integrations near proto-oncogenes contributed in a range from 28 to 66% of all RIS. These clones include insertions in the proto-oncogenes RPS6KA1, CYP4F22, FLT3, and MST1. RPS6KA1 encodes a ribosomal protein S6 kinase which controls cellular proliferation and differentiation and is involved in the mitogen-activated kinase signaling pathway. RPS6KA1 is upregulated in many cancers, including melanoma, prostate, and breast cancers.44,55,56 While not much is known about the function CYP4F22, it is classified as a proto-oncogene in the Network of Cancer Genes due to its expression in breast cancer tissues.44 FLT3 encodes a tyrosine-protein kinase that regulates hematopoiesis. Activating mutations and the resulting overexpression of FLT3 contribute to leukemogenesis by promoting cell proliferation and resistance to apoptosis.44,57,58 In fact, activating mutations in FLT3 are currently one of the most common aberrations in acute myeloid leukemia.58 MST1 is a central component of the Hippo pathway which is involved in cell proliferation, differentiation, and apoptosis. Low expression of MST1 has been shown to be related with the pathogenesis of acute leukemia.44,59
Integrations within the proto-oncogenes MKL1 and RPS6KA1 have been seen in other studies, including in gene therapy clinical trials. Integrations within MKL1 were observed in gammaretroviral hotspots in ex vivo transduced CD34+ cells derived from the bone marrow of a SCID-X1 patient and from ex vivo transduced CD34+ cells derived from the cord blood of an unaffected individual.13 Four independent HIV-1 integrations, some of which led to clonal expansion, occurred within MKL1 in one HIV patient sample.60 Integrations within RPS6KA1 were reported in one patient, at one time-point, as a top 20 clone in a β-thalassemia clinical trial utilizing a lentiviral vector.61 Integrations within RPS6KA1 were also reported in the HIV integration study.60 These findings emphasize the clinical relevance of our genotoxicity screen.
The increased instance of LV vector clonal dominance and the proximity of LV dominant clones to proto-oncogenes involved in leukemias highlight that FV vectors are less prone to clonal dominance and may be safer than LV vectors. It has previously been shown that FV vectors are less likely to activate nearby genes than LV vectors,16 which might provide an explanation as to why less clonal dominance was observed for the FV vector.
In polyclonal distributions, hotspots offer insight into potential problem areas for retroviral genotoxicity. In clinical trials, it may be advisable to monitor hotspots so that intervention can occur before malignant transformation takes place.62 Although a higher frequency of hotspots were found with the LV vector, an area of concern for the FV vector was a hotspot found in FV mouse one located 72 kb upstream from the proto-oncogene KDM5A. KDM5A encodes a protein that is a member of the Jumonji, AT-rich interactive domain 1 histone demethylase protein family. While the importance of KDM5 family of proteins in cancer progression is still unknown, it has been shown that KDM5A plays a role in cancer cell proliferation and the reduced expression of tumor suppressor genes.63 However, this hotspot was not associated with clonal dominance in our study.
In summary, we show that in human CD34+ SCID-repopulating cells FV vectors achieve clinically relevant engraftment and marking at a low MOI and have a favorable integration profile. Compared to LV vectors, FV vectors integrate less often near proto-oncogenes, have fewer dominant clones, and a more polyclonal repopulation. In conclusion, our data show that FV vectors compare favorably to LV vectors and further supports the use of FV vectors in HSC gene therapy.
Materials and Methods
Vector preparation
LV vector LV-RSC-SGW+KO28 and FV vector FV-SGW-KO38 have been previously described. Both vectors express EGFP from a SFFV promoter and have a woodchuck hepatitis virus post-transcriptional regulatory element and contain a kanamycin resistance gene and a bacterial origin of replication for rescue in E. coli. FV vectors were produced by transient transfection of human embryonic kidney 293 T cells (HEK-293T cells) using polyethylenimine (Polysciences, Warrinton, PA) and titered on HT1080 cells as previously described.63
Vesicular stomatitis virus G glycoprotein (VSV-G) pseudotyped LV vectors were produced by transient transfection of vector and helper plasmids with polyethylenimine on HEK-293T cells. The day before transfection, HEK-293T cells were plated in 10 cm dishes at a density of 5 × 10⁵ cells/ml in 10 ml of Hyclone Dulbecco’s modified Eagle medium (GE Healthcare Bio-Sciences, Pittsburgh, PA) supplemented with 10% heat inactivated fetal bovine serum (Atlanta Biologicals, Flowery Branch, GA) and 1% 5,000 units/ml potassium penicillin/5,000 µg/ml streptomycin sulfate (D-10 media; Lonza Walkersville, Walkersville, MD). Cells were incubated overnight at 37 °C. The following morning, media was changed. In the afternoon, 2 µg VSV-G envelope plasmid pMD2.G, 6 µg of GAG/POL helper plasmid psPAX2 and 9 µg vector plasmid LV-RSC-SGW+KO were added to 700 µl serum-free Dulbecco’s modified Eagle medium. 3 µg polyethylenimine was added for each µg of DNA. The transfection mixture was mixed thoroughly and incubated at room temperature for 15 minutes and then added to each 10 cm plate. Plates were incubated overnight at 37 °C. The following morning, media was replaced with D-10 media supplemented with 5 mmol/l 4-(2-hydroxyethyl)-1-piperazineethanesulfonic acid (HEPES) and 10 mmol/l sodium butyrate. In the afternoon, media was harvested and stored at 4 °C. Media was replaced with D-10 supplemented with 5 mmol/l HEPES and cells were incubated overnight. The following morning, media was harvested and replaced with D-10 supplemented with 5 mmol/l HEPES. A final harvest was done in the afternoon. Virus containing media was centrifuged for 5 minutes at 3,000 g to remove debris and then filtered using a 0.22 µm filter. Vectors were spun at 12,100 g, 4 °C for 20 hours and resuspended in 1/100 volume serum free Iscove’s modified Dulbecco’s medium (Invitrogen, San Diego, CA). Concentrated virus containing media was frozen at −80 °C until use. LV vectors were titered on HT1080 cells as described above except that 4 µg/ml protamine sulfate was added to each well before transduction.
Transduction of CD34+ human cord blood cells and progenitor assay
CD34+ human cord blood cells (LonzaPoietics, Basel, Switzerland) were thawed and prestimulated as previously described.35 Cells were transduced with LV vector at an MOI of 25, FV vector at an MOI of 10 or mock transduced with prestimulation media, as previously described.35 4 µg/ml protamine sulfate was added to the media of the LV arm cells at the time of transduction. Media volume in each well was adjusted to 1 ml with prestimulation media and cells were incubated for 19 hours at 37 °C. Cells were removed for transplant, liquid culture, and colony forming unit (CFU) assay as previously described.64
CD34+ human cord blood cell xenotransplants
All animal protocols were approved by the Institutional Animal Care and Use Committee of Washington State University. Prior to transplantation, 3-week-old female NOD.Cg-Prkdcscid Il2rgtm1Wjl/SzJ (NSG) mice (The Jackson Laboratory, Bar Harbor, ME) were preconditioned with busulfan (Sigma-Aldrich, St. Louis, MO). Busulfan was prepared and administered in 25 mg/kg split doses as previously described,30 except that injections were delivered 24 and 48 hours prior to transplantation. After conditioning, 1 × 10⁵ cord blood CD34+ cells were delivered by tail vein injection as previously described.64 Mouse water supplies were supplemented with the prophylactic oxytetracycline until 8 weeks post-transplant. Two mice from the FV group were excluded from analysis as a result of a failed tail vein injection of transduced CD34+ cells. One mouse from the untransduced group died and was excluded from the analysis.
Engraftment and marking analysis in peripheral blood
Peripheral blood was collected from mice by saphenous bleed at 6 weeks post-transplant and then every 3 weeks. 30–70 µl samples of whole blood were incubated with rat anti-mouse CD16/CD32 Fc block (BD Biosciences, Franklin Lakes, NJ) for 15 minutes on ice. Samples were then incubated for 30 minutes on ice with antibodies as previously described.35 Red blood cell lysis buffer was prepared according to manufacturer’s directions (Santa Cruz Biotechnology, Dallas, TX). Following staining, 2 ml red blood cell lysis buffer was added to each sample. Samples were pulse vortexed and then incubated for 5 minutes at room temperature in the dark. Immediately following lysis, 2 ml stain buffer (Dulbecco’s phosphate-buffered saline with 1% bovine serum albumin and 0.1% sodium azide, filtered .22 µm) was added to each sample. Samples were centrifuged for 5 minutes at 500 g and washed with 2 ml stain buffer. Centrifugation was repeated and samples were resuspended in 200 µl stain buffer. Resuspended samples were analyzed using a BD Accuri C6 flow cytometer (BD Biosciences). Statistical significance was determined by performing t-tests.
Engraftment and marking analysis in bone marrow and spleens
Mice were euthanized at 19 weeks post-transplantation and whole femurs and spleens were removed. Femurs were flushed with Dulbecco’s phosphate buffer saline to remove marrow. Single cell suspensions of bone marrow and spleen cells were created and processed as previously described,35 except that commercially available red blood cell lysis buffer was used as described above. Cells were counted and 2 × 10⁵ cells/staining reaction were distributed to the wells of a 96-well round bottom tissue culture plate. Cells were stained with antibodies as previously described,35 except that Phycoerythrin (PE) conjugated anti-human CD3 (Clone UCHT1), PE conjugated anti-human CD11b (Clone ICRF-44), PE conjugated anti-human CD34 (Clone 581), and PE conjugated mouse IgG1, k isotype control (Clone MOPC-21) antibodies (BD Biosciences) were also used. Cells were washed and analyzed by flow cytometry. Statistical significance was determined by performing t-tests.
Analysis of integration sites in LV and FV vector-transduced SCID-repopulating cells
Genomic DNA was extracted and processed according to the manufacturer’s directions using the Gentra Puregene Cell Kit (Qiagen, Valencia, CA). RIS from in-vivo datasets were identified and analyzed as previously described.19 VISA41 was used with the modified setting of a minimum alignment score of 100. RIS within repeats that had the same first 16 genomic nucleotides adjacent to the LTR, but aligned to different chromosomal loci, were further analyzed as follows to confirm they were in fact distinct RIS: RIS were aligned to the human genome using BLAT. RIS were excluded if percent identity was less than 97%, or could be aligned to multiple chromosomal loci with identical confidence (percent identity is greater than or equal to 97%, query length is equal to the span of the alignment). The Database for Annotation, Visualization, and Integrated Discovery 6.7 (refs. 42,43) was used for enrichment analysis as previously described.14 For hotspot analysis, FV and random RIS were normalized and matched to the smallest dataset (LV) at 460 RIS. First, all 825 FV RIS were randomized by assigning a random number to each RIS in Excel and then ordered from largest random number to smallest random number. Since there were only a total of 460 LV RIS, we analyzed the first 460 of the randomized FV RIS to normalize the datasets for hotspot analysis. Statistical significance was determined using chi-square analysis.
Analysis of vector copy number was performed through a multiplexed quantitative PCR assay using primers and probes targeting an EGFP transgene and RNase P as an internal control.64 The EGFP/EYFP assay consisted of a custom TaqMan Probe (Applied Biosystems, Grand Island, NY) containing a 5’ FAM reporter dye and a 3’ minor groove binder/nonfluorescent quencher, with primers/probe sequences as previously reported by Zhout et al. 64 The RNase P assay (Applied Biosystems) contained a probe with a 5’ Hex reporter dye. The standard curve was generated with genomic DNA extracted from HT1080 cells transduced with a single vector containing EYFP. Reactions were run in triplicate with TaqMan Genotyping Master Mix (Applied Biosystems) in a Bio-Rad CFX384 Touch under the following thermal cycling conditions: 95 °C 10 minutes + 40 × (95 °C 15 seconds + 60 °C 1 minute).64
Acknowledgments
This work was supported by the National Institute of Health Grants AI097100 and AI102672 (G.D.T).
The authors declare no conflict of interest.
References
- Mukherjee, S and Thrasher, AJ (2013). Gene therapy for PIDs: progress, pitfalls and prospects. Gene 525: 174–181. [DOI] [PMC free article] [PubMed] [Google Scholar]
- Aiuti, A, Cattaneo, F, Galimberti, S, Benninghoff, U, Cassani, B, Callegaro, L et al. (2009). Gene therapy for immunodeficiency due to adenosine deaminase deficiency. N Engl J Med 360: 447–458. [DOI] [PubMed] [Google Scholar]
- Gaspar, HB, Cooray, S, Gilmour, KC, Parsley, KL, Zhang, F, Adams, S et al. (2011). Hematopoietic stem cell gene therapy for adenosine deaminase-deficient severe combined immunodeficiency leads to long-term immunological recovery and metabolic correction. Sci Transl Med 3: 97ra80. [DOI] [PubMed] [Google Scholar]
- Candotti, F, Shaw, KL, Muul, L, Carbonaro, D, Sokolic, R, Choi, C et al. (2012). Gene therapy for adenosine deaminase-deficient severe combined immune deficiency: clinical comparison of retroviral vectors and treatment plans. Blood 120: 3635–3646. [DOI] [PMC free article] [PubMed] [Google Scholar]
- Hacein-Bey-Abina, S, Von Kalle, C, Schmidt, M, McCormack, MP, Wulffraat, N, Leboulch, P et al. (2003). LMO2-associated clonal T cell proliferation in two patients after gene therapy for SCID-X1. Science 302: 415–419. [DOI] [PubMed] [Google Scholar]
- Hacein-Bey-Abina, S, von Kalle, C, Schmidt, M, Le Deist, F, Wulffraat, N, McIntyre, E et al. (2003). A serious adverse event after successful gene therapy for X-linked severe combined immunodeficiency. N Engl J Med 348: 255–256. [DOI] [PubMed] [Google Scholar]
- Hacein-Bey-Abina, S, Garrigue, A, Wang, GP, Soulier, J, Lim, A, Morillon, E et al. (2008). Insertional oncogenesis in 4 patients after retrovirus-mediated gene therapy of SCID-X1. J Clin Invest 118: 3132–3142. [DOI] [PMC free article] [PubMed] [Google Scholar]
- Howe, SJ, Mansour, MR, Schwarzwaelder, K, Bartholomae, C, Hubank, M, Kempski, H et al. (2008). Insertional mutagenesis combined with acquired somatic mutations causes leukemogenesis following gene therapy of SCID-X1 patients. J Clin Invest 118: 3143–3150. [DOI] [PMC free article] [PubMed] [Google Scholar]
- Boztug, K, Schmidt, M, Schwarzer, A, Banerjee, PP, Díez, IA, Dewey, RA et al. (2010). Stem-cell gene therapy for the Wiskott-Aldrich syndrome. N Engl J Med 363: 1918–1927. [DOI] [PMC free article] [PubMed] [Google Scholar]
- Hematti, P, Hong, BK, Ferguson, C, Adler, R, Hanawa, H, Sellers, S et al. (2004). Distinct genomic integration of MLV and SIV vectors in primate hematopoietic stem and progenitor cells. PLoS Biol 2: e423. [DOI] [PMC free article] [PubMed] [Google Scholar]
- Laufs, S, Nagy, KZ, Giordano, FA, Hotz-Wagenblatt, A, Zeller, WJ and Fruehauf, S (2004). Insertion of retroviral vectors in NOD/SCID repopulating human peripheral blood progenitor cells occurs preferentially in the vicinity of transcription start regions and in introns. Mol Ther 10: 874–881. [DOI] [PubMed] [Google Scholar]
- Montini, E, Cesana, D, Schmidt, M, Sanvito, F, Ponzoni, M, Bartholomae, C et al. (2006). Hematopoietic stem cell gene transfer in a tumor-prone mouse model uncovers low genotoxicity of lentiviral vector integration. Nat Biotechnol 24: 687–696. [DOI] [PubMed] [Google Scholar]
- Cattoglio, C, Facchini, G, Sartori, D, Antonelli, A, Miccio, A, Cassani, B et al. (2007). Hot spots of retroviral integration in human CD34+ hematopoietic cells. Blood 110: 1770–1778. [DOI] [PubMed] [Google Scholar]
- Beard, BC, Dickerson, D, Beebe, K, Gooch, C, Fletcher, J, Okbinoglu, T et al. (2007). Comparison of HIV-derived lentiviral and MLV-based gammaretroviral vector integration sites in primate repopulating cells. Mol Ther 15: 1356–1365. [DOI] [PubMed] [Google Scholar]
- Beard, BC, Keyser, KA, Trobridge, GD, Peterson, LJ, Miller, DG, Jacobs, M et al. (2007). Unique integration profiles in a canine model of long-term repopulating cells transduced with gammaretrovirus, lentivirus, or foamy virus. Hum Gene Ther 18: 423–434. [DOI] [PubMed] [Google Scholar]
- Hendrie, PC, Huo, Y, Stolitenko, RB and Russell, DW (2008). A rapid and quantitative assay for measuring neighboring gene activation by vector proviruses. Mol Ther 16: 534–540. [DOI] [PubMed] [Google Scholar]
- Hai, M, Adler, RL, Bauer, TR Jr, Tuschong, LM, Gu, YC, Wu, X et al. (2008). Potential genotoxicity from integration sites in CLAD dogs treated successfully with gammaretroviral vector-mediated gene therapy. Gene Ther 15: 1067–1071. [DOI] [PMC free article] [PubMed] [Google Scholar]
- Li, CL, Xiong, D, Stamatoyannopoulos, G and Emery, DW (2009). Genomic and functional assays demonstrate reduced gammaretroviral vector genotoxicity associated with use of the cHS4 chromatin insulator. Mol Ther 17: 716–724. [DOI] [PMC free article] [PubMed] [Google Scholar]
- Montini, E, Cesana, D, Schmidt, M, Sanvito, F, Bartholomae, CC, Ranzani, M et al. (2009). The genotoxic potential of retroviral vectors is strongly modulated by vector design and integration site selection in a mouse model of HSC gene therapy. J Clin Invest 119: 964–975. [DOI] [PMC free article] [PubMed] [Google Scholar]
- Kustikova, OS, Schiedlmeier, B, Brugman, MH, Stahlhut, M, Bartels, S, Li, Z et al. (2009). Cell-intrinsic and vector-related properties cooperate to determine the incidence and consequences of insertional mutagenesis. Mol Ther 17: 1537–1547. [DOI] [PMC free article] [PubMed] [Google Scholar]
- Sellers, S, Gomes, TJ, Larochelle, A, Lopez, R, Adler, R, Krouse, A et al. (2010). Ex vivo expansion of retrovirally transduced primate CD34+ cells results in overrepresentation of clones with MDS1/EVI1 insertion sites in the myeloid lineage after transplantation. Mol Ther 18: 1633–1639. [DOI] [PMC free article] [PubMed] [Google Scholar]
- Liu, M, Li, CL, Stamatoyannopoulos, G, Dorschner, MO, Humbert, R, Stamatoyannopoulos, JA et al. (2012). Gammaretroviral vector integration occurs overwhelmingly within and near DNase hypersensitive sites. Hum Gene Ther 23: 231–237. [DOI] [PMC free article] [PubMed] [Google Scholar]
- Cornils, K, Bartholomae, CC, Thielecke, L, Lange, C, Arens, A, Glauche, I et al. (2013). Comparative clonal analysis of reconstitution kinetics after transplantation of hematopoietic stem cells gene marked with a lentiviral SIN or a ?-retroviral LTR vector. Exp Hematol 41: 28–38.e3. [DOI] [PubMed] [Google Scholar]
- Nowrouzi, A, Glimm, H, von Kalle, C and Schmidt, M (2011). Retroviral vectors: post entry events and genomic alterations. Viruses 3: 429–455. [DOI] [PMC free article] [PubMed] [Google Scholar]
- Nienhuis, AW, Dunbar, CE and Sorrentino, BP (2006). Genotoxicity of retroviral integration in hematopoietic cells. Mol Ther 13: 1031–1049. [DOI] [PubMed] [Google Scholar]
- Enssle, J, Trobridge, GD, Keyser, KA, Ironside, C, Beard, BC and Kiem, HP (2010). Stable marking and transgene expression without progression to monoclonality in canine long-term hematopoietic repopulating cells transduced with lentiviral vectors. Hum Gene Ther 21: 397–403. [DOI] [PMC free article] [PubMed] [Google Scholar]
- Biffi, A, Bartolomae, CC, Cesana, D, Cartier, N, Aubourg, P, Ranzani, M et al. (2011). Lentiviral vector common integration sites in preclinical models and a clinical trial reflect a benign integration bias and not oncogenic selection. Blood 117: 5332–5339. [DOI] [PubMed] [Google Scholar]
- Cesana, D, Sgualdino, J, Rudilosso, L, Merella, S, Naldini, L and Montini, E (2012). Whole transcriptome characterization of aberrant splicing events induced by lentiviral vector integrations. J Clin Invest 122: 1667–1676. [DOI] [PMC free article] [PubMed] [Google Scholar]
- Moiani, A, Paleari, Y, Sartori, D, Mezzadra, R, Miccio, A, Cattoglio, C et al. (2012). Lentiviral vector integration in the human genome induces alternative splicing and generates aberrant transcripts. J Clin Invest 122: 1653–1666. [DOI] [PMC free article] [PubMed] [Google Scholar]
- Cesana, D, Ranzani, M, Volpin, M, Bartholomae, C, Duros, C, Artus, A et al. (2014). Uncovering and dissecting the genotoxicity of self-inactivating lentiviral vectors in vivo. Mol Ther 22: 774–785. [DOI] [PMC free article] [PubMed] [Google Scholar]
- Trobridge, GD, Miller, DG, Jacobs, MA, Allen, JM, Kiem, HP, Kaul, R et al. (2006). Foamy virus vector integration sites in normal human cells. Proc Natl Acad Sci USA 103: 1498–1503. [DOI] [PMC free article] [PubMed] [Google Scholar]
- Ohmine, K, Li, Y, Bauer, TR Jr, Hickstein, DD and Russell, DW (2011). Tracking of specific integrant clones in dogs treated with foamy virus vectors. Hum Gene Ther 22: 217–224. [DOI] [PMC free article] [PubMed] [Google Scholar]
- Trobridge, GD, Horn, PA, Beard, BC and Kiem, HP (2012). Large animal models for foamy virus vector gene therapy. Viruses 4: 3572–3588. [DOI] [PMC free article] [PubMed] [Google Scholar]
- Nasimuzzaman, M, Kim, YS, Wang, YD and Persons, DA (2014). High-titer foamy virus vector transduction and integration sites of human CD34(+) cell-derived SCID-repopulating cells. Mol Ther Methods Clin Dev 1: 14020. [DOI] [PMC free article] [PubMed] [Google Scholar]
- Olszko, ME, Adair, JE, Linde, I, Rae, DT, Trobridge, P, Hocum, JD et al. (2015). Foamy viral vector integration sites in SCID-repopulating cells after MGMTP140K-mediated in vivo selection. Gene Ther 22: 591–595. [DOI] [PMC free article] [PubMed] [Google Scholar]
- Cavazzana-Calvo, M, Payen, E, Negre, O, Wang, G, Hehir, K, Fusil, F et al. (2010). Transfusion independence and HMGA2 activation after gene therapy of human ß-thalassaemia. Nature 467: 318–322. [DOI] [PMC free article] [PubMed] [Google Scholar]
- Russell, DW and Miller, AD (1996). Foamy virus vectors. J Virol 70: 217–222. [DOI] [PMC free article] [PubMed] [Google Scholar]
- Trobridge, G, Josephson, N, Vassilopoulos, G, Mac, J and Russell, DW (2002). Improved foamy virus vectors with minimal viral sequences. Mol Ther 6: 321–328. [DOI] [PubMed] [Google Scholar]
- Browning, DL, Collins, CP, Hocum, JD, Leap, D, Rae, DT and Trobridge, GD. (2015). Insulated foamy viral vectors. Hum Gene Ther (e-pub ahead of print). [DOI] [PMC free article] [PubMed]
- Rae, DT, Collins, CP, Hocum, JD, Browning, DL and Trobridge, GD (2015). Modified genomic sequencing PCR using the MiSeq platform to identify retroviral integration sites. Hum Gene Ther Methods 26: 221–227. [DOI] [PMC free article] [PubMed] [Google Scholar]
- Hocum, JD, Battrell, LR, Maynard, R, Adair, JE, Beard, BC, Rawlings, DJ et al. (2015). VISA–Vector Integration Site Analysis server: a web-based server to rapidly identify retroviral integration sites from next-generation sequencing. BMC Bioinformatics 16: 212. [DOI] [PMC free article] [PubMed] [Google Scholar]
- Huang, da W, Sherman, BT and Lempicki, RA (2009). Systematic and integrative analysis of large gene lists using DAVID bioinformatics resources. Nat Protoc 4: 44–57. [DOI] [PubMed] [Google Scholar]
- Huang, da W, Sherman, BT and Lempicki, RA (2009). Bioinformatics enrichment tools: paths toward the comprehensive functional analysis of large gene lists. Nucleic Acids Res 37: 1–13. [DOI] [PMC free article] [PubMed] [Google Scholar]
- An, O, Pendino, V, Ratti, E, Gentilini, M and Ciccarelli, FD. (2014). NCG 4.0: the network of cancer genes in the era of massive mutational screenings of cancer genomes. Database (Oxford) bau015. [DOI] [PMC free article] [PubMed] [Google Scholar]
- Wu, X, Luke, BT and Burgess, SM (2006). Redefining the common insertion site. Virology 344: 292–295. [DOI] [PubMed] [Google Scholar]
- Trobridge, GD, Wu, RA, Beard, BC, Chiu, SY, Muñoz, NM, von Laer, D et al. (2009). Protection of stem cell-derived lymphocytes in a primate AIDS gene therapy model after in vivo selection. PLoS ONE 4: e7693. [DOI] [PMC free article] [PubMed] [Google Scholar]
- Kustikova, O, Fehse, B, Modlich, U, Yang, M, Düllmann, J, Kamino, K et al. (2005). Clonal dominance of hematopoietic stem cells triggered by retroviral gene marking. Science 308: 1171–1174. [DOI] [PubMed] [Google Scholar]
- Modlich, U, Navarro, S, Zychlinski, D, Maetzig, T, Knoess, S, Brugman, MH et al. (2009). Insertional transformation of hematopoietic cells by self-inactivating lentiviral and gammaretroviral vectors. Mol Ther 17: 1919–1928. [DOI] [PMC free article] [PubMed] [Google Scholar]
- Kustikova, O, Brugman, M and Baum, C (2010). The genomic risk of somatic gene therapy. Elsevier 20: 269–278. [DOI] [PubMed] [Google Scholar]
- Fehse, B and Roeder, I (2008). Insertional mutagenesis and clonal dominance: biological and statistical considerations. Gene Ther 15: 143–153. [DOI] [PubMed] [Google Scholar]
- Haemmerle, R, Phaltane, R, Rothe, M, Schroder, S, Schambach, A and Moritz, T (2014). Clonal dominance with retroviral insertions near the ANGPT1 and ANGPT2 genes in a human xenotransplant model. Mol Ther 3: e200. [DOI] [PMC free article] [PubMed] [Google Scholar]
- Watkins, NA, Gusnanto, A, de Bono, B, De, S, Miranda-Saavedra, D, Hardie, DL et al. Bloodomics Consortium. (2009). A HaemAtlas: characterizing gene expression in differentiated human blood cells. Blood 113: e1–e9. [DOI] [PMC free article] [PubMed] [Google Scholar]
- Scharenberg, MA, Chiquet-Ehrismann, R and Asparuhova, MB (2010). Megakaryoblastic leukemia protein-1 (MKL1): Increasing evidence for an involvement in cancer progression and metastasis. Int J Biochem Cell Biol 42: 1911–1914. [DOI] [PubMed] [Google Scholar]
- Record, J, Malinova, D, Zenner, HL, Plagnol, V, Nowak, K, Syed, F et al. (2015). Immunodeficiency and severe susceptibility to bacterial infection associated with a loss-of-function homozygous mutation of MKL1. Blood 126: 1527–1535. [DOI] [PMC free article] [PubMed] [Google Scholar]
- Slattery, ML, Lundgreen, A, Herrick, JS and Wolff, RK (2011). Genetic variation in RPS6KA1, RPS6KA2, RPS6KB1, RPS6KB2, and PDK1 and risk of colon or rectal cancer. Mutat Res 706: 13–20. [DOI] [PMC free article] [PubMed] [Google Scholar]
- Fernández-Medarde, A and Santos, E (2011). Ras in cancer and developmental diseases. Genes Cancer 2: 344–358. [DOI] [PMC free article] [PubMed] [Google Scholar]
- Naoe, T and Kiyoi, H (2004). Normal and oncogenic FLT3. Cell Mol Life Sci 61: 2932–2938. [DOI] [PubMed] [Google Scholar]
- Levis, M and Small, D (2003). FLT3: ITDoes matter in leukemia. Leukemia 17: 1738–1752. [DOI] [PubMed] [Google Scholar]
- Barron, DA and Kagey, JD (2014). The role of the Hippo pathway in human disease and tumorigenesis. Clin Transl Med 3: 25. [DOI] [PMC free article] [PubMed] [Google Scholar]
- Maldarelli, F, Wu, X, Su, L, Simonetti, FR, Shao, W and Hill, S. (2014). Specific HIV integration sites are linked to clonal expansion and persistence of infected cells. Science 345: 179–183. [DOI] [PMC free article] [PubMed] [Google Scholar]
- Leboulch, P. (2013). Five year outcome of lentiviral gene therapy for human beta-thalassemia, lessons and prospects. Thalassemia Reports 3: 43. [Google Scholar]
- Siler, U, Paruzynski, A, Holtgreve-Grez, H, Kuzmenko, E, Koehl, U, Renner, ED et al. (2015). Successful combination of sequential gene therapy and rescue allo-HSCT in two children with X-CGD - importance of timing. Curr Gene Ther 15: 416–427. [DOI] [PubMed] [Google Scholar]
- Torres, IO, Kuchenbecker, KM, Nnadi, CI, Fletterick, RJ, Kelly, MJ and Fujimori, DG (2015). Histone demethylase KDM5A is regulated by its reader domain through a positive-feedback mechanism. Nat Commun 6: 6204. [DOI] [PMC free article] [PubMed] [Google Scholar]
- Zhou, S, Mody, D, DeRavin, SS, Hauer, J, Lu, T, Ma, Z et al. (2010). A self-inactivating lentiviral vector for SCID-X1 gene therapy that does not activate LMO2 expression in human T cells. Blood 116: 900–908. [DOI] [PMC free article] [PubMed] [Google Scholar]
Associated Data
This section collects any data citations, data availability statements, or supplementary materials included in this article.