

Abstract
In this work, an emulsion crosslinking method was developed to produce chitosan-genipin microgels which acted as an injectable and microporous scaffold. Chitosan was characterized with respect to pH by light scattering and aqueous titration. Microgels were characterized with swelling, light scattering, and rheometry of densely-packed microgel solutions. The results suggest that as chitosan becomes increasingly deprotonated above the pKa, repulsive forces diminish and intermolecular attractions cause pH-responsive chain aggregation; leading to microgel-microgel aggregation as well. The microgels with the most chitosan and least cross-linker showed the highest yield stress and a storage modulus of 16 kPa when condensed as a microgel paste at pH 7.4. Two oppositely-charged growth factors could be encapsulated into the microgels and endothelial cells were able to proliferate into the 3D microgel scaffold. This work motivates further research on the applications of the chitosan microgel scaffold as an injectable and microporous scaffold in regenerative medicine.
Keywords: Chitosan, microgel, injectable, scaffold, regenerative medicine
1. Introduction
Hydrogels, which are water-swollen crosslinked polymer networks, have been widely explored as injectable biomaterials due to their ability to act as both cellular scaffolds and drug delivery systems.(Bae, Wang & Kurisawa, 2013; Hoare & Kohane, 2008; Kretlow, Klouda & Mikos, 2007; Lin & Anseth, 2009; Nguyen & Alsberg, 2014) Many types of injectable hydrogels, including those with stimuli-responsive physical or chemical gelation, have the potential to be delivered in a minimally-invasive manner.(Bhattarai, Ramay, Gunn, Matsen & Zhang, 2005; Jeon, Powell, Solorio, Krebs & Alsberg, 2011) However, most injectable hydrogels are not microporous and require enzymatic or hydrolytic degradation prior to cellular infiltration.(Lin & Anseth, 2009; Zhu & Marchant, 2011) One approach to create an injectable, microporous scaffold is to condense microparticle hydrogels, microgels, into a scaffold so cells can migrate through the void spaces.(García Cruz et al., 2008; Griffin, Weaver, Scumpia, Di Carlo & Segura, 2015) These concentrated microgel solutions exhibit large viscosities, shear-thinning behavior, and yield stresses(Ketz, Prud'homme & Graessley); properties that are ideal for localized, surgical injections.(Beck et al., 2015; Koetting, Peters, Steichen & Peppas, 2015; Wang, Leeuwenburgh, Li & Jansen, 2011)
Chitosan is a pH-responsive polysaccharide, composed of glucosamine (GlcN) and N-acetylglucosamine (GlcNAc) units, which has been widely used in tissue engineering applications.(Muzzarelli, 2009; Rinaudo, 2006) Due to the weakly basic activity of GlcN, chitosan is soluble in dilute acidic solutions but becomes insoluble near pH 7.0 due to intermolecular hydrogen bonding and hydrophobic interactions.(Schatz, Pichot, Delair, Viton & Domard, 2003) Hydrogels and microparticles of chitosan have been widely used in drug delivery and often utilize the ability of chitosan to ionically and physically crosslink.(Agnihotri, Mallikarjuna & Aminabhavi, 2004; Bhattarai, Gunn & Zhang, 2010; Sinha et al., 2004; Skop, Calderon, Levison, Gandhi & Cho, 2013) However, these hydrogels are typically nano-porous and limit cellular infiltration.(Mekhail & Tabrizian, 2014) Chitosan microparticles can provide a porous scaffold where cells proliferate within the void spaces(García Cruz et al., 2008), but a microporous chitosan microgel scaffold appropriate for localized surgical injections which is stable at physiological pH has not been demonstrated.
For protein release from covalently crosslinked chitosan hydrogels, post-fabrication encapsulation is beneficial to reduce undesirable conjugation.(Solorio, Zwolinski, Lund, Farrell & Stegemann, 2010; Yuan et al., 2007; Zhang, Zhu, Wang & Ding, 2005) The small size of microgels provides high surface-area-to-volume ratio, allowing rapid loading of drugs post-fabrication.(Malmsten, Bysell & Hansson, 2010) Chitosan has been used to encapsulate a wide range of proteins.(Muzzarelli, 2009) However, the post-fabrication encapsulation of proteins into chitosan-genipin microgels has not been commonly applied. Chitosan is often modified to provide increased affinity between polymer and drug, but this can result in microparticles with limited degradation.(Skop, Calderon, Levison, Gandhi & Cho, 2013) While genipin has been used to externally crosslink chitosan microparticles by soaking, this can lead to heterogeneous and dense crosslinking which limits lysosomal degradation.(Skop, Calderon, Levison, Gandhi & Cho, 2013; Yuan et al., 2007) In this work, we use the slow reaction kinetics of genipin to mix polymer and crosslinker prior to emulsification and form uniformly crosslinked microgels.
We hypothesized that a scaffold consisting of chitosan microgels which are densely packed can provide a microporous gel which maintains stability at physiological conditions due to microgel-microgel attractions and thus allows cellular infiltration. To understand factors which influence such a chitosan scaffold at the material and cellular levels, six different formulations of chitosan microgels were fabricated. The swelling of the microgels was studied with respect to pH and ionic strength, and the microgels encapsulated two oppositely-charged(Bergmann, Holz & Kopitz, 2011) isoforms of vascular endothelial growth factor (VEGF): VEGF121 and VEGF165. Mechanical properties of the condensed microgels were assessed to develop a gel which would remain stable in physiological saline buffer. The ability for endothelial cells to interact with the VEGF-loaded microgels was examined through a metabolic assay and confocal fluorescent imaging. The work presented here shows that chitosan microgels can be sufficiently condensed into an injectable scaffold and motivates further research on this scaffold for tissue engineering.
2. Experimental Section
2.1 Materials
Chitosan (CS) (“medium molecular weight”, 84.1% deacetylation) was purchased from Sigma-Aldrich (St. Louis, MO) and purified as described below. HEPES, Span 80 (sorbitan monooleate), and Tween 20 (polyethylene glycol sorbitan monolaurate) were purchased from Sigma-Aldrich and used as received. Genipin (Wako Chemicals USA; Richmond, VA), recombinant human VEGF165 (R&D Systems; Minneapolis, MN), recombinant human VEGF121 (Peprotech; Rocky Hill, NJ), Dulbecco‖s phosphate buffered saline (DPBS, HyClone; Logan, UT) and CellTracker Green 5-chloromethylfluorescein diacetate (CMFDA) dye (Thermo Fisher Scientific; Waltham, MA) were used as received. Anti-VEGF ELISA development kits (Peprotech), lysozyme (Thermo Fisher Scientific) and PrestoBlue Cell Viability Reagent (Thermo Fisher Scientific) were used as provided. Pooled-donor Human Umbilical Vein Endothelial Cells (HUVECs) isolated in media without exogenous VEGF, endothelial basal media (EBM), and endothelial growth media (EGM) were purchased from Lonza (Walkersville, MD). Ultrapure deionized water (diH2O) was generated with a Milli-Q filtration system (EMD Millipore; Billerica, MA). PureCol collagen (3 mg/mL) was purchased from Advanced BioMatrix (San Diego, CA). Polytetrafluoroethylene (PTFE) release agent (MS-122AD) was generously provided by Miller-Stephenson (Morton Grove, IL).
2.2 Chitosan irradiation and purification
CS was irradiated (I-CS) to 5 Mrad total dose at 220 krad / hr with Cobalt-60 irradiation (Michigan Memorial Phoenix Project, Univ. of Michigan, USA). CS and I-CS were purified separately by dissolving 10 g in 1 L of 1% acetic acid solution, followed by vacuum filtration through a 2.7 μm cellulose paper filter (GE Healthcare, Marlborough, MA) and a 0.45 μm PES membrane filter (Thermo Scientific). The solution was dialyzed (MWCO 3500; Fisher Scientific) for 4 days against diH2O before the retentate was adjusted to pH 8.0 with 1 M NaOH and the polymer was separated by centrifugation (4000 ×g, 5min). The pellet was repeatedly resuspended in diH2O and centrifuged until the supernatant was less than pH 7.2. The purified CS and I-CS were then lyophilized and stored in a desiccator prior to use.
2.3 Polymer characterization
CS and I-CS were dissolved in 0.5 M acetic acid / 0.2 M sodium acetate buffer (pH 4.2) at concentrations between 0.8 and 10 mg/mL and intrinsic viscosity was measured with an Ubbholde viscometer (Schott-Gerate, No. II; Mainz, Germany). Mark-Houwink Parameters (K = 3.5×10⁻⁴ and a = 0.76) were applied to determine molecular weight.(Terbojevich, Cosani & Muzzarelli, 1996) Fourier Transform Infrared (FTIR) spectroscopy was performed on CS and I-CS using a Nicolet NEXUS 470 FTIR (Thermo) equipped with a Specac Attenuating Total Reflectance (ATR) attachment (Golden Gate; Kent, UK). Potentiometric titrations of CS and I-CS were performed by dissolving 50 mg in 50 mL of 10 mM HCl / 1 mM NaCl and titrating with 0.101 M NaOH. Light transmittance measurements at 600 nm on CS and I-CS solutions (1 wt%) were performed at pH 6.0, 6.8, 7.4, and 8.0 (n = 3) using a UV-Vis spectrophotometer (Genesys 10S, Thermo Scientific).
2.4 Microgel production
Chitosan/genipin (CS/GP) microgels were formed by an in situ emulsion crosslinking method (recipes shown in Table 1).
Table 1.
Recipes for CS/GP microgels
| Condition | CS (g) |
I-CS (g) |
Acetic acid | GP (μmol) |
Ethanol (mL) |
|---|---|---|---|---|---|
| CS-2/GP-5 | 0.2 | 0 | 10 mL, 0.5 % | 50 | 0.5 |
| CS-4/GP-5 | 0.2 | 0.2 | 10 mL, 1.0 % | 50 | 0.5 |
| CS-6/GP-5 | 0.2 | 0.4 | 10 mL, 1.5 % | 50 | 0.5 |
| CS-2/GP-25 | 0.2 | 0 | 10 mL, 0.5 % | 250 | 0.5 |
| CS-4/GP-25 | 0.2 | 0.2 | 10 mL, 1.0 % | 250 | 0.5 |
| CS-6/GP-25 | 0.2 | 0.4 | 10 mL, 1.5 % | 250 | 0.5 |
CS was dissolved at 2, 4, or 6 wt% into 10 mL of 0.5% acetic acid solution by magnetic stirring overnight in a closed container. GP solution (100 or 500 mM; 0.5 mL in ethanol) was added dropwise into the stirring chitosan and allowed to mix for 5 mins. The CS/GP mixture was emulsified by stirring in 90 mL of 5% Span 80 in mineral oil and homogenizing at 6000 RPM for 5 mins (PROScientific). The emulsion was stirred at 650 RPM for 18 hrs in a 40 °C water bath. Then the microgel emulsion was separated to 25 mL aliquots and centrifuged (2000 xg, 5 min) to remove the mineral oil phase. The pellet aliquots were further washed by consecutive centrifugation (2000 ×g, 5 min) and resuspension of the pellet in 40 mL the following: hexane, 50% ethanol in diH2O containing 1% Tween 20, and diH2O (5 times). The microgels were then stored in excess diH2O at 4 °C. Prior to experiments, a 1:1 microgel dilution was prepared by mixing 1 mL diH2O per gram hydrated microgel pellet (2000 ×g, 5 min).
2.5 Microgel characterization
To measure CS/GP microgel diameters, 100 μL of each 1:1 microgel dilution was mixed with 1 mL of diH2O and imaged with a fluorescent microscope (Nikon TE-2000S) at an excitation wavelength (λex) of 560 nm and emission wavelength (λem) of 645 nm. Image processing software (Analyze Particles, ImageJ; NIH) was used with automatic thresholds to calculate particle diameters from the area of circular, non-aggregated particles (n = 90, circularity: 0.3-1).
To measure zeta potential of colloidally-stable microgel fragments, 450 μL of 1:1 microgel dilution was suspended in 4.05 mL of diH2O and sonicated for 1 min with a micro-tipped cell disruptor (Branson). The microgel dispersion was separated into equal aliquots (n = 4) and centrifuged (100 ×g, 1 min). The supernatant was then centrifuged again (10,000 ×g, 1 min) and the pellet suspended in 20 mM potassium phosphate buffer / 5 mM KCl to produce a particle suspension. The zeta potential was measured with a ZetaPALS Potential Analyzer (Brookhaven Instruments; Holtsville, NY) and determined through the Smoluchowski approximation.
Volumetric swelling ratios of the densely packed microgel pellets were determined by centrifuging 1 mL of 1:1 microgel dilution (2000 ×g, 5min). The aqueous supernatant was removed via pipette and the mass of hydrated microgel pellet was measured. The dry mass was taken again after drying at 37 °C for 1 week. The volumetric swelling ratio, QV, was determined from mass swelling ratio as previously described(Lin & Metters, 2006):
| (1) |
Where v2 is the polymer volume fraction, Vg is the volume of the gel, Vp is the polymer volume, Qm is the mass swelling ratio (mass wet gel / mass dry gel – 1), ρ1 is the density of water (1 g/cm3), and is the specific volume of chitosan ( = 0.58 cm3 / g)(Errington, Harding, Vårum & Illum, 1993).
To measure de-swelling of microgels in response to ionic strength and pH, 20 μL of 1:1 microgel dilution was pipetted onto a glass slide and allowed to sit for 1 min before rinsing off non-adsorbed microgels and rehydrating with 20 μL of diH2O. The adsorbed microgels were imaged at 10x using a phase-contrast microscope (Motic AE2000). Next, 200 μL of aqueous 20 mM HEPES (pH 6.0, 6.8, 7.4, or 8.0; with or without 150 mM sodium chloride) was pipetted onto the slide and the identical microgels were imaged again after 1 min of equilibration. ImageJ was used to fit circles to the microgel images and volume calculated from the particle area. The de-swelling response V/Vo was calculated by taking the ratio of the microgel volume in HEPES buffer (V) to that in diH2O (Vo).
2.6 Rheological shear rate sweeps
Dense microgel pellets were prepared by centrifuging (2000 ×g, 5 min) 1 mL of 1:1 microgel dilution in diH2O and loading into a 3 mL polypropylene syringe with care taken to prevent air bubbles. Microgel pellet (350 μL) was injected through a 22-gauge needle onto the Peltier plate of an AR-G2 rheometer at 25 μC (TA Instruments; New Castle, DE). A 20 mm parallel plate was immediately brought onto the sample (gap height 1 mm) and a solvent-trap containing diH2O was placed. The sample was sheared at 5 Pa for 10 sec and equilibrated at zero shear for 30 sec prior to measurement. Continuous flow shear rate sweeps were performed from 66 to 0.1 s−1 with a test duration of 4 mins. Additionally, oscillatory strain and frequency sweeps were performed on densely-packed CS-6/GP-5 microgels after adjusting to pH 7.4 with 0.1 M potassium phosphate buffer (10 mL of 1:1 dilution with 40 mL of buffer) and centrifuging (2000 ×g, 5min). The pellet was then blotted with gauze for 10 seconds and loaded between two parallel plates as described. Rheological tests were performed at 25 °C with strain sweep at a constant frequency of 1 Hz, and frequency sweep at constant 1% strain. This hydrogel was also imaged after injection into a well of a 12-well plate and incubation in DPBS for 3 days (Figure 2).
Figure 2.

Procedure to create chitosan-genipin microgels and condense into an injectable microgel-based scaffold for cell culture. Images show CS-6/GP-5 microgels (blue) and CellTracker stained HUVECs (green) at 6 × 10⁶ cells per mL after 7 days of mixed culture.
2.7 Lysozyme degradation
In a 1.5 mL microcentrifuge tube, 400 μL of 1:1 microgel dilution and 1 mL of DPBS with or without lysozyme (0.5 mg/mL) were combined (n = 3). The tubes were mixed by tapping/inversion and incubated at 37 °C in a hybridization oven with rotation (6 RPM). At day 0 and day 28, the tubes were centrifuged (2000 ×g, 5 min) and the supernatant was removed. These tubes were air dried (37 °C) and the dry mass of the microgel pellet was measured. The degradation ratios were calculated by m / mo where m is the microgel mass on day 28 and mo is the average microgel mass on day 0.
2.8 VEGF loading and release experiments
To load microgels with VEGF, 400 μL of 1:1 microgel dilution was combined with 1 mL of 20 mM HEPES (pH 6.8) and then 200 ng of VEGF121 or VEGF165 in 20 μL diH2O was added (n = 4). Negative controls without VEGF were also prepared. The solutions were mixed by inversion and incubated at 4 °C for 2 days to load VEGF. After loading, the microgels were centrifuged (2000 ×g, 5 min) and amount of VEGF encapsulated was measured through ELISA of the supernatant. The mass of VEGF ‘loaded’ at pH 6.8 was determined from the following: 200 ng VEGF total – mass VEGF in supernatant. Next, 1 mL of 20 mM HEPES at pH 7.4 was added to the loaded microgel pellet to adjust the pH. The tubes were mixed well by vortexing and centrifuged again (2000 ×g, 5 min). The mass of VEGF in the supernatant was then determined with ELISA and defined as the amount of VEGF ‘washed’. Encapsulation efficiency was calculated based on the protein which was loaded at pH 6.8, but not washed away at pH 7.4, normalized to the total amount of VEGF available; as follows:
| (2) |
Release of encapsulated VEGF from the microgels was performed by adding 1 mL of DPBS to the washed microgel pellet and mixing well. Release temperature was controlled at 37 °C and microfuge tubes were rotated in a hybridization oven (6 RPM). At defined time points (1 hour, 1 day, 3.5 days, 1 weeks, 2 weeks, 3 weeks, and 4 weeks), the tubes were centrifuged (2000 ×g, 5 min) in a swinging bucket centrifuge and the supernatant removed for storage at −20 °C. Microgels were resuspended in 1 mL of DPBS prior to continued incubation. A sandwich ELISA was used to measure protein concentration according to the manufacturer’s instructions and standard curves were made for both VEGF121 and VEGF165. Appropriate dilutions were prepared to measure VEGF concentrations in release samples.
The Coulombic surface charges of two RCSB Protein Data Bank (PDB) entries, 2VPF(Muller, Christinger, Keyt & de Vos, 1997) and 2VGH(Fairbrother, Champe, Christinger, Keyt & Starovasnik, 1998), were visualized using UCSF Chimera(Pettersen EF, 2004).
2.9 Relative metabolic activity of HUVECs
Microgels (CS-6/GP-5 and CS-6/GP-25) were sterilized by suspending a microgel pellet (10 mL, 2000 ×g, 5 min) in ethanol (30 mL) and soaking for 2 hours. Ethanol was decanted after centrifuging (500 ×g, 5 min) and the microgels were washed 5 times with sterile diH2O (30 mL) by centrifugation (2000 ×g, 5 min) and resuspension of the pellet. At the final wash, pelleted spheres were suspended in three times their volume of 20 mM HEPES at pH 6.8 with or without 250 ng / mL VEGF (VEGF121 or VEGF165). The spheres were loaded at 4 °C for 2 days. The microgels were centrifuged (2000 ×g, 5 min) and the supernatant was replaced with an equal volume of 20 mM HEPES at pH 7.4 to create a 1:4 microgel dilution.
The wells of six 96-well plates (Nunc, black polystyrene; Thermo Fisher) were coated with a collagen layer by incubating with collagen solution and neutralizing with sterile DPBS. HUVECs were plated at a seeding density of 2,500 cells / cm2 with 200 μL of EGM and incubated at 37 °C in a humid environment with 5 % CO2. Media was replaced every 2 days with 200 μL EGM. After 4 days of HUVEC culture, media was replaced with 150 μL of EGM and then treated with 50 μL of the 1:4 VEGF-loaded microgel dilution.
After microgel addition, culture media was replaced every 2 days with 200 μL of EGM. At days 1, 3.5, and 7, PrestoBlue (10 vol%) was added to the media of the 96-well plates (n = 6 wells per time point) and incubated at 37 °C for 10 hrs before measurement of relative fluorescence units (RFU) using a plate reader (λEx: 560nm and λEm: 590nm; Synergy H1; BioTek, VT). In addition to blanks, positive controls (‘cells + microgel/VEGF + media’) were prepared by culturing HUVECs in EGM with VEGF (5 ng/mL) but without microgels. The relative metabolic activity was calculated using the following:
| (3) |
2.10 Interaction of HUVECs with chitosan microgels
Glass-bottomed dishes (Nunc, 35mm) were coated with collagen (PurCol) and HUVECs were plated at a density of 2,500 cells/cm2 with 2 mL of EGM media; the media was changed every 2 days. After 4 days of culture, media was exchanged with 1.5 mL serum-free EBM and 10 μM CellTracker Green and incubated for 45 mins. Media was then replaced with 1.5 mL EGM media and 0.5 mL of the 1:4 CS-6/GP-5 microgel dilution containing VEGF165. Microgel-loaded dishes were centrifuged (200 ×g, 5 min) to pellet microgels onto the HUVECs and media was replaced with 2 mL of EGM. The dishes were imaged after 1 and 3 days of incubation (37 °C, 5% CO2) using a confocal microscope (Fluoview FV10i, Olympus) at blue (λEx: 405 nm; λEm: 430 nm) and green light emission (λEx: 473 nm; λEm: 519 nm) settings.
2.11 Statistical analysis
Values shown are mean ± standard deviation unless otherwise noted. GraphPad Prism software was used to conduct all statistical analysis. Significance was determined using Tukey’s multiple comparisons test and a 95% confidence interval (significant when p < 0.05).
3. Results and Discussion
3.1 Polymer characterization
CS was irradiated by gamma irradiation to enable fabrication of hydrogels up to 6 wt% polymer by incorporation of a lower molecular weight chitosan (I-CS) with similar chemical properties. Potentiometric titrations of CS and I-CS with dilute NaOH showed a weakly basic activity and a buffering range between pH 5 and 7 (Figure 1A). The degree of dissociation (α) was determined as previously described for chitosan(Sorlier, Denuzière, Viton & Domard, 2001) and the pKa was determined to be 6.1 for both CS and I-CS at α= 0.5 (Figure 1A inset). FTIR spectroscopy showed similar spectra for CS and I-CS (Figure 1B) and the degree of deacetylation was 84.1% as provided by Sigma-Aldrich. Both CS and I-CS were pH-responsive with reduced solubility at pH 7.4 and 8.0 as determined by reduced visible light transmittance (Figure 1C). Together, the potentiometric titration and transmittance data suggest that as NH3+ groups of GlcN become increasingly deprotonated to NH2 above the pKa, repulsive forces diminish and lead to intermolecular aggregation. These attractive forces have been attributed to hydrogen bonding and hydrophobic interactions of the GlcN and GlcNAc residues.(Schatz, Pichot, Delair, Viton & Domard, 2003) Dilute solution viscometry resulted in molecular weight calculations of 143 ± 10 kDa and 30 ± 9 kDa for the CS and I-CS, respectively (Figure 1D). It is concluded that irradiation of chitosan decreases molecular weight while preserving pH-responsive behavior.
Figure 1.
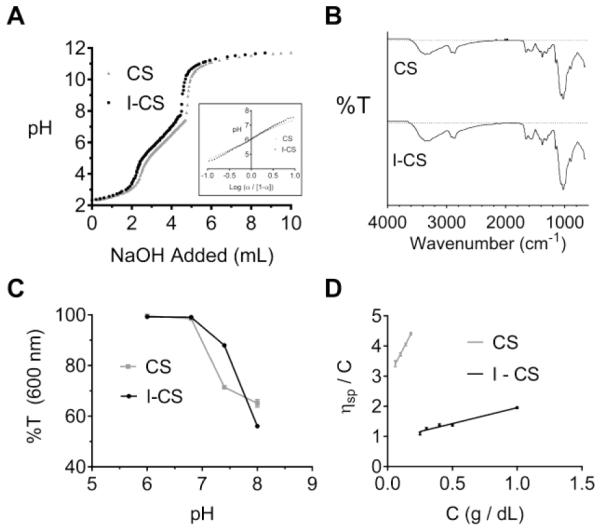
(A) Potentiometric titration curves of chitosan (CS) and irradiated chitosan (I-CS); dissociation plot for pKa determination (inset). (B) ATR-FTIR transmittance plot for CS and I-CS. (C) Light transmittance measurements of CS or I-CS solutions (1 mg/mL) at 600 nm as a measure of aqueous solubility. (D) Dilute solution viscometry measurements for intrinsic viscosity determination to be used in the Mark-Houwink equation for molecular weight determination.
3.2 Microgel production and characterization
The in situ emulsion crosslinking method developed here was used to produce six formulations of chitosan microgels. As depicted in Figures 2, S1A and S1C, genipin and chitosan could be homogeneously mixed prior to homogenization and subsequently crosslinked as a stable emulsion. After removing the oil phase of the emulsion, the microgels could be adjusted to pH 7.4 and condensed into a shear-thinning fluid. This fluid could then be injected into PBS and remain stable for cell culture. The lower crosslinker content (GP-5) produced consistently larger diameter microgels for all polymer contents, with a higher swelling ratio as well (Figure S1B). The dense-packing by centrifugation of the spherical, hydrated microgels created irregular and tortuous pores which were approximately 10 μm in diameter for the CS-6/GP-5 microgels, as visualized by three dimensional reconstruction of confocal z-stacks (Figure S2). Scanning electron photomicrographs of lyophilized microgels demonstrate that they maintain a spherical structure (Figure S3). Genipin-crosslinking produced blue coloration of the microgels which was more intense for the GP-25 microgels (Figure S1D). The centrifuged microgel pellets were visibly homogeneous and able to flow through pipettes and syringe needles.
In contrast to methods where phase separated microparticles are soaked in a genipin-containing bath,(Skop, Calderon, Levison, Gandhi & Cho, 2013; Yuan et al., 2007) or two-component emulsion methods,(Kamiński, Zazakowny, Szczubiałka & Nowakowska, 2008) the method described here can produce microgels with homogenous crosslinking due to complete mixing of chitosan and genipin prior to gelation. Furthermore, the blue color, which is believed to be due to oxygen radical-induced genipin crosslinking,(Butler, Ng & Pudney, 2003) is useful as a fluorescent probe in visualizing microgel interactions.
3.3 Microgel Responsiveness to pH and Ionic Strength
These CS/GP microgels were highly responsive to both pH and ionic strength (Figure 3A). In general, the microgels containing less genipin (GP-5) exhibited larger volume transitions, consistent with a lower crosslinking degree than GP-25 microgels. In all cases, the largest de-swelling responses occurred at pH 8.0 or with the addition of 150 mM NaCl. The swelling response results from ionic repulsion between protonated NH3+ groups and de-swelling occurs as these groups are de-protonated or screened with counterions.
Figure 3.

Microgel responsiveness to pH and ionic strength. (A) Volume de-swelling transitions measured by phase contrast imaging in 20 mM HEPES at pH 6.0, 6.8, 7.4, and 8.0 (pH values are left to right, white to dark gray) with or without 150 mM NaCl. (B) Phase contrast image of CS-4/GP-5 microgel in diH2O and in 20 mM HEPES at pH 8.0; scale bars: 10 μm. (C) Zeta potential measurements of microgels as a function of pH. Values are mean ± standard deviation.
The CS-4/GP-5 microgels exhibited the largest de-swelling response at pH 8.0 (−NaCl), shrinking 73% by volume. The largest de-swelling response for the more crosslinked microgels was observed for the CS-6/GP-25 microgels, reducing in size by 28% at pH 8.0 (−NaCl). When 150 mM of NaCl was added, the microgels became collapsed at all pH values and were pH-responsive to a lesser degree. Thus, the microgels would be highly collapsed in vivo due to the physiological pH (i.e. 7.4) and ionic strength. Zeta potential measurements show a positive potential for all conditions at pH 6.0 and a decreasing potential as pH increases (Figure 3C). At pH 7.4, the GP-5 microgels showed a slightly positive potential of 2.1 ± 3.4 mV and the GP-25 microgels were nearly neutral at −0.8 ± 3.4 mV. A negative potential has been reported before in genipin-crosslinked nanogels(Arteche Pujana, Pérez-Álvarez, Cesteros Iturbe & Katime, 2013) and could possibly result from carboxyl functionalization of polymerized genipin(Mi, Shyu & Peng, 2005).
3.4 Rheology of concentrated microgel solutions
The shear-thinning and yielding behaviors of the microgel pellets were characterized through continuous flow and oscillatory rheology (Figure 4). The concentrated microgel solutions could be extruded through a 22-gauge needle and remain localized (Figure 2), which is relevant for medical applications. Apparent yield stresses for dispersions were determined by fitting the data in Figure 4A to the equation for Herschel-Bulkley fluids:
Figure 4.

Rheometry of densely-packed microgel solutions. (A&B) Microgel pellet in diH2O for determination of shear-thinning behavior using the Herschel-Bulkley equation (red line is the fit below 20 s−1). (C&D) Oscillatory strain and frequency sweep of condensed CS-6/GP-5 microgel pellet at pH 7.4.
| (4) |
The highest yield stress (τo) calculated using Equation 4 was 5.3 ± 0.3 Pa for the CS-6/GP-5 microgels and a yield stress of 2.4 ± 0.2 Pa was observed for the CS-4/GP-5 microgels. The remaining microgel suspensions did not exhibit yield stresses above 0.04 Pa. The GP-5 microgels exhibited a Herschel-Bulkley n parameter which was 0.56 to 0.68, indicating shear-thinning behavior. The GP-25 microgels exhibited n values between 0.75 and 0.99 which indicate less shear-thinning. Increased variability was seen at low shear rates for the CS-4/GP-25 microgels and this is possibly due to hydrophobic aggregations caused by the increased genipin content.
The plot of viscosity versus shear stress for the microgels in diH2O (Figure 4B) shows that the GP-5 microgel dispersions exhibited more shear-thinning behavior (negative slope) than GP-25 gels. As reported by Adams et al.(Adams, Frith & Stokes, 2004) on concentrated agar microgel solutions, increased packing density has a large effect on shear-thinning behavior of concentrated microgels. Reduced packing of the more crosslinked GP-25 microgels could be due to a harder microgel with less deformation when centrifuged, leading to less shear-thinning behavior. The CS-6/CP-5 microgels exhibit the most shear-thinning behavior, possibly due to increased polymer content and chain entanglement. When microgels were adjusted to pH 7.4 with DPBS and condensed by removal of excess water, the inter-microgel interactions create a gel with a storage modulus (G’) of 16.4 ± 0.4 kPa and loss modulus of 1.6 ± 0.1 kPa in the linear viscoelastic region (Figure 4C). The mechanical strength arises from attractive chitosan-chitosan interactions at pH 7.4 because this is a poor solvent and causes chitosan to aggregate. These interactions arise due to hydrogen bonding of GlcN residues and hydrophobic attractions between GlcNAc residues. These interactions manifest on the microscale to create aggregated microgels which are stable in DPBS and remain so after 3 days of incubation (Figure 2). When disrupted with a spatula after incubation, the scaffold was observed to fall apart when large stresses were applied. Therefore, this scaffold is ideally suited for packing into confined spaces or in conjunction with a biomedical glue to improve stability in the dynamic environment of the human body.
3.5 Lysozyme degradation of microgels
The microgels were tested for degradation over a period of 28 days by incubating in PBS with or without lysozyme. Solutions without lysozyme did not significantly degrade microgels (Figure 5A), while the solution of non-replenished lysozyme (0.5 mg/mL) was able to degrade all microgels except for the CS-4/GP-25 microgels (Figure 5B). The fastest degrading microgels were the CS-4/GP-5 which degraded 60% by mass. In general, the lower crosslinker content (GP-5) led to a more complete degradation by lysozyme. As opposed to previously developed chitosan microparticles for tissue engineering,(Skop, Calderon, Levison, Gandhi & Cho, 2013) the microgels produced here show more degradation at day 28 with a lower lysozyme concentration. This underscores the significance of this newly-developed fabrication method to produce novel degradable microgels for tissue engineering.
Figure 5.
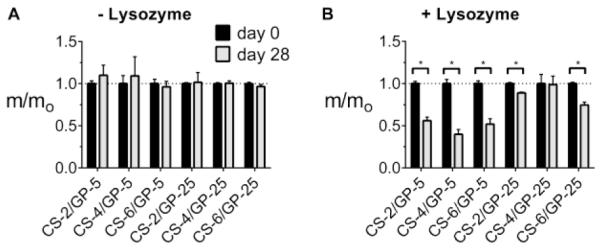
Degradation of CS/GP microgels after incubation in (A) PBS or (B) PBS with lysozyme. Average dry masses ± standard deviation are shown at both day 0 (black) and day 28 (gray), with masses at day 28 normalized to the day 0 average. * denotes significance between time points.
3.6 Loading and release of VEGF
A post-fabrication approach was used to load either VEGF121 (pI ~ 4.5)(Bergmann, Holz & Kopitz, 2011) or VEGF165 (pI ~ 8.0)(Bergmann, Holz & Kopitz, 2011) into the microgels. The loading was performed in 20 mM HEPES at pH 6.8 because this was near the soluble/insoluble transition of CS (Figure 1C), but the microgels still remained partially swollen (Figure 3). As shown in Figure 6A, all microgels were able to completely load (99.9 ± 0.3 %) VEGF121 at pH 6.8. However, upon adjusting pH to 7.4, the GP-5 microgels released up to 19% of the loaded protein. The more crosslinked GP-25 microgels did not release significant amounts of VEGF121 upon pH-adjustment to 7.4. For VEGF121, the encapsulation efficiencies of the GP-5 microgels on average was determined (using Equation 2) to be 84.5 ± 5.8%, while for the GP-25 microgels it was 100 ± 0.1%. The more positively charged isoform, VEGF165, was not completely loaded into the microgels (Figure 6D). For VEGF165 the encapsulation efficiency was determined to be 14.4 ± 1.8% for the GP-5 gels, while it was 35.5 ± 1.0% for the GP-25 gels. In all cases, the VEGF121 isoform was able to load with much greater efficiency than the VEGF165 isoform. Although VEGF165 is a larger VEGF isoform, the incomplete loading is likely a result of ionic repulsions with chitosan at pH 6.8. VEGF121 contains the structure shown in Figure S4, with large anionic regions and without a cationic heparin-affinity domain (Robinson & Stringer, 2001) (Figure S5). VEGF165 contains both of the structures shown in Figures S4 and S5 (Christinger et al., 1996).
Figure 6.

Post-fabrication loading and cumulative release of encapsulated VEGF121 and VEGF165. (A,D) Loading of VEGF at pH 6.8 (gray + black bar) and encapsulation at pH 7.4 (gray bar). Some VEGF was lost during the pH-adjustment step (black bar). (B,C,E,F) Release of VEGF121 and VEGF165 from CS/GP microgels in PBS at 37 °C. Error bars for encapsulation are shown as mean + standard deviation, while error bars for washing are shown as mean − standard deviation. Error for release is mean ± standard deviation. (A,D) * = significance in encapsulation across conditions. (B,C, E, F) * = significance in cumulative release across conditions at day 28.
The GP-25 microgels were able to load and retain more of each VEGF isoform through pH-adjustment than GP-5 microgels. The higher encapsulation of VEGF into the GP-25 microgels is attributed to hydrophobic interactions between genipin and VEGF, and not a smaller mesh size because this is a post-fabrication loading mechanism.
Following encapsulation of VEGF, the microgels were suspended in DPBS at 37 °C. The release profiles show percent of VEGF released based on amount of encapsulated VEGF (Figure 6 B,C,E,&F). Cumulative release was characterized by measuring significance across time points for a specific CS/GP microgel. For the GP-5 microgels loaded with VEGF121, significant release was measured up to 3.5 days. In contrast, VEGF165 release from these gels was only observed for 1 day; after this, no protein was released likely due to network collapse and encapsulation. Although VEGF121 was able to load at a higher efficiency into the GP-5 microgels than VEGF165, significantly more of the encapsulated protein was released at 3.5 days (Figure 6 B&E).
The GP-25 microgels exhibited a lower release of VEGF121 and a similar or lower release of VEGF165. Release of VEGF121 was sustained in the CS-4/GP-25 and CS-6/GP-25 microgels for 1 week and for 3.5 days with the CS-2/GP-25 microgels. Release of VEGF165 from GP-25 microgels was only seen at day 1, with no significant release measured thereafter.
The small diameter of the microgel particles creates small diffusion length scales and this will lead to rapid release of protein which is simply adsorbed to the exterior of the particle. It is possible that the strong electrostatic interactions between CS and VEGF121 lead to a shell formation where protein is ionically bound near the exterior of the microgel(Malmsten, Bysell & Hansson, 2010); however, VEGF165 may not form such a shell due to weaker attractions. In either case, non-released protein remains encapsulated in the microgels at day 28 after the initial burst release.
Together with the mechanism of lysozyme degradation, these microgels provide a protein-encapsulating system which could be degraded in vivo for complete growth factor release. In addition, the mild loading conditions used here might allow any non-encapsulated protein to be purified and recycled. The CS-GP microgels are able to encapsulate oppositely-charged growth factors and have potential for a broad range of tissue engineering applications.
3.7 VEGF delivery to endothelial cells and microgel interaction
To characterize the microgel pellet as a tissue engineering scaffold, CS-6/GP-5 and CS-6/GP-25 microgels were introduced to HUVECs growing on 2D plastic culture dishes. For the metabolic assay, activity was determined by normalizing reazurin reduction of these cells to non-microgel controls (Equation 3, Figure 7A).
Figure 7.

(A) Metabolic viability of HUVECs cultured with microgels as determined by the PrestoBlue resazurin assay. * is significant increase (p < 0.05) and • is significant decrease (p < 0.05) compared to day 1 without VEGF. (B) Fluorescence micrographs of co-cultured microgels and endothelial cells. The HUVECs directly attached to the polystyrene dish were excluded from these images to show only the cells which have migrated onto and into the microgel scaffold.
The CS-6/GP-5 microgels containing VEGF121 or VEGF165 were able to increase metabolic activity of HUVECs at day 1 compared to controls exposed to 5 ng/mL of exogenous VEGF. CS-6/GP-25 microgels without VEGF did not affect metabolic activity at day 1. A decrease in metabolic activity was observed at day 3.5, but this was increased to 100.2 ± 10.1% by day 7. For the CS-6/GP-25 microgels, metabolic activity gradually decreased to 2.1 ± 6.1% at day 7. The decreased metabolic activity for the higher GP content could be due to increased hydrophobicity(Sikkema, de Bont & Poolman, 1994) or the anti-angiogenic effects of genipin(Koo et al., 2004). Importantly, the CS-6/GP-5 microgels were able to be cultured with endothelial cells and did not negatively influence cell growth at 7 days of culture.
To visualize the interactions between microgels and endothelial cells, pre-stained cells were imaged after one day of culture using confocal microscopy (Figure 7B). Endothelial cells were able to directly adhere to both the GP-5 and GP-25 microgels with and without loaded VEGF. The microgel was able to serve as a porous scaffold which promoted cell migration, likely due to the ability of chitosan to serve as a cell-adhesive polymer. These results will be considered in future work to use these microgels as an injectable and microporous tissue engineering scaffold.
4. Conclusion
In this investigation, densely-packed CS/GP microgels were able to serve as growth factor-encapsulating, injectable cell scaffolds with beneficial properties for tissue engineering. It was shown for the first time that chitosan microgels can be condensed into a microporous gel which remains stable after incubation at physiological conditions. The interparticle stability is believed to arise from the same mechanisms which cause pH-induced aggregation of chitosan; namely deprotonation of the primary amines leading to hydrogen bonding and hydrophobic interactions. Endothelial cells were able to attach directly to the microgels with or without growth factor and to proliferate within the porous network created by the packed microgels. The characterization presented here shows that microgels with less genipin (GP-5) are better candidates for localized, injectable scaffolds due to increased shear-thinning behavior, a more rapid lysozyme degradation, and enhanced cellular activity compared to microgel with more genipin (GP-25). Two oppositely-charged VEGF isoforms could be loaded and encapsulated into these microgels, showing potential for tissue engineering applications. This research motivates further development of this injectable biomaterial scaffold for regenerative medicine which is made from the marine-derived biopolymer chitosan.
Supplementary Material
HIGHLIGHTS.
Article: “Injectable and microporous scaffold of densely-packed, growth factor-encapsulating chitosan microgels”
Genipin-crosslinked chitosan microgels were produced in a single emulsion
Microgels encapsulated oppositely-charged growth factors and degraded with lysozyme
Microgels were condensed at pH 7.4 to form an injectable, shear-thinning scaffold
Endothelial cells migrated onto the microgels and within pores of the scaffold
This represents an ideal scaffold for minimally-invasive regenerative medicine
Acknowledgments
Funding:
This work was supported by the National Science Foundation under Grant # 1342222, National Institute of Arthritis and Musculoskeletal and Skin Diseases of the National Institutes of Health under Grant # 1R03AR068087 and an award from Children’s Hospital Colorado / Colorado School of Mines collaborative grant program.
Footnotes
Publisher's Disclaimer: This is a PDF file of an unedited manuscript that has been accepted for publication. As a service to our customers we are providing this early version of the manuscript. The manuscript will undergo copyediting, typesetting, and review of the resulting proof before it is published in its final citable form. Please note that during the production process errors may be discovered which could affect the content, and all legal disclaimers that apply to the journal pertain.
Author Contributions
MR and BR performed the experiments and analyzed the data, KP and DW contributed expertise on chitosan microspheres and tissue engineering applications, MK directed the research, and MR and MK wrote the paper. All authors have given approval to the final version of the manuscript.
Supporting Information. Size and swelling distributions of CS/GP microgels, 3-D confocal microscope reconstruction of densely-packed microgels, SEM of lyophilized microgels, and two-sided Coulombic surfaces for the receptor binding domain of VEGF and the heparin-binding domain of VEGF165.
REFERENCES
- Adams S, Frith WJ, Stokes JR. Influence of particle modulus on the rheological properties of agar microgel suspensions. Journal of Rheology. 2004;48(6):1195–1213. [Google Scholar]
- Agnihotri SA, Mallikarjuna NN, Aminabhavi TM. Recent advances on chitosan-based micro- and nanoparticles in drug delivery. Journal of Controlled Release. 2004;100(1):5–28. doi: 10.1016/j.jconrel.2004.08.010. [DOI] [PubMed] [Google Scholar]
- Arteche Pujana M, Pérez-Álvarez L, Cesteros Iturbe LC, Katime I. Biodegradable chitosan nanogels crosslinked with genipin. Carbohydrate Polymers. 2013;94(2):836–842. doi: 10.1016/j.carbpol.2013.01.082. [DOI] [PubMed] [Google Scholar]
- Bae KH, Wang L-S, Kurisawa M. Injectable biodegradable hydrogels: progress and challenges. Journal of Materials Chemistry B. 2013;1(40):5371–5388. doi: 10.1039/c3tb20940g. [DOI] [PubMed] [Google Scholar]
- Beck EC, Lohman BL, Tabakh DB, Kieweg SL, Gehrke SH, Berkland CJ, Detamore MS. Enabling Surgical Placement of Hydrogels Through Achieving Paste-Like Rheological Behavior in Hydrogel Precursor Solutions. Annals of Biomedical Engineering. 2015;43(10):2569–2576. doi: 10.1007/s10439-015-1277-8. [DOI] [PMC free article] [PubMed] [Google Scholar]
- Bergmann M, Holz F, Kopitz J. Lysosomal stress and lipid peroxidation products induce VEGF-121 and VEGF-165 expression in ARPE-19 cells. Graefe's Archive for Clinical and Experimental Ophthalmology. 2011;249(10):1477–1483. doi: 10.1007/s00417-011-1682-0. [DOI] [PubMed] [Google Scholar]
- Bhattarai N, Gunn J, Zhang M. Chitosan-based hydrogels for controlled, localized drug delivery. Advanced Drug Delivery Reviews. 2010;62(1):83–99. doi: 10.1016/j.addr.2009.07.019. [DOI] [PubMed] [Google Scholar]
- Bhattarai N, Ramay HR, Gunn J, Matsen FA, Zhang M. PEG-grafted chitosan as an injectable thermosensitive hydrogel for sustained protein release. Journal of Controlled Release. 2005;103(3):609–624. doi: 10.1016/j.jconrel.2004.12.019. [DOI] [PubMed] [Google Scholar]
- Butler MF, Ng Y-F, Pudney PDA. Mechanism and kinetics of the crosslinking reaction between biopolymers containing primary amine groups and genipin. Journal of Polymer Science Part A: Polymer Chemistry. 2003;41(24):3941–3953. [Google Scholar]
- Christinger HW, Muller YA, Berleau LT, Keyt BA, Cunningham BC, Ferrara N, de Vos AM. Crystallization of the receptor binding domain of vascular endothelial growth factor. Proteins: Structure, Function, and Bioinformatics. 1996;26(3):353–357. doi: 10.1002/(SICI)1097-0134(199611)26:3<353::AID-PROT9>3.0.CO;2-E. [DOI] [PubMed] [Google Scholar]
- Errington N, Harding SE, Vårum KM, Illum L. Hydrodynamic characterization of chitosans varying in degree of acetylation. International Journal of Biological Macromolecules. 1993;15(2):113–117. doi: 10.1016/0141-8130(93)90008-a. [DOI] [PubMed] [Google Scholar]
- Fairbrother WJ, Champe MA, Christinger HW, Keyt BA, Starovasnik MA. Solution structure of the heparin-binding domain of vascular endothelial growth factor. Structure. 1998;6(5):637–648. doi: 10.1016/s0969-2126(98)00065-3. [DOI] [PubMed] [Google Scholar]
- García Cruz DM, Escobar Ivirico JL, Gomes MM, Gómez Ribelles JL, Sánchez MS, Reis RL, Mano JF. Chitosan microparticles as injectable scaffolds for tissue engineering. Journal of Tissue Engineering and Regenerative Medicine. 2008;2(6):378–380. doi: 10.1002/term.106. [DOI] [PubMed] [Google Scholar]
- Griffin DR, Weaver WM, Scumpia PO, Di Carlo D, Segura T. Accelerated wound healing by injectable microporous gel scaffolds assembled from annealed building blocks. Nat Mater. 2015;14(7):737–744. doi: 10.1038/nmat4294. [DOI] [PMC free article] [PubMed] [Google Scholar]
- Hoare TR, Kohane DS. Hydrogels in drug delivery: Progress and challenges. Polymer. 2008;49(8):1993–2007. [Google Scholar]
- Jeon O, Powell C, Solorio LD, Krebs MD, Alsberg E. Affinity-based growth factor delivery using biodegradable, photocrosslinked heparin-alginate hydrogels. Journal of Controlled Release. 2011;154(3):258–266. doi: 10.1016/j.jconrel.2011.06.027. [DOI] [PMC free article] [PubMed] [Google Scholar]
- Kamiński K, Zazakowny K, Szczubiałka K, Nowakowska M. pH-Sensitive Genipin-Cross-Linked Chitosan Microspheres For Heparin Removal. Biomacromolecules. 2008;9(11):3127–3132. doi: 10.1021/bm800724q. [DOI] [PubMed] [Google Scholar]
- Ketz RJ, Prud'homme RK, Graessley WW. Rheology of concentrated microgel solutions. Rheologica Acta. 27(5):531–539. [Google Scholar]
- Koetting MC, Peters JT, Steichen SD, Peppas NA. Stimulus-responsive hydrogels: Theory, modern advances, and applications. Materials Science and Engineering: R: Reports. 2015;93:1–49. doi: 10.1016/j.mser.2015.04.001. [DOI] [PMC free article] [PubMed] [Google Scholar]
- Koo H-J, Song YS, Kim H-J, Lee Y-H, Hong S-M, Kim S-J, Kim B-C, Jin C, Lim C-J, Park E-H. Antiinflammatory effects of genipin, an active principle of gardenia. European Journal of Pharmacology. 2004;495(2–3):201–208. doi: 10.1016/j.ejphar.2004.05.031. [DOI] [PubMed] [Google Scholar]
- Kretlow JD, Klouda L, Mikos AG. Injectable matrices and scaffolds for drug delivery in tissue engineering. Advanced Drug Delivery Reviews. 2007;59(4–5):263–273. doi: 10.1016/j.addr.2007.03.013. [DOI] [PubMed] [Google Scholar]
- Lin C-C, Anseth K. PEG Hydrogels for the Controlled Release of Biomolecules in Regenerative Medicine. Pharmaceutical Research. 2009;26(3):631–643. doi: 10.1007/s11095-008-9801-2. [DOI] [PMC free article] [PubMed] [Google Scholar]
- Lin C-C, Metters AT. Hydrogels in controlled release formulations: Network design and mathematical modeling. Advanced Drug Delivery Reviews. 2006;58(12–13):1379–1408. doi: 10.1016/j.addr.2006.09.004. [DOI] [PubMed] [Google Scholar]
- Malmsten M, Bysell H, Hansson P. Biomacromolecules in microgels — Opportunities and challenges for drug delivery. Current Opinion in Colloid & Interface Science. 2010;15(6):435–444. [Google Scholar]
- Mekhail M, Tabrizian M. Injectable Chitosan-Based Scaffolds in Regenerative Medicine and their Clinical Translatability. Advanced Healthcare Materials. 2014;3(10):1529–1545. doi: 10.1002/adhm.201300586. [DOI] [PubMed] [Google Scholar]
- Mi F-L, Shyu S-S, Peng C-K. Characterization of ring-opening polymerization of genipin and pH-dependent cross-linking reactions between chitosan and genipin. Journal of Polymer Science Part A: Polymer Chemistry. 2005;43(10):1985–2000. [Google Scholar]
- Muller YA, Christinger HW, Keyt BA, de Vos AM. The crystal structure of vascular endothelial growth factor (VEGF) refined to 1.93 A resolution: multiple copy flexibility and receptor binding. Structure. 1997;5(10):1325–1338. doi: 10.1016/s0969-2126(97)00284-0. [DOI] [PubMed] [Google Scholar]
- Muzzarelli RAA. Chitins and chitosans for the repair of wounded skin, nerve, cartilage and bone. Carbohydrate Polymers. 2009;76(2):167–182. [Google Scholar]
- Nguyen MK, Alsberg E. Bioactive factor delivery strategies from engineered polymer hydrogels for therapeutic medicine. Progress in Polymer Science. 2014;39(7):1235–1265. doi: 10.1016/j.progpolymsci.2013.12.001. [DOI] [PMC free article] [PubMed] [Google Scholar]
- Pettersen EF GT, Huang CC, Couch GS, Greenblatt DM, Meng EC, Ferrin TE. UCSF Chimera--a visualization system for exploratory research and analysis. J Comput Chem. 2004;25(13):1605–1612. doi: 10.1002/jcc.20084. [DOI] [PubMed] [Google Scholar]
- Rinaudo M. Chitin and chitosan: Properties and applications. Progress in Polymer Science. 2006;31(7):603–632. [Google Scholar]
- Robinson CJ, Stringer SE. The splice variants of vascular endothelial growth factor (VEGF) and their receptors. Journal of Cell Science. 2001;114(5):853–865. doi: 10.1242/jcs.114.5.853. [DOI] [PubMed] [Google Scholar]
- Schatz C, Pichot C, Delair T, Viton C, Domard A. Static Light Scattering Studies on Chitosan Solutions: From Macromolecular Chains to Colloidal Dispersions. Langmuir. 2003;19(23):9896–9903. [Google Scholar]
- Sikkema J, de Bont JA, Poolman B. Interactions of cyclic hydrocarbons with biological membranes. Journal of Biological Chemistry. 1994;269(11):8022–8028. [PubMed] [Google Scholar]
- Sinha VR, Singla AK, Wadhawan S, Kaushik R, Kumria R, Bansal K, Dhawan S. Chitosan microspheres as a potential carrier for drugs. International Journal of Pharmaceutics. 2004;274(1–2):1–33. doi: 10.1016/j.ijpharm.2003.12.026. [DOI] [PubMed] [Google Scholar]
- Skop NB, Calderon F, Levison SW, Gandhi CD, Cho CH. Heparin crosslinked chitosan microspheres for the delivery of neural stem cells and growth factors for central nervous system repair. Acta Biomaterialia. 2013;9(6):6834–6843. doi: 10.1016/j.actbio.2013.02.043. [DOI] [PubMed] [Google Scholar]
- Solorio L, Zwolinski C, Lund AW, Farrell MJ, Stegemann JP. Gelatin microspheres crosslinked with genipin for local delivery of growth factors. Journal of Tissue Engineering and Regenerative Medicine. 2010;4(7):514–523. doi: 10.1002/term.267. [DOI] [PMC free article] [PubMed] [Google Scholar]
- Sorlier P, Denuzière A, Viton C, Domard A. Relation between the Degree of Acetylation and the Electrostatic Properties of Chitin and Chitosan. Biomacromolecules. 2001;2(3):765–772. doi: 10.1021/bm015531+. [DOI] [PubMed] [Google Scholar]
- Terbojevich M, Cosani A, Muzzarelli RAA. Molecular parameters of chitosans depolymerized with the aid of papain. Carbohydrate Polymers. 1996;29(1):63–68. [Google Scholar]
- Wang H, Leeuwenburgh SC, Li Y, Jansen JA. The use of micro-and nanospheres as functional components for bone tissue regeneration. Tissue Engineering Part B: Reviews. 2011;18(1):24–39. doi: 10.1089/ten.teb.2011.0184. [DOI] [PMC free article] [PubMed] [Google Scholar]
- Yuan Y, Chesnutt BM, Utturkar G, Haggard WO, Yang Y, Ong JL, Bumgardner JD. The effect of cross-linking of chitosan microspheres with genipin on protein release. Carbohydrate Polymers. 2007;68(3):561–567. [Google Scholar]
- Zhang Y, Zhu W, Wang B, Ding J. A novel microgel and associated post-fabrication encapsulation technique of proteins. Journal of Controlled Release. 2005;105(3):260–268. doi: 10.1016/j.jconrel.2005.04.001. [DOI] [PubMed] [Google Scholar]
- Zhu J, Marchant RE. Design properties of hydrogel tissue-engineering scaffolds. Expert Review of Medical Devices. 2011;8(5):607–626. doi: 10.1586/erd.11.27. [DOI] [PMC free article] [PubMed] [Google Scholar]
Associated Data
This section collects any data citations, data availability statements, or supplementary materials included in this article.