Abstract
Objective
MicroRNAs (miRNAs) are small endogenous non-coding regulatory RNAs that control mRNAs post-transcriptionally. Several mouse stem cells miRNAs are cloned differentially regulated in different hematopoietic lineages, suggesting their possible role in hematopoietic lineage differentiation. Recent studies have shown that specific miRNAs such as Mir-451 have key roles in erythropoiesis.
Materials and Methods
In this experimental study, murine embryonic stem cells (mESCs) were infected with lentiviruses containing pCDH-Mir-451. Erythroid differentiation was assessed based on the expression level of transcriptional factors (Gata-1, Klf-1, Epor) and hemoglobin chains (α, β, γ , ε and ζ) genes using quantitative reverse transcriptase-polymerase chain reaction (qRT-PCR) and presence of erythroid surface antigens (TER-119 and CD235a) using flow cytometery. Colony-forming unit (CFU) assay was also on days 14thand 21thafter transduction.
Results
Mature Mir-451 expression level increased by 3.434-fold relative to the untreated mESCs on day 4 after transduction (P<0.001). Mir-451 up-regulation correlated with the induction of transcriptional factor (Gata-1, Klf-1, Epor) and hemoglobin chain (α, β, γ, ε and ζ) genes in mESCs (P<0.001) and also showed a strong correlation with presence of CD235a and Ter- 119 markers in these cells (13.084and 13.327-fold increse, respectively) (P<0.05). Moreover, mESCs treated with pCDH-Mir-451 showed a significant raise in CFU-erythroid (CFU-E) colonies (5.2-fold) compared with untreated control group (P<0.05).
Conclusion
Our results showed that Mir-451 up-regulation strongly induces erythroid differentiation and maturation of mESCs. Overexpression of Mir-451 may have the potential to produce artificial red blood cells (RBCs) without the presence of any stimulatory cytokines.
Keywords: MicroRNAs, Mir-451, mESCs, Erythropoiesis, Globin Chains
Introduction
Embryonic stem cells (ESCs) are multipotent stem cells derived from the inner cell mass of the blastocyst, an early-stage embryo (1-3). ESCs keep pluripotency and self-renewing ability due to both their inherent properties and the culture conditions in which they are grown (2). The significance of ESCs in modern biology and medicine derives from two unique characteristics that differentiate them from all other organ-specific stem cells identified to date. First, they can be maintained and enlarged as pure populations of undifferentiated cells for extended periods of time, possibly indefinitely, in culture (3). Secondly, they show a remarkable capacity to form differentiated cell types in culture (4). A close relationship between microRNAs (miRNAs) and ESC development has been observed (5, 6).
Erythropoiesis is the complex process through which a fraction of primitive multipotent hematopoietic stem cells (HSCs) convert to the committed red cell lineage, undergoing differentiation to erythroid progenitors [burst forming unit-erythroid (BFU-E) and colony-forming unit-erythroid (CFU-E)], normoblasts, erythroblasts, reticulocytes, and ultimately mature erythrocytes (7). This process is regulated by many factors including erythropoietin, testosterone, estrogen, interleukin-3 (IL-3), granulocyte-macrophage colony-stimulating factor, IL-9, transcriptional networks and miRNAs (8, 9).
MiRNAs are small endogenous non-coding RNA molecules (19 to 25 nts) that regulate gene expression post-transcriptionally (10) and are phylogenetically conserved (5, 11). While some miRNAs are steadily expressed in the whole organism, their expression pattern is often temporal and/or tissue-specific (12-14). MiRNAs can play significant roles in growth by targeting the transcripts of protein-coding genes and suppressing productive translation (15-17). MiRNAs have shown to be involved in many different cellular processes including metabolism, apoptosis, differentiation, and development (15). Many miRNAs are implicated in a variety of developmental and physiological processes (18, 19). Expression profile of miRNAs in the course of hematopoietic development suggested their potential involvement in hematopoietic differentiation regulation (20, 21). The HSCs lead to both myeloid and lymphoid progenitors (21, 22).
MiRNAs may create a regulatory network with cytokines and transcriptional factors to control erythroid lineage commitment and differentiation (23). Of note, Mir-451 exists in mature circulating red blood cells (24, 25). Any expression changes of Mir-451 in murine erythroleukemia (MEL) cells promoted or impaired erythrocyte differentiation, respectively (23, 26). Gata Binding Protein 1 (Globin Transcription Factor 1) [Gata-1] is a hematopoietic transcription factor essential for the production of erythrocytes, eosinophils, platelets and mast cells (27). Gata-1 organizes erythropoiesis by inducing and repressing genes involved in cell division, apoptosis, and terminal maturation (28). Gata-1 indorses erythroid-specific gene expression through binding at regulatory element sites within the promoters of αand β-globin and other erythroid-specific genes (29). Erythropoietin receptor (Epor) can induce proliferation of cultured chicken, mouse and human erythroid progenitors. Damaged signaling from the Epor not only affects stress erythropoiesis, but also causes erythropoiesis defects during normal development (30). Erythroid Kruppel-like factor (Eklf) (a.k.a. Klf1) is a red cellenriched DNA binding protein that cooperates with its cognate 5´-CCMCRCCCN-3´element within target promoters and enhancers. In genetic, biochemical and molecular studies, the role of Klf1 in β-like globin gene regulation has been emphasized since its discovery (31). Klf1 is a key erythroid transcriptional regulator (32, 33) and induces a different set of genes associated with erythropoiesis including the β-globin gene (Hbb) (34).
In this experimental study, we examined the early stages of mESCs lineage commitment by investigating whether Mir-451 up-regulation could induce erythropoiesis differentiation from mESCs and be used as a replacement to the stimulatory cytokines for mESCs differentiation into erythroid cells.
Materials and Methods
HEK-293T cell line culture
Human embryonic kidney (HEK)-293T cell line was obtained from the National Cell Bank of Iran (Pasteur Institute, Iran). The HEK-293T cells were cultured in Dulbecco’s modified Eagle’s medium (DMEM), 10 % fetal bovine serum (FBS), 100 U/ml penicillin, 2 mM L-glutamine and 100 µl streptomycin (all from Gibco, USA). This cell line was kept at 37˚C in a humidified atmosphere containing 95 % humidity and 5 % CO2 according to the supplier’s instructions.
Recombinant lentiviruses production
The pCDH-451 plasmid was produced by li-gating 250 bp fragments encompassing pri-Mir-451 sequences into the XbaI /BamHI restriction sites of the pCDH-CMV-MCS-EF1-copGFP vector (System Biosciences, USA). These fragments were elevated by polymerase chain reaction (PCR) reaction using following primers: pri-Mir-451 F: 5′-GTC GTA TGC AGA GCA GGG TCC GAGGTA TTC GCA CTG CAT ACG ACA ACT CA3′ and R: 5′GTCGTATGCAGAGCAGGGTCCGAGGTATTCGCACTGCATACGACAACCTC-3′ on extracted genomic DNA. For lentivirus production; HEK-293T cells (3×10³) were seeded into 10-cm plates containing DMEM medium supplemented with 10% FBS. The day after, pPAX2 plasmid (containing gag and pol genes) and pMD2 plasmid (containing vsv gene) were co-transfected with the pCDH-451 plasmid empty vector (pCDH empty backbone) as negative control into seeded HEK-293T cells using the lipofectamin 2000 reagent (Invitrogen, USA) according to the manufacturer’s protocol. The supernatants containing generated lentiviruses were collected every 12 hours for 3 days after transfection and concentrated by ultracentrifugation at 40.000 g for 2 hours. Then for virus titration, HEK-293T cells were transduced with a different concen- tration of recombinant lentiviruses and the number of viruses in the functional copy was detected using green fluorescent protein (GFP) protein and fluorescent microscope forty-eight hours later.
Murine embryonic stem cells culture
Murine ESC (mESC) [E14Tg2A] lines were cultured on gelatin-coated tissue culture dishes (Sigma, USA) at an intensity of 40,000 cells/cm2 . ESC medium, which was exchanged daily, contained knockout DMEM, 20% FBS-ES,1 mM sodium pyruvate (Gibco, USA), 2 mM Glutamine (Euroclone, Italy), 0.05 mM b-mercaptoethanol, 1 mM non-essential amino acids (Gibco, USA), 1,000 U/ml recombinant mouse leukemia inhibitory factor (LIF, Sigma, USA) and 100 U/ml penicillin/streptomycin (Euroclone, Italy).
Murine embryonic stem cells infection
The infection was done in three groups. Each groups had three samples. Embryonic bodies (EB) were cultured for 1 to 21 days under the following conditions: i. Blank: EBs did not receive any treatment (untreated group), ii. pCDH-451 lentiviruses: EBs were transduced with pCDH-451 lentiviruses (pCDH-451 group) and iii. pCDH-empty lentiviruses: EBs were transduced with pCDH-empty lentiviruses (negative control group).
After 14 and 21 days, the effect of Mir-451 upregulation in erythroid differentiation was monitored by analyzing expression of transcriptional factor (Gata-1, Klf-1 and Epor) and hemoglobin chain (α, β, γ, ε and ζ) using quantitive reverse transcriptasePCR (qRT-PCR) and presence of erythroid cell surface markers (CD235a and Ter-119) using flow cytometry.
RNA extraction
Total RNA was extracted from test and control groups using the Trizol reagent (Gibco, USA), according to the manufacturer’s instructions. cDNA was synthesized by Superscript II reverse transcription (Invitrogen, USA) and random hexamer primers, according to the manufacturer’s instructions.
Real-time reverse transcriptase-polymerase chain reaction quantification of miRNAs
Real-time RT-PCR quantification of miRNAs was undertaken using primers designed Primer Express version 2.0 (Applied Biosystems, Foster City, CA). Briefly, first cDNA strand was synthesized through miRNA 1st-strand cDNA synthesis kit (Stratagene, USA) and reverse transcribed into qPCR-ready cDNA. After that, miRNA qRT-PCR was carried out in triplicate on ABI PRISM 7500 real time PCR System (Applied Biosystems, USA) with the high-specifity miRNA qPCR core reagent kit (Stratagene, USA) and normalized to U6 small nuclear RNA (Snord47) as an endogenous control. Primer sequences are shown in Table 1. The qRT- PCR cycling conditions were 10 minutes at 95˚C followed by 40 cycles of 10 seconds at 95˚C, 15 seconds at 60˚C, and 20 seconds at 72˚C. Data analyses were performed using the 2−ΔΔct method.
Table 1.
The sequence of primers that used in this study
| Gene | Primer (5'-3') |
|---|---|
| Mir-451 | F: CGA GAA ACC GTT ACC ATT AC |
| R: GAG CAG GGT CCG AGG T | |
| Snord47 | F: ATC ACT GTA AAA CCG TTC CA |
| R: GAG CAG GGT CCG AGG T | |
| Gata-1 | F: CAC TCC CCA GTC TTT CAG G |
| R: TGC CGT CTT GCC ATA GG | |
| Klf-1 | F: CGC ACA CGG GAG AGA AG |
| R: ACA GCA GAA GGG ACG ATG | |
| Epor | F: ATA TCA ATG AAG TAG TGC TCC TG |
| R: CCC TTT GTG TCC CTC CTG | |
| ζ chain | F: CAA CTT CAA GCT CCT GTC C |
| R: GGA GGG TTC AAT AAA GGG | |
| ε chain | F: GGG AAG GCT CCT GAT TG |
| R: CAC TGA GAT GAG CAA AGG TC | |
| γ chain | F: AAC TTC AAA CTC TTG GGT AAT G |
| R: GGA GGC ATA GCG GAC AC | |
| β chain | F: CTG ATT CTG TTG TGT TGA CTT G |
| R: GAC AAC CAG CAG CCT GC | |
| α chain | F: CTG GAA AGG ATG TTT GCT AG |
| R: CAT CGG CGA CCT TCT TG | |
| β.actin | F: CTT CTT GGG TAT GGA ATC CTG |
| R: GTG TTG GCA TAG AGG TCT TTA C | |
Real-time reverse transcriptase-polymerase chain reaction quantification of transcriptional factors and hemoglobin chains
Expression of transcriptional factor (Gata-1, Klf- 1, Epor) and hemoglobin chain (α, β, γ, ε and ζ) genes was quantified using ABI PRISM 7500 real-time PCR System (Applied Biosystems, USA) with the SYBR premix ExTaq kit (Takara, Japan) according to the manufacturer’s instruction. The qRT-PCR cycling conditions were done same as above.
Flow cytometry
Cells from all groups (blank control group, pCDH-451 group and negative control group) were collected for flow cytometry. The viability of the cells was examined by trypan blue exclusion and was always greater than 95%. They were immunostained with phycoerythrin (PE)–conjugated anti-TER119 (1:200) and PE–conjugated anti-CD235a (1:200, BD Pharmingen, San Diego, CA, USA) antibodies. Propidium iodide was added to exclude dead cells from analysis. The cells were then analyzed on flow cytometer PartecPAS III (Partec, Germany).
Colony-forming unit assays
Colony-forming cell (CFC) assay was carried out in triplicate using methylcellulose complete media (MethoCultTM, StemCell Technologies, Inc, USA) according to the manufacturer’s instructions. In all groups, 5×10³ mESCs were cultured in 35-mm plates with the medium containing 25% FBS, 2% bovine serum albumin, 1.3% methyl cellulose, 0.05 mmol/L 2-mercaptoethanol, 3 U/mL erythropoietin (EPO), 2 mmol/L L-glutamine, 50 ng/mL stem cell factor (SCF), 10 ng/mL IL-3 and 10 ng/mL granulocyte macrophage-colony-stimulating factor plus activin A (25 ng/mL). After incubation at 37˚C, 5% CO2 and 95% humidity for 12 days, the colony-forming unit-granulocyte, erythroid, macrophage, megakaryocyte (CFU-GEMMs), colony-forming unit-granulocyte, macrophage (CFU-GMs) and CFU-Es in every dishes was sorted and counted under a high-quality inverted microscope (Leica, Heidelberg, Germany).
Statistical analysis
All tests were repeated three times and data were shown as mean ± SD. The comparison between groups was performed using the Student’s t test. P value less than 0.05 was considered statistically significant.
Results
Transfection efficiency and production of lentiviruses in HEK293T cells
The pMD2G, psPAX2 and pCDH-451 plasmids were co-transfected into HEK293T cells on a 10 cm plate using lipofectamin 2000 reagent (Invitrogen, USA) according to the manufacturer’s protocol (pCDH-451). Lentiviruses expressing Mir-451 was then generated.
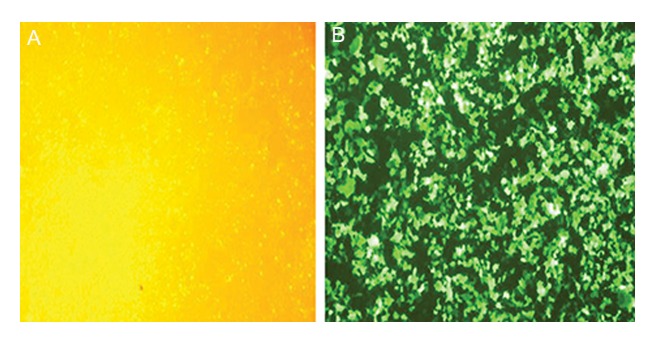
Lentiviral vectors created from pCDH-empty plasmids were used as negative control (pCDH- Neg). Transfection efficiency was confirmed each time by fluorescent microscopy. Approximately 95% of cells in the pCDH-451 group and 97% of cells in the pCDH-empty vector group with green fluorescence were distinguished 48 and 72 hours after infection (Figes.1, 2). No fluorescent-positive cell was present in our control group.
Fig.1.
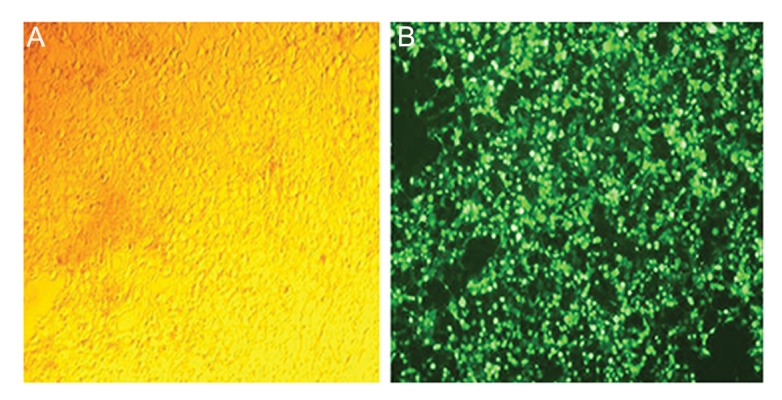
A. Transfected HEK293T cells examined by light microscopy and B. Transfected HEK293T cells examined by fluorescent microscopy. Transfection efficiency of murine embryonic stem cells (mESCs) with pCDH-Mir-451 was more than 95% as determined by fluorescent microscopy.
Fig.2.
A. Transfected HEK293T cells examined by light microscopy and B. Transfected HEK293T cells examined by fluorescent microscopy. Transfection efficiency of murine embryonic stem cells (mESCs) with pCDH-empty vector was more than 95% as determined by fluores- cent microscopy.
Transduction efficiency and Mir-451 expression in murine embryonic stem cells
In order to enter mESCs into erythroid commitment, mESCs were transduced with lentiviral vector pCDH-451 expressing copGFP and allowed to form EBs in suspension culture. CopGFP serves as an internal control by marking all cells that receive the vector. The concentrations of this vector was in the range of 3×10⁷ to 7×10⁷ viral particles per milliliter and diverse multiplicities of infection were used to optimize transduction conditions. Transduction efficiency was monitored each time by fluorescent microscopy and evaluated by flow cytometry for the GFP marker. GFP overexpression of lentiviruses in mESCs was 60% of cells with pCDH-451 and 65% of cells with pCDH-empty vectors and was distinguishable 96 hours after infection. No fluorescent-positive cell was detected in our control group (Fig.3).
Fig.3.
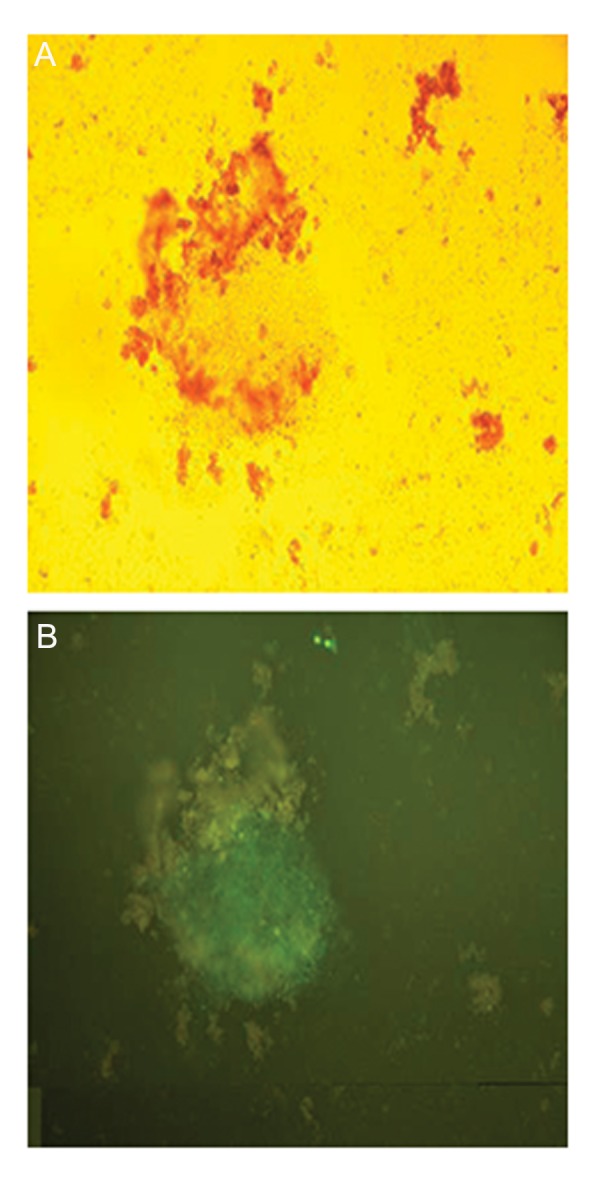
A. Transduced murine embryonic stem cells (mESCs) examined by light microscopy and B. Transduced mESCs examined by fluorescent microscopy. Transduction efficiency of mESCs with pCDH- Mir-451 was more than 60% as determined by flow cytometry for the GFP marker.
Recombinant lentiviruses increased mature miRNAs level in treated murine embryonic stem cells
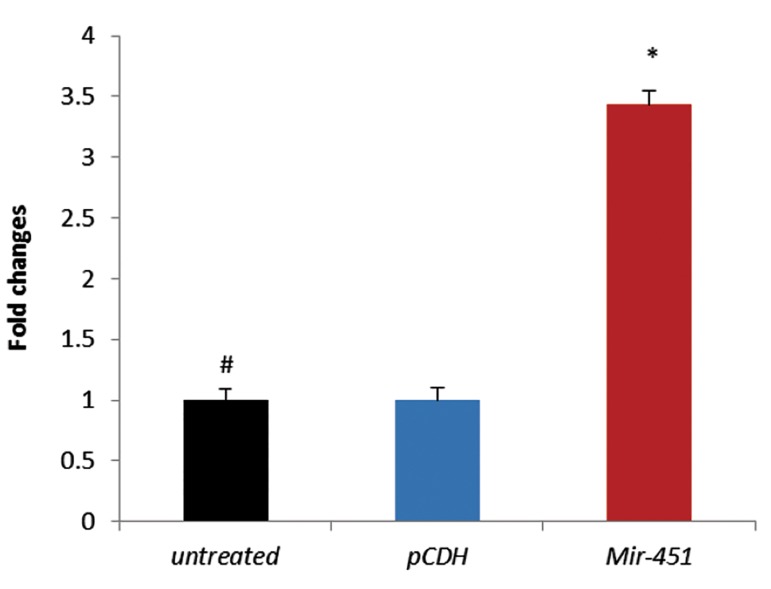
We determined the expression level of Mir-451 on day 4 after transduction in test and control groups by qRT-PCR. In mESCs treated with pCDH-Mir-451 lentiviruses, mature Mir-451 expression level increased by 3.434-fold relative to the untreated mESCs (P<0.001, Fig.4). As expected, when mESCs were treated with pCDH-empty lentiviruses, mature Mir- 451 expression level displayed no significant alteration compared with blank control groups (P>0.05). These results suggested that pCDH-Mir-451 recombinant lentiviruses are efficient and increased mature Mir-451 level significantly.
Fig.4.
Expression analysis (fold changes) of Mir-451 in treated murine embryonic stem cells (mESCs) on day 4. The expression of Mir-451 in the mESCs treated with pCDH-Mir-451 cells was significantly higher than that in mESCs treated with pCDH-empty vector and those untreated. Relative miRNA expression levels were normalized to Snord47 as an internal control. Columns, mean of three different experiments. *; P<0.001 and #; Results were compared with these columns.
Expression analysis of transcriptional factor genes
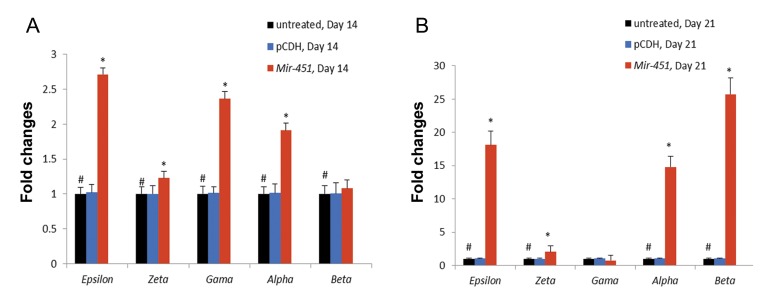
We then examined the effect of this up-regulation on the expression of erythroid specific markers (Gata-1, Klf-1 and Epor) by qRT-PCR on day 14 and 21, as an index of erythropoiesis. According to qRT-PCR results, the expression of these transcriptional factors distinguished the pCDH-451, indicating successful erythropoeisis (Fig.5). In the mESCs treated with pCDH-Mir-451, Gata-1 and Klf-1 expression were increased by 1.952and 4.084-fold, respectively when compared with the untreated control group on day 14 (P<0.001) but was decreased by 0.712and 2.454-fold, respectively on day 21 (P<0.001). In this group, Epor expression was increased on day 14 and 21. Treatment of mESCs with pCDH-Mir-451 lentiviruses, led to the rise of Epor expression by 23.183-fold relative to the untreated mESCs on day 21 (P<0.001).
Fig.5.

A. Expression analysis (fold changes) of transcriptional factors in treated murine embryonic stem cells (mESCs) on day 14 and B. Expression analysis (fold changes) of transcriptional factors in treated mESCs on day 21. Relative transcriptional factors expression levels were normalized to β-Actin as an internal control. Results presented as fold change compared with the control group. Columns, mean of three different experiments. *; P<0.001 and #; Results were compared with these columns.
Expression analysis of hemoglobin chain genes
The expression profile of hemoglobin chain genes was obtained using qRT-PCR method on days 14 and 21. According to the qRT-PCR results, mESCs treated with pCDH-Mir-451 led to a significant increase of ε, ζ, γ and α transcripts (by 2.824-1.421, 2.566and 1.918-fold, respectively) compared with the untreated control group on day 14 (P<0.05). On day 21, sharp increase of accumulation of ε, α and β-globin transcripts were detected in the pCDH-451 group (by 18.126- 14.774and 25.723, fold-respectively) compared with the untreated control group (P<0.05). A moderate increase of ζ transcripts (by 2.035-fold) was seen in mESCs treated with pCDH-Mir-451 on day 21 (P<0.05). The pattern of γ transcripts was decreased in this group (by 0.742-fold) compared with the untreated control group (P>0.05). These results further confirmed that Mir-451 may have a vital roles in the induction of hemoglobinization (Fig.6).
Fig.6.
A. Expression analysis (fold changes) of hemoglobin chains in treated murine embryonic stem cells (mESCs) on day 14 and B. Ex- pression analysis (fold changes) of hemoglobin chains in treated mESCs on day 21. Relative hemoglobin chains expression levels were normalized to β-Actin as an internal control. Results presented as fold change compared with the control group. Columns, mean of three different experiments. *; P<0.05 and #; Results were compared with these columns.
Flow cytometry analysis of TER-119 and CD235a expressions
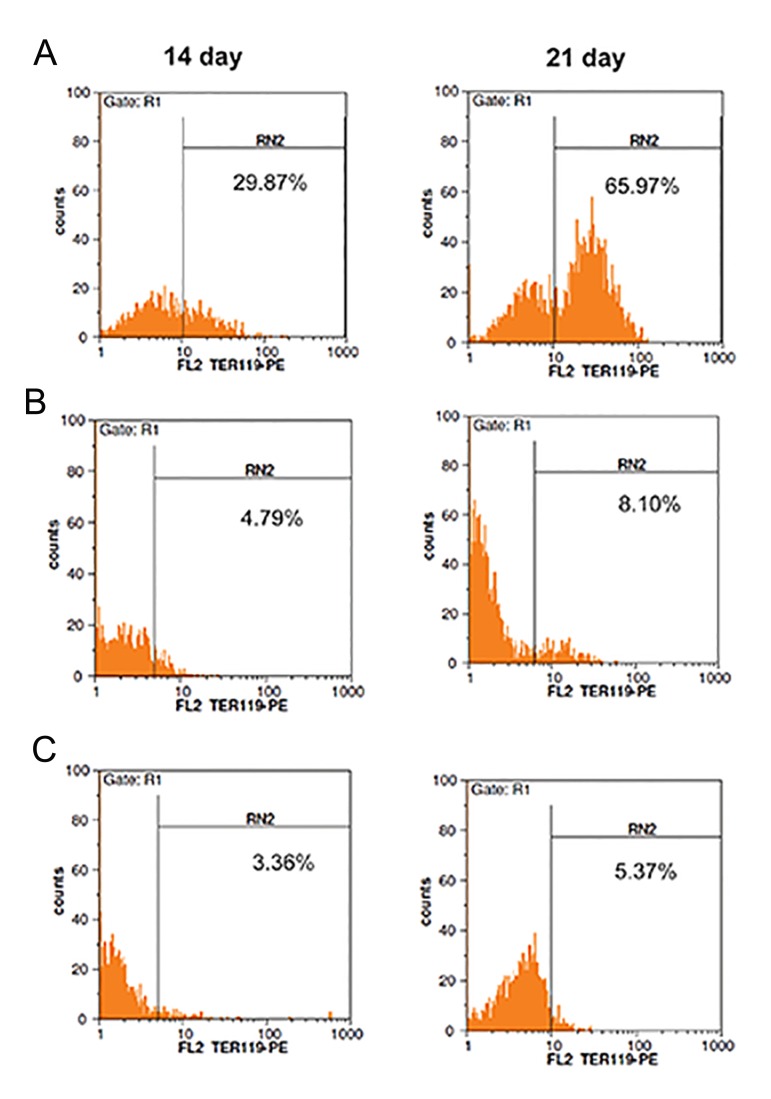
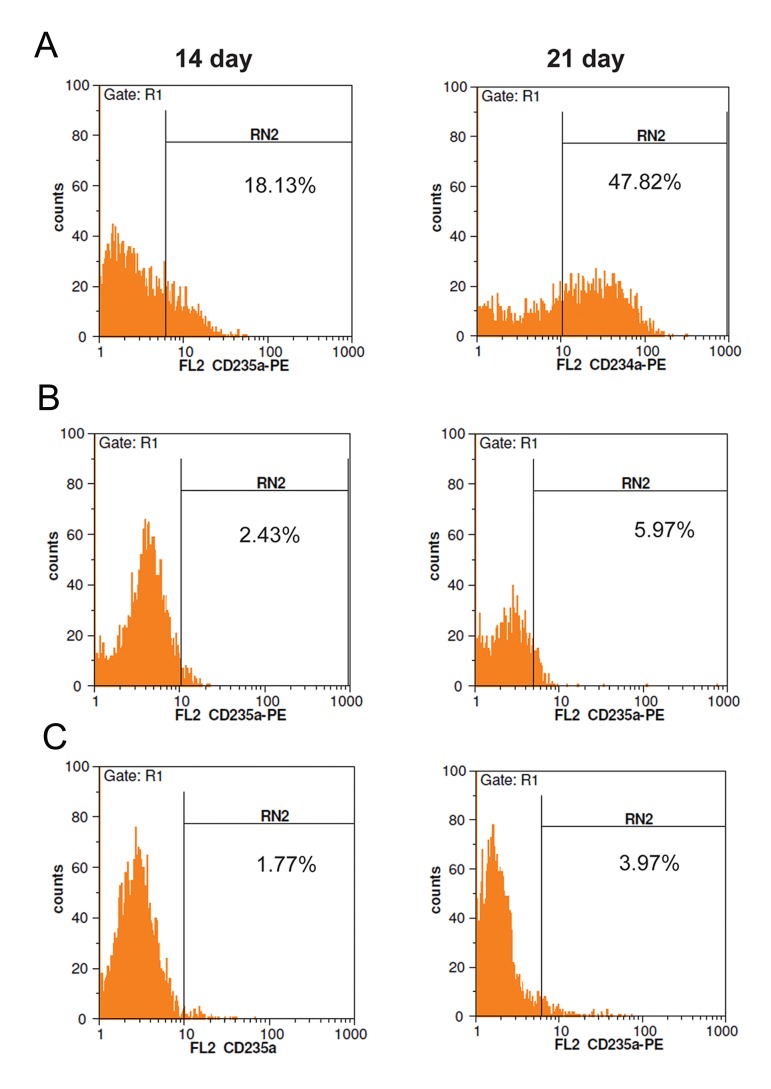
As other indicators of erythropoiesis, the presence of TER119 and CD235a was estimated using flow cytometry on days 14 and 21. As shown in Table 2, in the pCDH-451-infected group, overexpression of Mir-451 led to a rise in the proportion of cells expressing TER119 and CD235a 30.12 ± 2.34% for and 17.47 ± 2.21%, respectively, compared with 3.87 ± 0.95% and 2.56 ± 0.87% of the control cells (untreated mESCs), respectively, on day 14 (7.782and 6.824-fold, respectively, P<0.05). Results on day 21 showed the percentage of cells positive for TER119 and CD235a was 66.34 ± 2.81% and 46.38 ± 2.37% in Mir-451 treated mESCs and 5.07 ± 1.01% and 3.48 ± 1.28% in untreated mESCs, respectively (13.084and 13.327-fold, respectively, P<0.05) (Figes.7, 8).
Table 2.
The proportion of cells expressing TER119 and CD235a in three mESCs groups by FACS
| Groups | Day 14 | Day 21 |
|---|---|---|
| The proportion of the cells expressing TER119 | ||
| Treated mESCs with Mir-451 | 30.12 ± 2.34% | 66.34 ± 2.81% |
| Treated mESCs with pCDH-empty | 4.02 ± 1.21% | 7.90 ± 1.41% |
| Untreated mESCs | 3.87 ± 0.95% | 5.07 ± 1.01% |
| The proportion of the cells expressing CD235a | ||
| Treated mESCs with Mir-451 | 17.47 ± 2.21% | 46.38 ± 2.37% |
| Treated mESCs with pCDH-empty | 2.98 ± 1.36% | 6.0 3 ± 1.19% |
| Untreated mESCs | 2.56 ± 0.87% | 3.48 ± 1.28% |
mESCs; Murine embryonic stem cells.
Fig.7.
Overexpression of TER-119 in murine embryonic stem cells (mESCs). More than 95% of cells were gated in R1. A. FACS histogram showing transduction efficiency of mESCs with lentiviral vector expressing pCDH-Mir-451, B. FACS histogram showing transduction efficiency of mESCs with lentiviral vector expressing pCDH-empty vector and C. FACS histogram showing transduction efficiency of untreated mESCs. The positive regions were adjusted according to the control isotope antibody reaction.
Fig.8.
Overexpression of CD235a in murine embryonic stem cells (mESCs). More than 95% of cells were gated in R1. A. FACS histogram showing transduction efficiency of mESCs with lentiviral vector expressing pCDH-Mir-451, B. FACS histogram showing transduction efficiency of mESCs with lentiviral vector expressing pCDH-empty vector and C. FACS histogram showing transduction efficiency of untreated mESCs. The positive regions were adjusted according to the con- trol isotope antibody reaction.
Colony-forming unit assays
On the 12th day after incubation, the cells in the three groups created three types of colonies, indicating their ability to develop different progenitor cells (Fig.9). The number of Mir-451 in treated mESCs, pCDH-empty vector and untreated mESCs in treated-formed colonies, CFU-E, CFU-GM, and CFU-GEMM colonies are shown in Table 3. According to CFU assay results, mESCs treated with pCDH-Mir-451 led to a significant increase in CFU-E colonies (by 5.2-fold) compared with the untreated control group (P<0.05).
Fig.9.
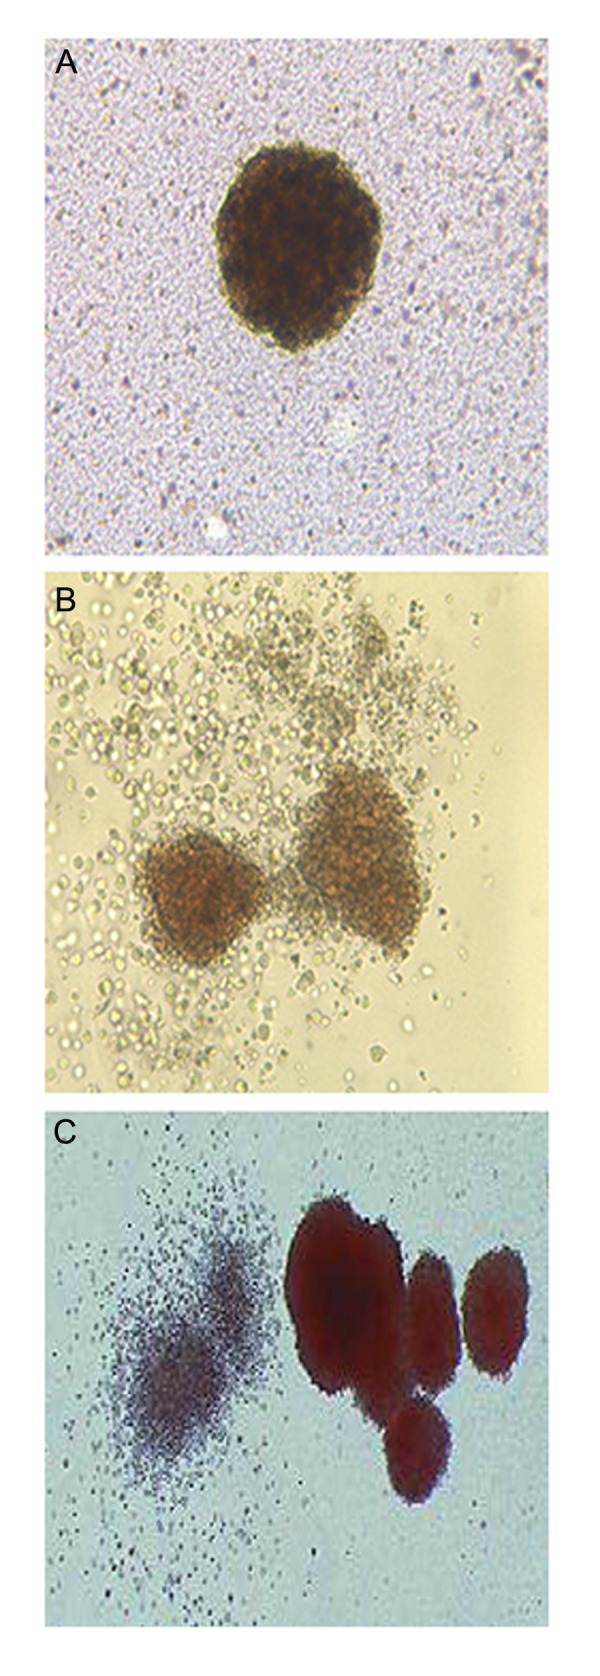
CFC assay of murine embryonic stem cells (mESCs), A. CFU-E, B. CFU-GEMM and C. CFU-GM with some CFU-E, all observed under an inverted microscope (×100) showing that mESCs generated the colonies. CFU-E; Colony-forming unit-erythroid, CFU-GEMM; CFU- granulocyte, erythroid, macrophage, megakaryocyte and CFU-GM; CFU-granulocyte, macrophage.
Table 3.
Colony-forming ability of Mir-451 in treated mESCs, pCDH-empty treated mESCs and untreated mESCs
| Colonies | CFU-GEMM | CFU-GM | CFU-E |
|---|---|---|---|
| Groups | |||
| Mir-451 in treated mESCs | 20 ± 2.34 | 12 ± 2.81 | 26 ± 2.37 |
| pCDH-empty in treated mESCs | 1 8 ± 1.21 | 17 ± 1.41 | 6 ± 1.36 |
| Untreated mESCs | 17 ± 1.01 | 18 ± 1.19 | 5 ± 1.28 |
mESCs; Murine embryonic stem cells, CFU-GEMM; Colony-forming unit-granulocyte, erythroid, macrophage,
Discussion
Erythropoiesis requires the regulation of several pathways to enable the production of vast numbers of red blood cells (RBCs) over a person’s lifetime (35,36). The particular biological functions of individual miRNAs are now appearing through reverse genetic studies, revealing important roles in development, physiology and disease, including hematopoiesis (19,37). MiRNAs play important roles in regulation of a multitude of physiological functions, such as stem cell differentiation and development. Precise regulation of these processes is vital to normal development and prevention of cancer. The aim of some large studies was to identify the roles of miRNAs in differentiation in different organs (38,40) including hematopoietic lineage differentiation (41,42). MiRNAs, because of their small size, nuclease resistance, fast synthesis and long half-life/bioactivity may be the ideal substitutes for growth factors for direct differentiation towards any particular cell type (43). Several murine miRNA loci have recently been disturbed by gene targeting with resultant hematopoietic phenotypes (e.g., mice lacking Mir-155, a lymphoid-restricted miRNA, have defective immune responses) (44). In this study, we found a new protocol to differentiate mESCs into erythroid lineage by expression modulation of specific miRNAs in the absence of any erythroid-specific cytokines. mESCs were treated with pCDH-451 lentiviruses and the emergence of erythroid lineage was investigated. In our EB differentiation system, overexpression of Mir-451 in mESCs induced the differentiation of erythroid cells. Our observation seems to be in agreement with a previous study by Kouhkan et al. (45) who demonstrated that Mir-451 have a strong positive correlation with the appearance of erythroid specific cell surface markers such as CD71 and CD235a, and hemoglobin synthesis upon erythroid differentiation of CD133+ cells and Pase et al. (26) also showed that Mir-451 accelerated the rate of erythrocyte maturation, an action mediated in part by repression of gata2.In addition, they showed that Mir-451 is significantly up-regulated during erythroid differentiation. Mir-451 plays an important role in promoting erythroid maturation, in part via its target GATA-2.
As markers of erythropoiesis, we examined the expression of Gata-1, Epor, and Klf-1 transcription factors using qRT-PCR in all groups. Results revealed that these factors were expressed in mESCs transduced with lentiviral vector expressing pCDH-Mir-451. Gata-1 expression was decreased in all groups on day 21. Gata-1 reveals physiologically that occur during normal erythropoiesis (46). During transcriptional effects or physical interactions with core cell cycle components, Gata-1 could obstruct cell proliferation (47). Rylski et al. (47) showed that Gata-1 persuades G1 arrest during erythroid maturation and identified an extensive Gata-1-regulated network of gene activation and repression related to cell cycle control. Epor expression was increased in the pCDH-451 group on day 21. Erythropoietin (Epo) is a glycoprotein and a major regulator of the growth and differentiation of erythroid blood cells. Its biological influence is mediated through binding to the Epor on the cell surface (48). Klf1 expression was decreased in all groups on day 21. Cantor and Orkin (49) have shown that binding sites for both Klf-1 (and the related ubiquitously expressed protein Sp1) and Gata-1 are located in close proximity in cis-regulatory elements of erythroid-specific genes. In addition, both Sp1 and Klf-1 physically associate with the zinc finger region of Gata-1 and synergistically activate Gata-1 target genes in transiently expressed reporter constructs. Thus, protein-protein interactions between Gata-1 and Klf-1 may be implicated in facilitating the switch from fetal to adult globin expression.
An additional study on the expression profile of hemoglobin chains using qRT-PCR indicated that the up-regulation of Mir-451 induced a significant rise in mESC hemoglobinization and similarly we detected a sharp increase of accumulation of αglobin and β-globin transcripts in the pCDH-451 group. Therefore, Mir-451 seems to have more effect on the progression of erythroid maturation that increasing expression level of α-globin and β-globin. These results are consistent with some previous studies indicating that Mir-451 has a strong positive correlation with the late stage of erythropoiesis (41,42,45,50,51). On the other hands, Mir-451 stimulated embryonic globin chains (ζ and ε) and γ-globin. In the first step of erythroid differentiation, expression level of γ-globin was at high level and at the late step of it, γ-globin expression was low (51). According to our results, ζ-globin and ε-globin expression were elevated in the pCDH-451 group on day 21. ζ-globin is an essential globin chain for embryonic Hb such as Gower I (ζ2ε2), Portland I (ζ2γ2) and Portland II (ζ2β2) (52). In addition, expression level of Gata-1 was decreased on day 21. Raich et al. (53) showed that Gata-1 obstruct human epsilon globin transcription by binding to its proximal promoter. In mice, erythropoiesis begins in the embryonic yolk sac where primitive erythroid cells express εy and bh-1 globins. The εy gene is suppressed in definitive erythroid cells. In definitive erythropoiesis, ε is expressed and suppressed autonomously, however, in primitive erythropoiesis ε seems to be regulated competitively (54,55).
In this study, we isolated mESCs treated with pCDH-Mir-451 and confirmed that they display stem cell properties based on CFC assays, consistent with similar findings obtained with HSCs (22,56). We also isolated mESCs treated with pCDH empty vector and untreated mESCs as we control groups to analyze miRNA expression profile. mESCs are a mixed population consisting predominantly, almost 90%, of differentiated, committed hematopoietic progenitor cells (HPCs). We compared miRNA expression profiles of these three mESCs subpopulations to detect differentially expressed miRNAs.
We examined the effect of overexpression of Mir451 on erythroid differentiation of mESCs. FACS results indicated that Mir-451 up-regulation induced the erythroid surface markers TER119 and CD235a. CD235a expression increased on day 14 and reached its peak level on day 21. These results were similar to those reported by Choong et al. (57) and Kouhkan et al. (45,51). TER119 expression increased upon erythroid differentiation. Kina et al. (58) demonstrated that TER-119 was highly specific to erythroid cells at the stages from early proerythroblast to mature erythrocyte and that TER-119 recognizes a cell surface molecule which is strongly associated with glycophorin A. It was shown that TER-119 was expressed only on normal erythroid cells but not on erythroleukaemia cells, even after induction of these cells with dimethylsulphoxide (DMSO).
Conclusion
We show that Mir-451 up-regulation may play important roles in erythroid differentiation for in vitro erythropoiesis of mESCs and production of artificial RBCs without the presence of any stimulatory cytokines. Since the major problem of patients with hemoglobinopathies, such as sickle cell anemia and thalassemia, is failure in the production of adult globin (HbA) and reactivation of the αand β-globin chains has been shown to rescue the lethality of mice with αand β-thalassemia. Mir-451 and other miRNAs may be useful in designing effective therapeutic strategies for the possibility of reversing these abnormalities by gene therapy.
Acknowledgments
This study was the result of a thesis financially supported by Blood Transfusion Research Center, High Institute for Research and Education in Transfusion Medicine, Tehran, Iran and Iran National Science Foundation (INSF). The authors indicate no potential conflicts of interest.
References
- 1.Thomson JA, Itskovitz-Eldor J, Shapiro SS, Waknitz MA, Swiergiel JJ, Marshall VS, et al. Embryonic stem cell lines derived from human blastocysts. Science. 1998;282(5391):1145–1147. doi: 10.1126/science.282.5391.1145. [DOI] [PubMed] [Google Scholar]
- 2.Zhao W, Ji X, Zhang F, Li L, Ma L. Embryonic stem cell markers. Molecules. 2012;17(6):6196–6236. doi: 10.3390/molecules17066196. [DOI] [PMC free article] [PubMed] [Google Scholar]
- 3.Keller G. Embryonic stem cell differentiation: emergence of a new era in biology and medicine. Genes Dev. 2005;19(10):1129–1155. doi: 10.1101/gad.1303605. [DOI] [PubMed] [Google Scholar]
- 4.Smith AG. Embryo-derived stem cells: of mice and men. Annu Rev Cell Dev Biol. 2001;17:435–462. doi: 10.1146/annurev.cellbio.17.1.435. [DOI] [PubMed] [Google Scholar]
- 5.Houbaviy HB, Murray MF, Sharp PA. Embryonic stem cellspecific MicroRNAs. Dev Cell. 2003;5(2):351–358. doi: 10.1016/s1534-5807(03)00227-2. [DOI] [PubMed] [Google Scholar]
- 6.Ishii H, Saito T. Radiation-induced response of micro RNA expression in murine embryonic stem cells. Med Chem. 2006;2(6):555–563. doi: 10.2174/1573406410602060555. [DOI] [PubMed] [Google Scholar]
- 7.Wang Q, Huang Z, Xue H, Jin C, Ju XL, Han JD, et al. MicroRNA miR-24 inhibits erythropoiesis by targeting activin type I receptor ALK4. Blood. 2008;111(2):588–595. doi: 10.1182/blood-2007-05-092718. [DOI] [PubMed] [Google Scholar]
- 8.Shiozaki M, Sakai R, Tabuchi M, Nakamura T, Sugino K, Sugino H, et al. Evidence for the participation of endogenous activin A/erythroid differentiation factor in the regulation of erythropoiesis. Proc Natl Acad Sci. 1992;89(5):1553–1556. doi: 10.1073/pnas.89.5.1553. [DOI] [PMC free article] [PubMed] [Google Scholar]
- 9.Tsiftsoglou AS, Vizirianakis IS, Strouboulis J. Erythropoiesis: model systems, molecular regulators, and developmental programs. IUBMB Life. 2009;61(8):800–830. doi: 10.1002/iub.226. [DOI] [PubMed] [Google Scholar]
- 10.Bartel DP. MicroRNAs: genomics, biogenesis, mechanism, and function. Cell. 2004;116(2):281–297. doi: 10.1016/s0092-8674(04)00045-5. [DOI] [PubMed] [Google Scholar]
- 11.Lagos-Quintana M, Rauhut R, Meyer J, Borkhardt A, Tuschl T. New microRNAs from mouse and human. RNA. 2003;9(2):175–179. doi: 10.1261/rna.2146903. [DOI] [PMC free article] [PubMed] [Google Scholar]
- 12.Felli N, Fontana L, Pelosi E, Botta R, Bonci D, Facchiano F, et al. MicroRNAs 221 and 222 inhibit normal erythropoiesis and erythroleukemic cell growth via kit receptor down-modulation. Proc Natl Acad Sci USA. 2005;102(50):18081–18086. doi: 10.1073/pnas.0506216102. [DOI] [PMC free article] [PubMed] [Google Scholar]
- 13.Lee RC, Ambros V. An extensive class of small RNAs in Caenorhabditis elegans. Science. 2001;294(5543):862–864. doi: 10.1126/science.1065329. [DOI] [PubMed] [Google Scholar]
- 14.Lau NC, Lim LP, Weinstein EG, Bartel DP. An abundant class of tiny RNAs with probable regulatory roles in Caenorhabditis elegans. Science. 2001;294(5543):858–862. doi: 10.1126/science.1065062. [DOI] [PubMed] [Google Scholar]
- 15.Ambros V. MicroRNA pathways in flies and worms: growth, death, fat, stress, and timing. Cell. 2003;113(6):673–676. doi: 10.1016/s0092-8674(03)00428-8. [DOI] [PubMed] [Google Scholar]
- 16.Bartel B, Bartel DP. MicroRNAs: at the root of plant development? Plant Physiol. 2003;132(2):709–717. doi: 10.1104/pp.103.023630. [DOI] [PMC free article] [PubMed] [Google Scholar]
- 17.Palatnik JF, Allen E, Wu X, Schommer C, Schwab R, Carrington JC, et al. Control of leaf morphogenesis by microRNAs. Nature. 2003;425(6955):257–263. doi: 10.1038/nature01958. [DOI] [PubMed] [Google Scholar]
- 18.Alvarez-Garcia I, Miska EA. MicroRNA functions in animal development and human disease. Development. 2005;132(21):4653–4662. doi: 10.1242/dev.02073. [DOI] [PubMed] [Google Scholar]
- 19.Kloosterman WP, Plasterk RH. The diverse functions of microRNAs in animal development and disease. Dev Cell. 2006;11(4):441–450. doi: 10.1016/j.devcel.2006.09.009. [DOI] [PubMed] [Google Scholar]
- 20.Kluiver J, Kroesen BJ, Poppema S, Van den Berg A. The role of microRNAs in normal hematopoiesis and hematopoietic malignancies. Leukemia. 2006;20(11):1931–1936. doi: 10.1038/sj.leu.2404387. [DOI] [PubMed] [Google Scholar]
- 21.Chen CZ, Li L, Lodish HF, Bartel DP. MicroRNAs modulate hematopoietic lineage differentiation. Science. 2004;303(5654):83–86. doi: 10.1126/science.1091903. [DOI] [PubMed] [Google Scholar]
- 22.Liao R, Sun J, Zhang L, Lou G, Chen M, Zhou D, et al. MicroRNAs play a role in the development of human hematopoietic stem cells. J Cell Biochem. 2008;104(3):805–817. doi: 10.1002/jcb.21668. [DOI] [PubMed] [Google Scholar]
- 23.Zhan M, Miller CP, Papayannopoulou T, Stamatoyannopoulos G, Song CZ. MicroRNA expression dynamics during murine and human erythroid differentiation. Exp Hematol. 2007;35(7):1015–1025. doi: 10.1016/j.exphem.2007.03.014. [DOI] [PMC free article] [PubMed] [Google Scholar]
- 24.Kloosterman WP, Steiner FA, Berezikov E, de Bruijn E, van de Belt J, Verheul M, et al. Cloning and expression of new microRNAs from zebrafish. Nucleic Acids Res. 2006;34(9):2558–2569. doi: 10.1093/nar/gkl278. [DOI] [PMC free article] [PubMed] [Google Scholar]
- 25.Rathjen T, Nicol C, McConkey G, Dalmay T. Analysis of short RNAs in the malaria parasite and its red blood cell host. FEBS Lett. 2006;580(22):5185–5188. doi: 10.1016/j.febslet.2006.08.063. [DOI] [PubMed] [Google Scholar]
- 26.Pase L, Layton JE, Kloosterman WP, Carradice D, Waterhouse PM, Lieschke GJ. miR-451 regulates zebrafish erythroid maturation in vivo via its target gata2. Blood. 2009;113(8):1794–1804. doi: 10.1182/blood-2008-05-155812. [DOI] [PMC free article] [PubMed] [Google Scholar]
- 27.Dore LC, Amigo JD, Dos Santos CO, Zhang Z, Gai X, Tobias JW, et al. A GATA-1-regulated microRNA locus essential for erythropoiesis. Proc Natl Acad Sci USA. 2008;105(9):3333–3338. doi: 10.1073/pnas.0712312105. [DOI] [PMC free article] [PubMed] [Google Scholar]
- 28.Welch JJ, Watts JA, Vakoc CR, Yao Y, Wang H, Hardison RC, et al. Global regulation of erythroid gene expression by transcription factor GATA-1. Blood. 2004;104(10):3136–3147. doi: 10.1182/blood-2004-04-1603. [DOI] [PubMed] [Google Scholar]
- 29.Doré LC, Chlon TM, Brown CD, White KP, Crispino JD. Chromatin occupancy analysis reveals genome-wide GATA factor switching during hematopoiesis. Blood. 2012;119(16):3724–3733. doi: 10.1182/blood-2011-09-380634. [DOI] [PMC free article] [PubMed] [Google Scholar]
- 30.Bauer A, Tronche F, Wessely O, Kellendonk C, Reichardt HM, Steinlein P, et al. The glucocorticoid receptor is required for stress erythropoiesis. Genes Dev. 1999;13(22):2996–3002. doi: 10.1101/gad.13.22.2996. [DOI] [PMC free article] [PubMed] [Google Scholar]
- 31.Yien YY, Bieker JJ. EKLF/KLF1, a tissue-restricted integrator of transcriptional control, chromatin remodeling, and lineage determination. Mol Cell Biol. 2013;33(1):4–13. doi: 10.1128/MCB.01058-12. [DOI] [PMC free article] [PubMed] [Google Scholar]
- 32.Bieker JJ. Probing the onset and regulation of erythroid cell-specific gene expression. Mt Sinai J Med. 2005;72(5):333–338. [PubMed] [Google Scholar]
- 33.Borg J, Papadopoulos P, Georgitsi M, Gutiérrez L, Grech G, Fanis P, et al. Haploinsufficiency for the erythroid transcription factor KLF1 causes hereditary persistence of fetal hemoglobin. Nat Genet. 2010;42(9):801–805. doi: 10.1038/ng.630. [DOI] [PMC free article] [PubMed] [Google Scholar]
- 34.Siatecka M, Bieker JJ. The multifunctional role of EKLF/ KLF1 during erythropoiesis. Blood. 2011;118(8):2044–2054. doi: 10.1182/blood-2011-03-331371. [DOI] [PMC free article] [PubMed] [Google Scholar]
- 35.An X, Mohandas N. Erythroblastic islands, terminal erythroid differentiation and reticulocyte maturation. Int J Hematol. 2011;93(2):139–143. doi: 10.1007/s12185-011-0779-x. [DOI] [PubMed] [Google Scholar]
- 36.Randle SJ, Nelson DE, Patel SP, Laman H. Defective erythropoiesis in a mouse model of reduced Fbxo7 expression due to decreased p27 expression. J Pathol. 2015;237(2):263–272. doi: 10.1002/path.4571. [DOI] [PMC free article] [PubMed] [Google Scholar]
- 37.Stefani G, Slack FJ. Small non-coding RNAs in animal development. Nat Rev Mol Cell Biol. 2008;9(3):219–230. doi: 10.1038/nrm2347. [DOI] [PubMed] [Google Scholar]
- 38.Yang GH, Wang F, Yu J, Wang XS, Yuan JY, Zhang JW. MicroRNAs are involved in erythroid differentiation control. J Cell Biochem. 2009;107(3):548–556. doi: 10.1002/jcb.22156. [DOI] [PubMed] [Google Scholar]
- 39.Havelange V, Garzon R. MicroRNAs: emerging key regulators of hematopoiesis. Am J Hematol. 2010;85(12):935–942. doi: 10.1002/ajh.21863. [DOI] [PubMed] [Google Scholar]
- 40.Lawrie CH. microRNA expression in erythropoiesis and erythroid disorders. Br J Haematol. 2010;150(2):144–151. doi: 10.1111/j.1365-2141.2009.07978.x. [DOI] [PubMed] [Google Scholar]
- 41.Bruchova H, Yoon D, Agarwal AM, Mendell J, Prchal JT. Regulated expression of microRNAs in normal and polycythemia vera erythropoiesis. Exp Hematol. 2007;35(11):1657–1667. doi: 10.1016/j.exphem.2007.08.021. [DOI] [PMC free article] [PubMed] [Google Scholar]
- 42.Bruchova-Votavova H, Yoon D, Prchal JT. miR-451 enhances erythroid differentiation in K562 cells. Leuk Lymphoma. 2010;51(4):686–693. doi: 10.3109/10428191003629362. [DOI] [PubMed] [Google Scholar]
- 43.Cook MS, Blelloch R. Small RNAs in germline development. Curr Top Dev Biol. 2012;102:159–205. doi: 10.1016/B978-0-12-416024-8.00006-4. [DOI] [PubMed] [Google Scholar]
- 44.Rodriguez A, Vigorito E, Clare S, Warren MV, Couttet P, Soond DR, et al. Requirement of bic/microRNA-155 for normal immune function. Science. 2007;316(5824):608–611. doi: 10.1126/science.1139253. [DOI] [PMC free article] [PubMed] [Google Scholar]
- 45.Kouhkan F, Soleimani M, Daliri M, Behmanesh M, Mobarra N, Mossahebi-mohammadi M, et al. miR-451 upregulation, induce erythroid differentiation of CD133+ cells independent of cytokine cocktails. Iran J Basic Med Sci. 2013;16(6):756–762. [PMC free article] [PubMed] [Google Scholar]
- 46.Dolznig H, Boulmé F, Stangl K, Deiner EM, Mikulits W, Beug H, et al. Establishment of normal, terminally differentiating mouse erythroid progenitors: molecular characterization by cDNA arrays. FASEB J. 2001;15(8):1442–1444. doi: 10.1096/fj.00-0705fje. [DOI] [PubMed] [Google Scholar]
- 47.Rylski M, Welch JJ, Chen YY, Letting DL, Diehl JA, Chodosh LA, et al. GATA-1-mediated proliferation arrest during erythroid maturation. Mol Cell Biol. 2003;23(14):5031–5042. doi: 10.1128/MCB.23.14.5031-5042.2003. [DOI] [PMC free article] [PubMed] [Google Scholar]
- 48.Shinjo K, Takeshita A, Higuchi M, Ohnishi K, Ohno R. Erythropoietin receptor expression on human bone marrow erythroid precursor cells by a newly-devised quantitative flow-cytometric assay. Br J Haematol. 1997;96(3):551–558. doi: 10.1046/j.1365-2141.1997.d01-2071.x. [DOI] [PubMed] [Google Scholar]
- 49.Cantor AB, Orkin SH. Transcriptional regulation of erythropoiesis: an affair involving multiple partners. Oncogene. 2002;21(21):3368–7336. doi: 10.1038/sj.onc.1205326. [DOI] [PubMed] [Google Scholar]
- 50.Masaki S, Ohtsuka R, Abe Y, Muta K, Umemura T. Expression patterns of microRNAs 155 and 451 during normal human erythropoiesis. Biochem Biophys Res Commun. 2007;364(3):509–514. doi: 10.1016/j.bbrc.2007.10.077. [DOI] [PubMed] [Google Scholar]
- 51.Kouhkan F, Hafizi M, Mobarra N, Mossahebi-Mohammadi M, Mohammadi S, Behmanesh M, et al. miRNAs: A new method for erythroid differentiation of hematopoietic stem cells without the presence of growth factors. Appl Biochem Biotechnol. 2014;172(4):2055–2069. doi: 10.1007/s12010-013-0633-0. [DOI] [PubMed] [Google Scholar]
- 52.Manning LR, Russell JE, Padovan JC, Chait BT, Popowicz A, Manning RS, et al. Human embryonic, fetal, and adult hemoglobins have different subunit interface strengths.Correlation with lifespan in the red cell. Protein Sci. 2007;16(8):1641–1658. doi: 10.1110/ps.072891007. [DOI] [PMC free article] [PubMed] [Google Scholar]
- 53.Raich N, Clegg CH, Grofti J, Romeo PH, Stamatoyannopoulos G. GATA1 and YY1 are developmental repressors of the human epsilon-globin gene. EMBO J. 1995;14(4):801–809. doi: 10.1002/j.1460-2075.1995.tb07058.x. [DOI] [PMC free article] [PubMed] [Google Scholar]
- 54.Yi Z, Cohen-Barak O, Hagiwara N, Kingsley PD, Fuchs DA, Erickson DT, et al. Sox6 directly silences epsilon globin expression in definitive erythropoiesis. PLoS Genet. 2006;2(2):e14–e14. doi: 10.1371/journal.pgen.0020014. [DOI] [PMC free article] [PubMed] [Google Scholar]
- 55.Harju S, McQueen KJ, Peterson KR. Chromatin structure and control of beta-like globin gene switching. Exp Biol Med (Maywood) 2002;227(9):683–700. doi: 10.1177/153537020222700902. [DOI] [PubMed] [Google Scholar]
- 56.Ponti D, Costa A, Zaffaroni N, Pratesi G, Petrangolini G, Coradini D, et al. Isolation and in vitro propagation of tumorigenic breast cancer cells with stem/progenitor cell properties. Cancer Res. 2005;65(13):5506–5511. doi: 10.1158/0008-5472.CAN-05-0626. [DOI] [PubMed] [Google Scholar]
- 57.Choong ML, Yang HH, McNiece I. MicroRNA expression profiling during human cord blood-derived CD34 cell erythropoiesis. Exp Hematol. 2007;35(4):551–564. doi: 10.1016/j.exphem.2006.12.002. [DOI] [PubMed] [Google Scholar]
- 58.Kina T, Ikuta K, Takayama E, Wada K, Majumdar AS, Weissman IL, et al. The monoclonal antibody TER-119 recognizes a molecule associated with glycophorin A and specifically marks the late stages of murine erythroid lineage. Br J Haematol. 2000;109(2):280–287. doi: 10.1046/j.1365-2141.2000.02037.x. [DOI] [PubMed] [Google Scholar]


