Abstract
The ubiD/ubiX or the homologous fdc/pad genes have been implicated in the non-oxidative reversible decarboxylation of aromatic substrates, and play a pivotal role in bacterial ubiquinone biosynthesis1–3 or microbial biodegradation of aromatic compounds4–6 respectively. Despite biochemical studies on individual gene products, the composition and co-factor requirement of the enzyme responsible for in vivo decarboxylase activity remained unclear7–9. We show Fdc is solely responsible for (de)carboxylase activity, and that it requires a new type of cofactor: a prenylated flavin synthesised by the associated UbiX/Pad10. Atomic resolution crystal structures reveal two distinct isomers of the oxidized cofactor can be observed: an isoalloxazine N5-iminium adduct and a N5 secondary ketimine species with drastically altered ring structure, both having azomethine ylide character. Substrate binding positions the dipolarophile enoic acid group directly above the azomethine ylide group. The structure of a covalent inhibitor-cofactor adduct suggests 1,3-dipolar cycloaddition chemistry supports reversible decarboxylation in these enzymes. While 1,3-dipolar cycloaddition is commonly used in organic chemistry11–12, we propose this presents the first example of an enzymatic 1,3-dipolar cycloaddition reaction. Our model for Fdc/UbiD catalysis offers new routes in alkene hydrocarbon production or aryl (de)carboxylation.
Decarboxylation is among one of the most common reactions in nature, despite the fact it is inherently difficult to achieve at ambient conditions. This is due to the high energy of the carbanion intermediate that is formed concomitant with carbon dioxide formation. To overcome this challenge, the majority of decarboxylases13 make use of cofactors, including organic cofactors such as flavins, PLP, TPP or metal ions such as Mg2+, Fe2+ or Mn2+. Decarboxylation is also frequently coupled to substrate oxidation. Comparatively few decarboxylases have been shown to require no cofactor and, in these selected cases, catalysis involves non-oxidative decarboxylation of those substrates for which the corresponding carbanion species can be stabilised using simple acid-base chemistry. Examples include orotidine monophosphate decarboxylase14 and arylmalonate decarboxylase15.
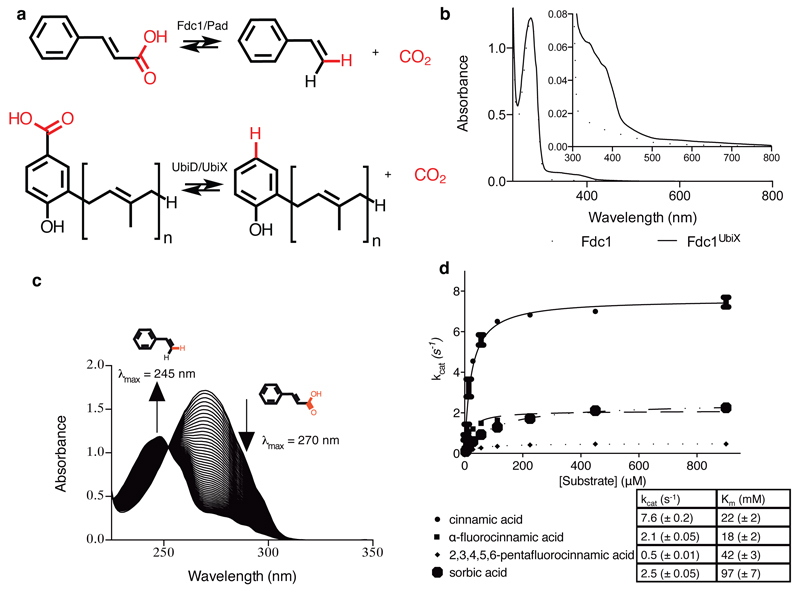
The ubiX-ubiD or the related pad-fdc genes have been shown to be responsible for non-oxidative reversible decarboxylation of aromatic substrates1–6 [Fig 1a]. These genes are widely distributed in archaeal, bacterial and fungal genomes16, and ubiX-ubiD feature in the prokaryotic ubiquinone biosynthetic pathway1–3. Genetic studies have led to the suggestion both genes encode for (redundant) decarboxylases17. However, although UbiX/Pad proteins are distantly related to flavin-containing cysteine decarboxylases and have been shown to bind FMN, no in vitro decarboxylase activity has been detected7,18. Furthermore, most biochemical studies of UbiD/Fdc have also failed to detect in vitro activity8,19. Although recent UbiD/Fdc structures reveal distant structural homology to a family of NADH:FMN oxidoreductases, only metal ion -rather than flavin- binding has been reported8. Hence, the composition and putative co-factor requirement of the enzyme responsible for the observed in vivo decarboxylase activity remained unclear.
Fig 1. Fdc solution data.
a) Schematic overview of the reaction catalysed by Fdc/Pad and the related UbiD/UbiX proteins. b) UV-Vis spectra obtained for heterologous expressed A. niger Fdc, with and without co-expression of a ubiX gene. c) UV-vis observation of the enzymatic conversion of cinnamic acid to styrene via decarboxylation by FdcUbiX. The initial spectrum of cinnamic acid shows a λmax of 270 nm. Over time successive spectra show reduction of the 270 nm peak and appearance of a peak at 245 nm corresponding to styrene formation. d) Steady state kinetic parameters obtained for FdcUbiX for sorbic acid and a variety of cinnamic acid-type compounds (error bars are s.e.m. n=3).
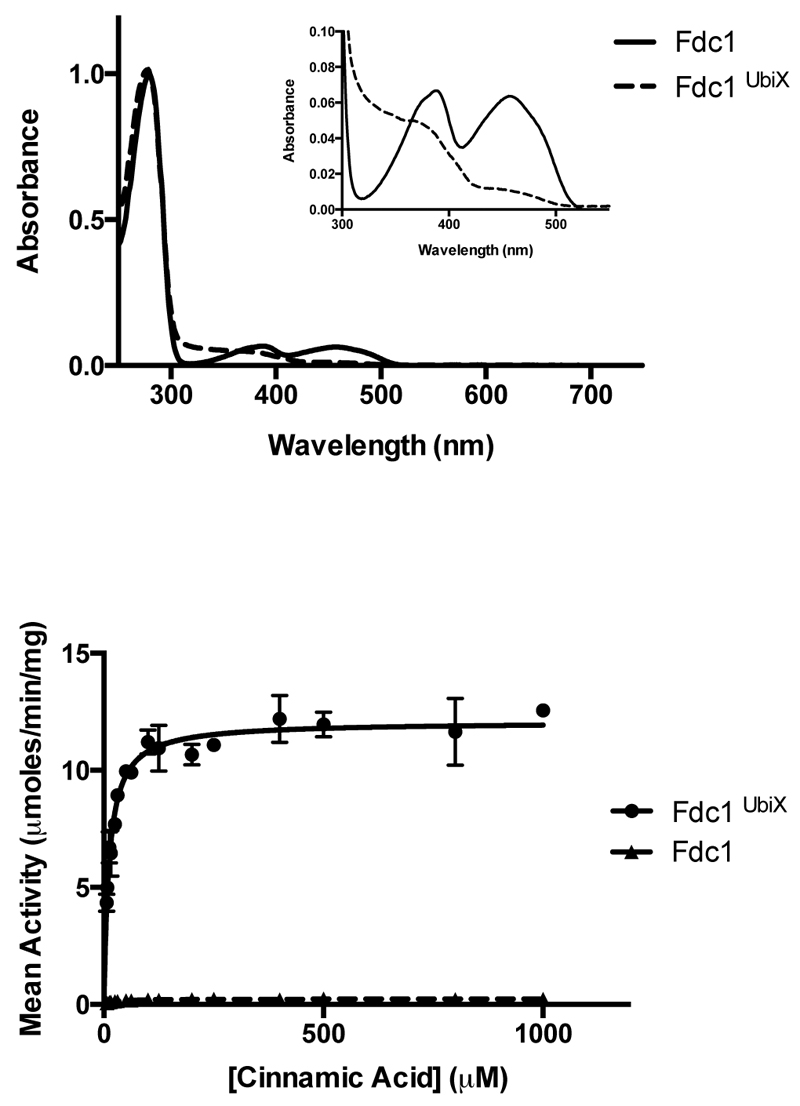
We co-expressed the Aspergillus niger fdc gene in E. coli with either the associated A. niger pad or the homologous ubiX from E. coli. While no direct interaction could be detected between the purified Fdc and either UbiX or Pad proteins, clear differences could be observed between single expressed Fdc and the corresponding ubiX or pad co-expressed Fdc protein (denoted FdcUbiX). Purified FdcUbiX has a distinct UV-Vis spectrum [Fig 1b] and catalyses reversible decarboxylation of a wide range of aromatic carboxylic acids in vitro [Fig 1c-d, Ext Data Fig 1]. Similar observations are made for Saccharomyces cerevisiae FdcUbiX, although in this case the corresponding Fdc single expressed protein (but not FdcUbiX) weakly binds FMN [Ext Data Fig 2]. During the review stage, similar observations for the S. cerevisiae Fdc reported elsewhere, although the Fdc cofactor was not identified20.
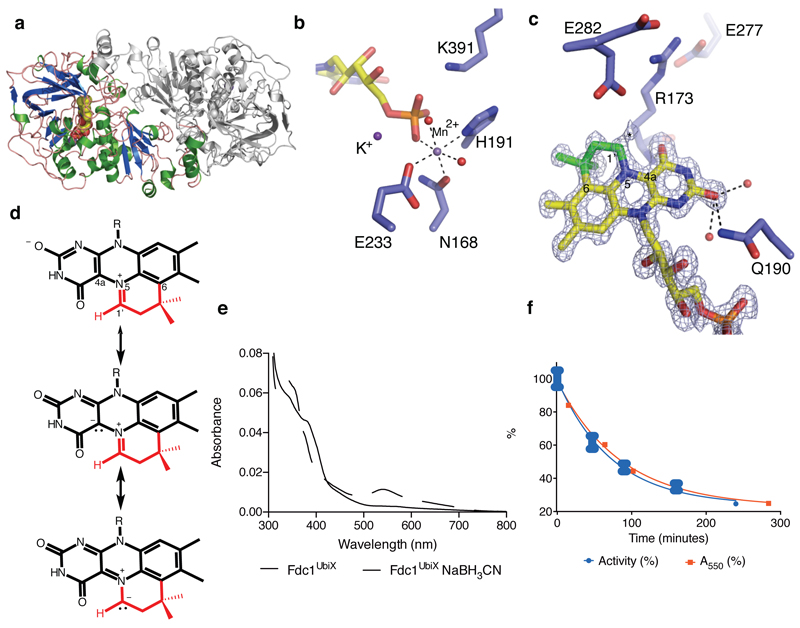
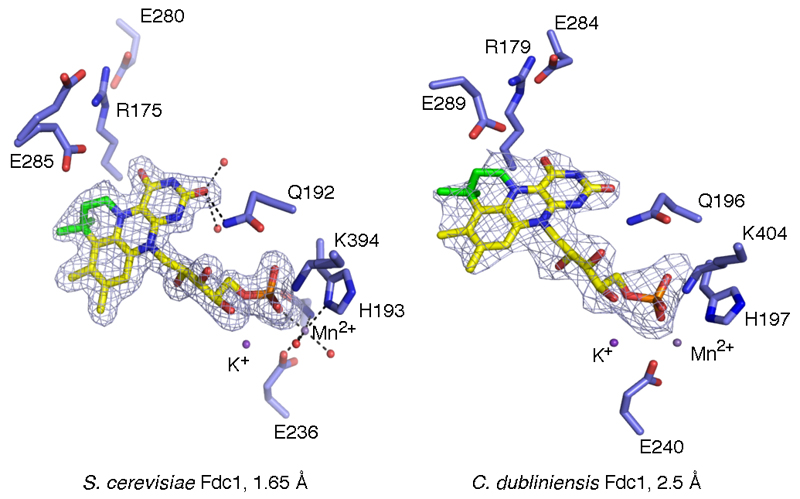
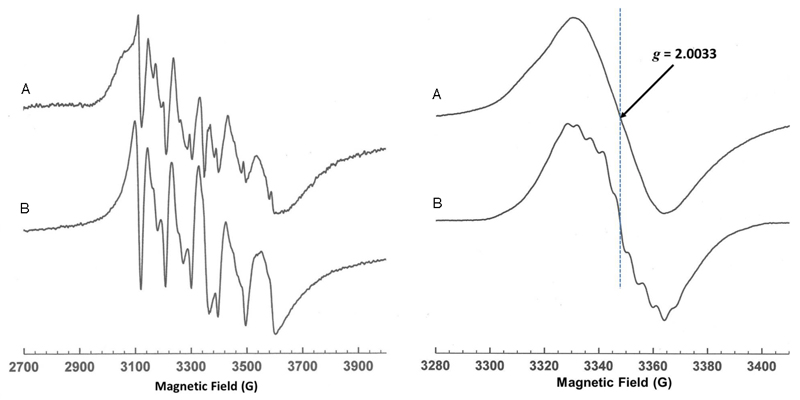
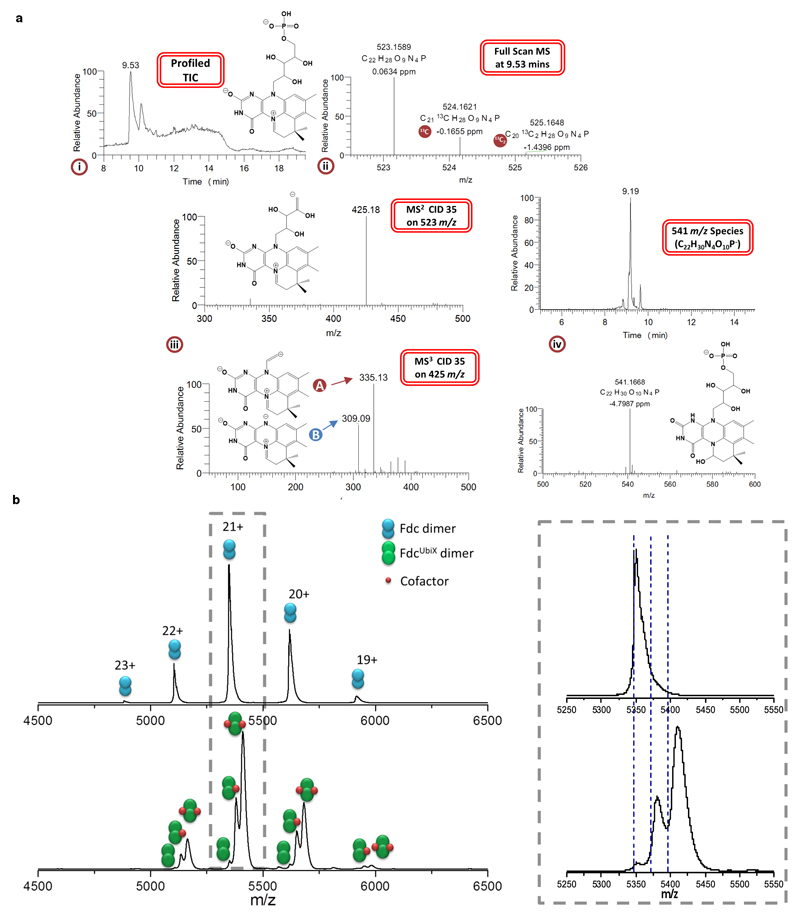
Crystal structures of A. niger, Candida dubliniensis and S. cerevisiae FdcUbiX reveal a heavily modified FMN cofactor is bound by these enzymes [Fig 2, Ext Data Fig 3]. The modified FMN phosphate is bound in complex with metal ions, similar to the distantly related FMN-binding protein from Methanobacterium thermoautotrophicum21. The electron density suggests both Mn2+ and K+ ions are present, and Mn2+ binding can be detected using EPR [Ext Data Fig 4]. Early studies on E. coli UbiD revealed activation by both Mn2+ and an unidentified cofactor3. The electron density for the modified FMN reveals extensive modification has occurred at both N5 and C6 positions, effectively adding a fourth ring to the isoalloxazine moiety [Fig 2b]. The atomic resolution obtained for A. niger FdcUbiX allows identification of the cofactor structure as an isopentenyl-adduct to the flavin N5-C6 (prFMN) [Fig 2c]. The branched nature of the isopentenyl adduct and the position of the covalent linkages with the flavin suggest this modification is achieved through prenylation. In the accompanying paper, we show UbiX indeed acts as a flavin prenylase enzyme that can support Fdc activation in vitro10. Activation is dependent on the presence of oxygen, suggesting the reduced prFMN UbiX product is oxidized to the corresponding flavo-N5 iminium adduct (prFMNiminium). The presence of the oxidized prFMN is confirmed by high resolution mass spectrometry of both the isolated cofactor and native mass spectrometry of the FdcUbiX protein [Fig 2d and Ext Data Fig 5]. Furthermore, complete inactivation of FdcUbiX was achieved using the mild reductant sodium cyanoborohydride. Upon reoxidation of the sodium cyanoborohydride inactivated enzyme, a radical species is formed with UV-VIS and EPR properties similar to that of the prFMN. radical species detected during non-physiological oxidation of the UbiX-prFMN complex10 [Fig 2e, Ext Data Fig 4]. Furthermore, the amount of prFMN. radical formed is proportional to the levels of enzyme activity obtained prior to cyanoborohydride inactivation [Fig 2f], suggesting that enzyme inactivation occurs by modification (likely hydrolysis) of the active prFMN species.
Fig 2. FdcUbiX crystal structures.
a) Crystal structure of the A. niger FdcUbiX. The monomer present in the asymmetric unit is depicted in cartoon format (helices in green, sheets in blue) while the symmetry related monomer forming the FdcUbiX dimer is shown in grey. b) Detailed view of Mn2+ binding site, linking the modified FMN phosphate group to the protein. c) Detailed view of the modified FMN cofactor. Omit electron density map corresponding to the bound cofactor contoured at 5 sigma. A 4th ring (non-isoalloxazine derived atoms are shown in green) can clearly be observed. An asterisk indicates the position of additional weak electron density at the C1 position, that can be accounted for by partial hydrolysis. Key residues involved in polar interactions with the isoalloxazine derived cofactor moiety are shown in sticks. d) Chemical structure of the modified FMN bound by A. niger FdcUbiX as derived from atomic resolution density and high resolution mass spectrometry [Ext data Fig 5]. Atoms derived from dimethylallylmonophosphate are shown in red10. The azomethine ylide resonance form is shown below. e) Oxidation of cyanoborohydride inactivated FdcUbiX leads to formation of a purple species, similar in UV-Vis and EPR spectral properties [Ext Data Fig 4] to that observed for the oxidized UbiX-prFMN complex10. f) Following purification, FdcUbiX activity gradually decreases when incubated on ice, and formation of the purple prFMN radical following NaBH3CN treatment follows a similar trend (error bars are s.d. n=3).
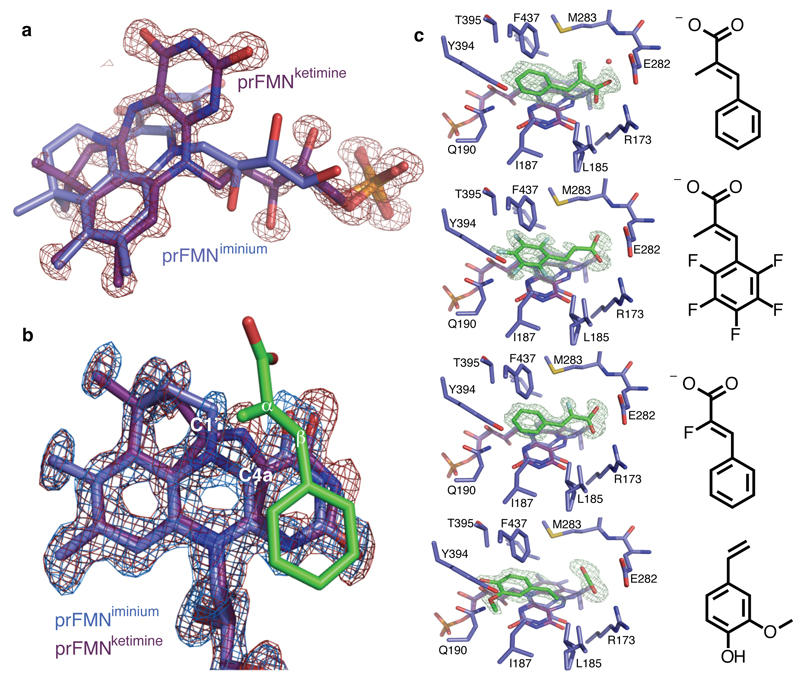
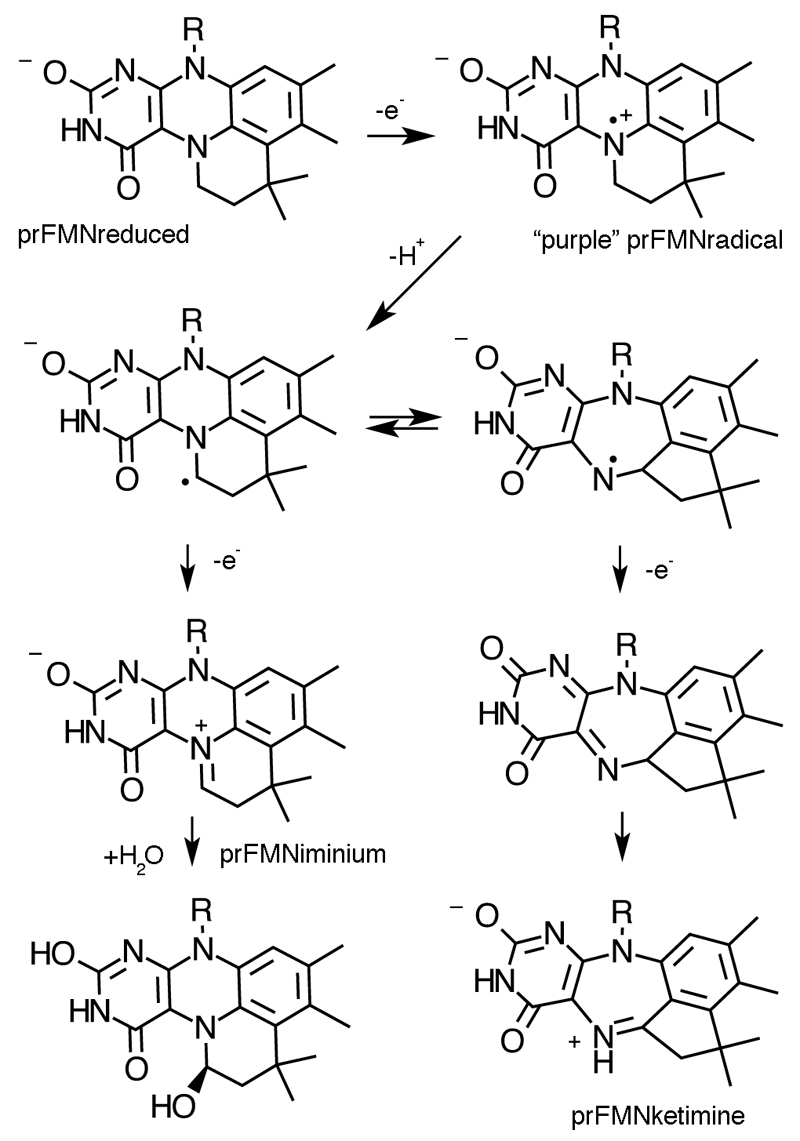
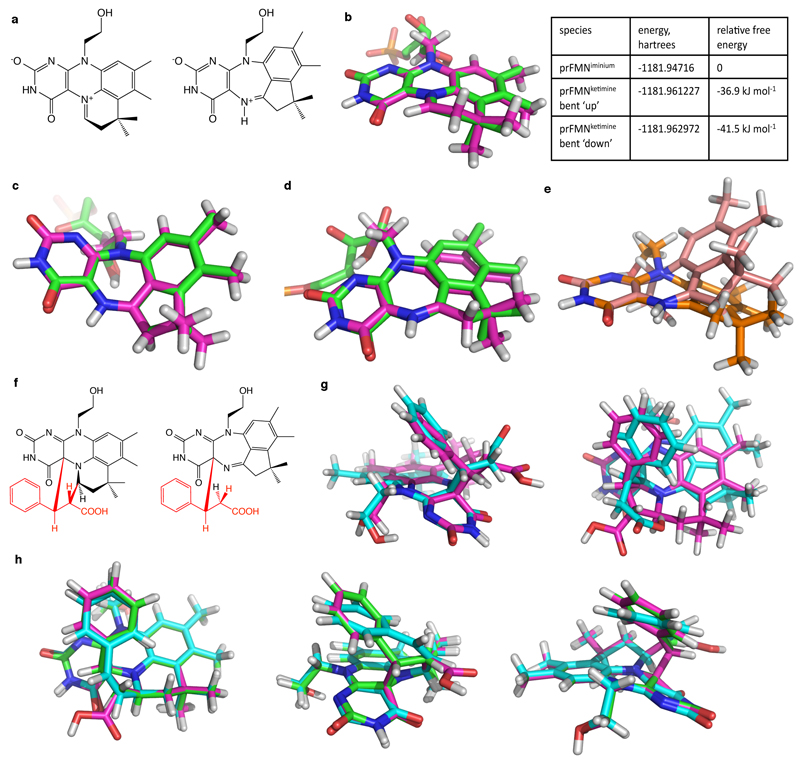
Marked heterogeneity of the prFMNox cofactor is observed in the A. niger FdcUbiX WT crystal structures, with older crystal samples revealing an increased population of a hydroxylated prFMNiminium. The latter species could also be observed by high resolution mass spectrometry [Ext Data Fig 5a]. Surprisingly, a distinct prFMNox isomer (prFMNketimine) can be observed for most A. niger Fdc crystals, although it is not detected in the C. dubliniensis or S. cerevisiae crystals [Fig 3a]. This form contains an altered isoalloxazine ring structure, a likely consequence of isomerisation of the extended ring system during oxidative maturation of the prFMN cofactor. We propose this isomerisation step occurs during the stepwise oxidation of the reduced prFMN UbiX product, via a radical mechanism [Ext Data Fig 6]. The isomerisation leads to insertion of the prenyl C1’ carbon into the flavin isoalloxazine ring, creating a central seven-membered ring and converting the N5-iminium into a secondary ketimine. The conformation derived from density functional theory (DFT) calculations for the proposed prFMNketimine species is in close agreement with that observed in the crystal structure. The calculations indicate this species is 30-40 kJ/mol lower in gas phase free energy than the prFMNiminium species and can exist in two butterfly bent-like conformations of similar energy [Ext data Fig. 7].
Fig 3. FdcUbiX cofactor structure and ligand complexes.
a) Omit electron density map corresponding to a distinct isomer of the prFMN contoured 5 sigma. An expansion of the central ring of the isoalloxazine system can clearly be observed, with the distinct butterfly-bent conformation accompanied by altered conformation of the ribityl moiety. b) Detailed view of prFMNox isoforms in the FdcUbiX-substrate complexes. The omit electron density maps corresponding respectively to the prFMNiminium (in blue) and prFMNketimine (in red) species each contoured 5 sigma are shown for the alpha-methyl-cinnamic acid complex. c) A series of FdcUbiX substrate/product complexes. Selected active site residues of FdcUbiX are shown in atom colour sticks, with the omit electron density contoured at 5 sigma corresponding to respectively alpha-methyl-cinnamic acid, pentafluorocinnamic acid, alpha-fluorocinnamic acid and 4-vinyl-guaiacol.
To obtain insights into the catalytic mechanism, A. niger FdcUbiX crystals were soaked with a range of trans-cinnamic acid related compounds. The corresponding enzyme-substrate complexes clearly reveal substrates are stacked directly above the prFMNox ring system [Fig 3b,c]. Again, electron density for both the iminium and ketimine species can be detected in the atomic resolution density maps, the latter adopting a more planar conformation of the extended ring system in order to accommodate substrate binding [Fig 3b,c and Ext Data fig 7]. The substrate enoic acid double bond is positioned directly above the C4a of both the prFMNox species. While the aryl-group of all substrates tested occupies a similar position directly above the prFMN N1 atom, electron density corresponding to the carboxylate moiety is distinct for each substrate [Fig 3c]. Although clear electron density for the pentafluorocinnamic acid carboxylate is lacking, both alpha-methyl- and alpha-fluorocinnamic acid carboxylate groups can be observed. Both occupy a position vacated by reorientation of the conserved E282, and establish polar contacts with R173 and the amide nitrogen of M283. In case of alpha-methyl-cinnamic acid, the carboxylate is within hydrogen bonding distance of the N5 secondary ketimine group of the prFMNketimine form. A complex with the decarboxylation product 4-vinyl guaiacol (a distinct flavouring agent obtained by yeast mediated decarboxylation of ferulic acid) reveals a similar position for the aryl-moiety [Fig 3c]. The vinyl group is placed directly above the prFMNox C4a, in close proximity of electron density resembling a bound CO2 molecule.
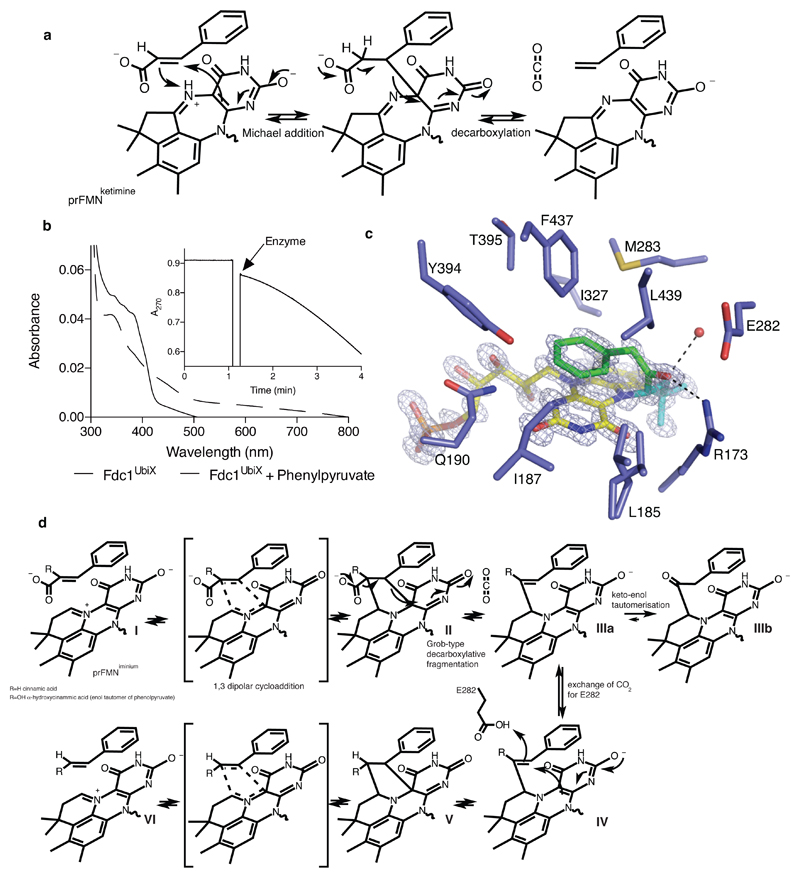
At first glance, the position of the substrate α,β-unsaturated carbonyl directly above the prFMNox C4a suggests the possibility of transient formation of a prFMNox C4a - substrate beta-carbon bond reminiscent of Michael addition-like chemistry and other flavin catalysed reactions22. This mechanism has similarities to the amidohydrolase-type decarboxylases, where nucleophilic attack by a metal-bound hydroxide ion is postulated to lead to transient C=C bond cleavage of an enoic acid moiety leading to decarboxylation13,23. In case of Fdc1, C=C bond cleavage should proceed with concomitant protonation of the alpha carbon to allow decarboxylation. Our structural dta suggests the N5 secondary ketimine of prFMNketimine could acts as a likely acid-base catalyst, providing a rationale for both FMN modification and rearrangement [Fig 4a; Ext data fig 7b]. However, although our solution MS and chemical inhibition data cannot distinguish between both iminium and ketimine cofactor isomers, solution data presented in Fig 1e-f suggests prFMNiminium is the catalytically relevant species.
Fig 4. FdcUbiX mechanism.
a) Proposed mechanism for FdcUbiX catalysis using the prFMN ketimine form. b) Incubation of FdcUbiX with phenylpyruvate leads to changes in the UV-Vis spectrum. The inset shows conversion of cinnamic acid to styrene (monitored at 270nm) after addition of phenylpyruvate treated FdcUbiX. c) Active site of FdcUbiX in complex with a phenylpyruvate derived adduct. The omit electron density map (contoured at 7 sigma, in blue) corresponding the prFMNiminium-phenylpyruvate adduct is shown. Atoms derived from phenylpyruvate are depicted in green. d) Proposed mechanism for FdcUbiX catalysis and phenylacetaldehyde adduct formation of the prFMNiminium form.
To determine which prFMNox isomer supports catalysis by FdcUbiX and provide further insight into the likely mechanism, we sought to determine the structure of a covalent substrate-cofactor adduct. When A. niger FdcUbiX protein is incubated with phenylpyruvate, for which the corresponding enol-tautomer α-hydroxycinnamic acid (present as a minor population in solution) closely resembles the cinnamic acid substrate, the UV-Vis spectrum is altered [Fig 4b]. Similar observations are made when incubating with phenylacetaldehyde. Furthermore, incubation with phenylpyruvate or phenylacetaldehyde leads to reversible enzyme inhibition, with a gradual increase of enzyme activity upon removal of excess phenylpyruvate [Fig 4b]. The corresponding crystal structure of A. niger FdcUbiX incubated with phenylpyruvate reveals a covalent adduct formed between the prenyl-C1’ of the prFMNiminium cofactor and a substrate-derived entity [Fig 4c]. Atomic resolution electron density reveals the latter clearly corresponds to a phenylacetaldehyde adduct, a species that can be formed following decarboxylation of α-hydroxycinnamic acid and tautomerisation of the corresponding α-hydroxystyrene prFMNiminium adduct [Fig 4d, species IIIb]. The reversible inhibition observed can be accounted for by the fact the corresponding enol-keto tautomer equilibrium is in favour of the off-pathway phenylacetaldehyde adduct.
This observation further confirms that prFMNiminium is the catalytically relevant species, and the unexpected presence of a C1’- substrate alpha-carbon bond suggest a distinct mechanism from that of the amidohydrolase-type decarboxylases occurs [Fig 4d]. Fluorination of the substrate beta-carbon or the aromatic group has only a modest effect on catalysis (Fig 1d). Furthermore, simple enoic acids also act as substrates, as prolonged incubation of FdcUbiX with these substrates does lead to formation of the corresponding terminal alkenes (i.e. alpha-olefins) at modest levels [Ext data Fig 8]. Both observations argue against formation of transient ionic species.
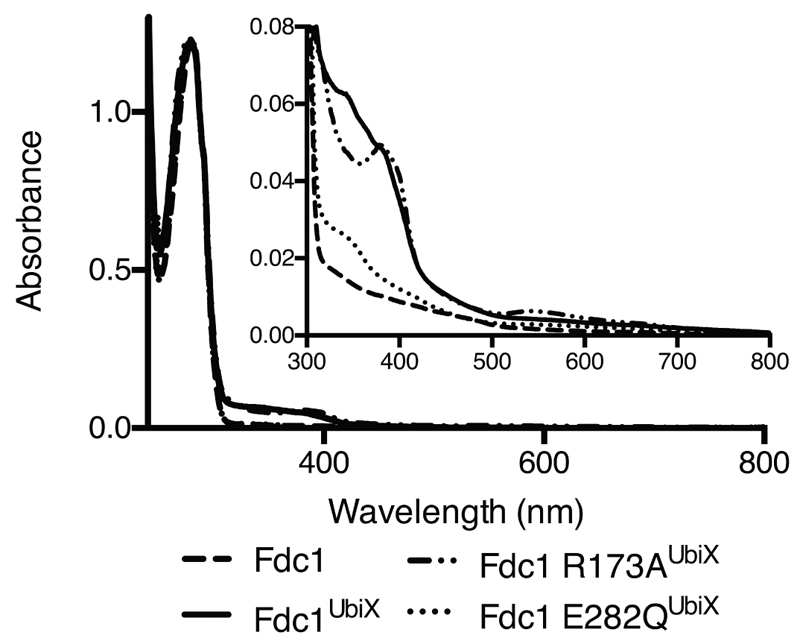
In fact, the neutral form of the prFMNiminium has distinct azomethine ylide character (a well-known 1,3-dipole) that is positioned directly adjacent to the substrate α,β-unsaturated carbonyl (a dipolarophile) by the enzyme. Thus, we propose a 1,3-dipolar cycloaddition between the substrate and the prFMNiminium azomethine ylide form leads to a transient covalent substrate-prFMNiminium pyrrolidine adduct, establishing covalent bonds with both C1’ and C4a (species II). Ample precedent is available for the concerted 1,3-dipolar cycloaddition between azomethine ylides and α,β-unsaturated carbonyls in organic chemistry11–12. Whether the proposed Fdc1 mediated cycloaddition occurs through a single pericyclic transition state cannot be established at this stage. Fragmentative decarboxylation (i.e. Grob-type fragmentation24) of the pyrrolidine adduct II can occur coupled to breaking the beta carbon-prFMN C4a bond. This leaves a single bond connecting the substrate alpha-carbon with the C1’ of prFMNiminium (species IIIa), as observed in the phenylpyruvate adduct IIIb. We propose protonation by E282 concomitant with formation of a second pyrrolidine adduct (species V) leads to product formation (species VI) via a retro 1,3-dipolar cycloaddition. Together with R172 and E277, E282 forms a network of polar interactions that is conserved throughout the UbiD/Fdc family. The R173A, E277Q and E282Q variants of FdcUbiX are all inactive, and display altered UV-Vis properties, suggesting these mutations also impact on cofactor maturation [Ext Data Fig 9].
The modification of the flavin isoalloxazine ring through prenylation at N5 and C6, followed by oxidation drastically alters and expands the flavin chemical repertoire22. Oxidation of the N5-prenyl adduct bond leads either to the corresponding iminium adduct or, when coupled to ring isomerisation, a secondary ketimine adduct. Both species have azomethine ylide character and distinct catalytic potential. In the Fdc/UbiD enzyme family, the prFMNiminium form supports reversible decarboxylation of a wide range of (aromatic) substrates. While the [3+2] reaction between azomethine ylide dipoles and alkene dipolarophiles has been extensively used in organic chemistry11–12, the mechanism proposed here would present the first example of a biological [3+2] reaction. Combined with the recent description of both natural25 and artificial26 bona fide [4+2] cycloaddition catalysing enzymes, this hints at more widespread use of pericyclic reaction chemistry in Nature. As Fdc/UbiD enzymes have evolved from an NADH:FMN oxidoreductase module8,21, the distinct possibility exists that other unrelated prFMN-dependent enzymes might have developed from distinct flavin-binding modules. Such distinct prFMN-dependent enzymes could make use of different aspects of the prFMN chemistry, as occurs with other organic cofactors27. Indeed, artificial flavoenzymes containing N5-alkylated flavins have been created that are capable of H2O2-driven enantioselective sulfoxidations28, utilising the fact N5-alkylated flavins can form remarkably stable 4α-peroxyflavins and are powerful oxidising catalysts29. It is possible similar enzymes already exist in Nature.
Material and methods
Cloning
The S. cerevisiae, C. dubliniensis and A. niger fdc genes were codon optimized and synthesised (Genscript). The A. niger fdc1 gene was cloned into the NdeI and XhoI sites of pET30a and the S. cerevisiae and C. dubliniensis genes were cloned into the NdeI and XhoI sites of pET21b. E. coli ubiX was cloned into the NdeI and XhoI sites of pET21b and pET30a. A. niger fdc1 pET30a was transformed into E. coli BL21(DE3) with and without ubiX pET21b and S. cerevisiae and C. dubliniensis fdc1 pET21b with and without ubiX pET30a.
Mutagenesis
Mutagenesis primers were designed using the QuikChange® Primer Design Program (http://www.genomics.agilent.com/primerDesignProgram.jsp). PCR was performed using Phusion polymerase (NEB). Template was removed by DpnI (NEB) digest and the PCR product transformed into E. coli NEB5α. Once the presence of the desired mutation was confirmed by DNA sequencing, the plasmid was co-transformed with the appropriate ubiX construct into E. coli BL21(DE3).
Protein Expression and Purification
Protein was expressed in BL21(DE3) grown at 37 °C/180 rpm in LB broth supplemented with 50 μg/ml kanamycin and/or 50 μg/ml ampicillin. At mid-log phase cells were induced with 0.25 mM IPTG and supplemented with 1 mM MnCl2, grown overnight at 15 °C/180 rpm and then harvested by centrifugation (4 °C, 7000 g for 10 minutes). Cell pellets were resuspended in buffer A (200 mM NaCl, 1 mM MnCl2, 50 mM Tris pH 7.5) supplemented with DNase, RNase, lysozyme (Sigma) and Complete EDTA-free protease inhibitor cocktail (Roche). Cells were lysed using a French press at 1500 psi and the lysate clarified by centrifugation at 125,000 g for 90 minutes. The supernatant was applied to a Ni-NTA agarose column (Qiagen). The column washed with 3 column volumes of buffer A supplemented with 10 mM imidazole and protein eluted in 1 ml fractions with buffer A supplemented with 250 mM imidazole. Samples were subjected to SDS-PAGE analysis and fractions found to contain the purified protein were pooled. Imidazole was removed using a 10-DG desalting column (Bio-Rad) equilibrated 100 mM NaCl, 1 mM MnCl2, 25 mM Tris pH 7.5. Protein was aliquoted and flash frozen until required.
UV-Vis spectroscopy/protein quantification
UV-Vis absorbance spectra were recorded with a Cary UV–Vis spectrophotometer. The protein concentration A. niger Fdc1 and S. cerevisiae Fdc1 was estimated using ε280 = 68870 M-1 cm-1 and ε280 = 63830 M-1 cm-1 (calculated from the primary amino acid sequence using the ProtParam program on the ExPASy proteomics server) respectively.
UV-Vis Decarboxylation assays
For substrates with two or more double bonds conjugated to the acid group initial rates were determined by following consumption of substrate by UV-vis spectroscopy using a Cary 50 Bio spectrophotometer (Varian). Assays were performed against various concentrations of substrate in 350 μl 50 mM KCl, 50 mM NaPi pH 6 in a 1 mm path length cuvette at 25 °C. The rate of 2,3,4,5,6-penta-fluorocinnamic acid consumption was monitored at 260 nm, α-fluorocinnamic acid at 265 nm, cinnamic acid at 270 nm and sorbic acid at 260 nm. Extinction coefficients for each substrate were calculated from a range of standards and found to be ε260 = 20000 M-1 cm-1 for 2,3,4,5,6-penta-fluorocinnamic acid, ε265 = 20000 M-1 cm-1 for α-fluorocinnamic acid ε270 = 20000 M-1 cm-1 for cinnamic acid and ε260 = 24000 M-1 cm-1 for sorbic acid, the latter two values being in good agreement with the literature30,31.
A. niger Fdc1 phenylpyruvate inhibition
Na phenylpyruvate powder was added to the protein until there was no further change in the ~A380 spectrum. Any precipitate was removed by centrifugation at 16100 g and excess phenylpyruvate in solution removed using a 10-DG desalting column (BioRad).
A. niger Fdc1 Inactivation timecourse
Enzyme was thawed and incubated on ice. The enzyme was assayed against cinnamic acid at various time points and the level of activity expressed as a percentage of that of freshly thawed protein (0 min). At various time points samples were also treated with NaBH3CN powder, centrifuged at 16100 g for 15 minutes and UV-vis spectra recorded.
GC Headspace Decarboxylation assays
500 μl 10 mM substrate (2-hexenoic acid, 2-heptenoic acid 2-octenoic or 2-nonenoic acid), 50 mM KCl, 50 mM NaPi pH 6 in a 2 ml GC vial was incubated with or without enzyme at 25 °C with continuous shaking. 0.5 ml head space volume was manually drawn off, and injected into the GC with a syringe-lock needle. A Varian 3800 GC equipped with a DB-WAX column (30 m x 0.32 mm x 0.25 μm film thickness, JW Scientific) was used to detect and quantify 1-alkenes produced during the enzyme reactions. The column temperature was programmed as follows: 40 °C hold for 2 min, to 150 °C at 20 °C min-1. The injector temperature was 250 °C (10:1 split), and the FID temperature was set at 250 °C. The carrier gas was helium at a flow rate of 1 ml min-1. Product identification and quantification was achieved by comparison with pure 1-alkene standards.
Carboxylation HPLC assays
10 mM styrene, 100 mM NaPi pH6, 3M NaHCO3 (final pH 7.5), were incubated with and without enzyme at 25 °C overnight. The sample was centrifuged at 16100 g to remove precipitate and 100 µl added to 900 µl 50% v/v H20/acetonitrile. Sample analysis was performed using an Agilent 1100 Series HPLC equipped with a UV detector. The stationary phase was a Kinetex 5μm C18 100A column, 250 × 4.6 mm. The mobile phase was acetonitrile/water (50/50) with 0.1 % TFA at a flow rate of 1 ml/min, and detection was performed at a wavelength of 264 nm.
EPR
NaBH3CN powder was added to Fdc1UbiX (215 μM). The samples were incubated on ice and UV-vis spectra recorded until the purple colour (A550) reached a maximum. The samples were centrifuged to remove any remaining powder or effervescence, 300 μl sample transferred to an EPR tube and frozen in liquid nitrogen. EPR spectra were obtained using a Bruker ELEXSYS E500 EPR spectrometer equipped with a Super High Q (ER 4118-SHQ) resonator. Temperature control was effected using an Oxford Instruments ESR900 cryostat connected to an ITC 503 temperature controller from the same manufacturer.
Protein crystallisation and structure determination
Crystallisation was performed by vapour diffusion. Initial screening of 0.3 μl 14 mg/ml A. niger Fdc1 in 100 mM NaCl, 25 mM Tris pH 7.5 and 0.3 μl reservoir solution at 4°C resulted in a number of hits including PACT condition F4 (molecular dimensions). Seed stock produced from these crystals was used in an optimization screen based around 0.2 M potassium thiocyanate, Bis-Tris propane 6.5, 20 % w/v PEG 3350 mixing 0.05 μl seed stock, 0.25 μl protein solution and 0.3 μl reservoir solution at 4°C. For S. cerevisiae Fdc1, crystals were obtained using 0.3 μl 25mg/ml in 20mM potassium phosphate, 200mM NaCl pH 7.5 and 0.3 μl 0.2M calcium acetate, 20% PEG 3000 at 4°C. Crystals for C. dubliniensis were obtained at 4°C using 0.3μl 18mg/ml C. dubliensis Fdc1 in 100 mM NaCl, 1 mM MnCl2, 25 mM Tris pH 7.5 and 0.3μl of 0.2 M potassium thiocyanate, sodium acetate pH 5.5 and 15% w/v PEG 4000.
All crystals were cryoprotected in mother liquor supplemented with 10% PEG 200 and flash cooled in liquid nitrogen. Diffraction data was collected at Diamond beamlines at 100K and processed using the CCP4 suite32. Data was reduced and scaled using XDS33. Following molecular replacement using as a starting model, the structures of A. niger and S. cerevisiae Fdc WT and complexes were refined using REFMAC532, and refined by cycles of manual rebuilding in COOT. Ligand coordinates and definitions were generated using the GlycoBioChem PRODRG2 server (http://davapc1.bioch.dundee.ac.uk/cgi-bin/prodrg). The data and refinement statistics are available in Extended Data Table 1.
Native mass spectrometry
Protein was buffer exchanged into 100 mM ammonium acetate using a 10-DG desalting column (BioRad). Native mass spectrometry experiments were carried out on a Synapt G2 instrument (Waters, Manchester, UK) with a nanoelectrospray ionisation (nESI) source. Mass calibration was performed by a separate infusion of NaI cluster ions. Solutions were ionised through a positive potential applied to a platinum wire of thickness 0.125 mm (Goodfellow) inserted into a thin-walled glass capillary (inner diameter 0.9mm, outer diameter 1.2mm, World Precision Instruments, Stevenage, UK) that was pulled to a nESI tip in house with a Flaming/Brown micropipette puller (Sutter Instrument Co., Novato, CA). Fdc samples (5-10μM) were sprayed from 100mM ammonium acetate pH, 6.8. Capillary voltage 1.6 kV, sample cone voltage 80-90V, extractor cone voltage 3V, backing pressure 5 mbar, source temperature 50°C, Trap gas flow 0.4-5 ml/min. Data were processed using Masslynx V4.1 software and Originlab 9.0.
Mass spectral analysis of the extracted Fdc cofactor
Protein was buffer exchanged into deionised H2O using a 10-DG column. 4 μl 1M ammonium acetate was added to 200 μl protein solution. The protein was precipitated and cofactor released with addition of 200 μl acetonitrile and incubation at 70°C for 5 min before centrifugation at 16100 g to remove the precipitate.
All solvents were of HPLC-MS Grade purity purchased from Sigma–Aldrich (Gillingham, UK). HPLC grade formic acid was purchased from Fisher Scientific (Loughborough, UK). Mass spectrometer calibration solution and chromatography columns were purchased from Thermo-Fisher Scientific (Hemel Hempstead, UK).
All UHPLC-MS work was carried out on a Thermo-Finnigan Orbitrap-LTQ XL™ hybrid mass spectrometer operated in negative ionization mode coupled to a Thermo Accela autosampler (Fisher Scientific, Bremen, Germany). Chromatographic separations were adapted from work carried out by Fu and co-workers34 and performed on a Thermo Hypersil Gold 2.1µm C18 column at a solvent flow-rate of 400 µl min−1. For initial profiling tests the column was eluted with 0.1% formic acid in water (A) and 0.1% formic acid in acetonitrile (B). The solvent composition during gradient elution was initiated with 5% (B) for 5 min and subsequently ramped to 95% (B) over 15 min, followed by a 5 min isocratic elution at 95% (B) before a return to 95% (A) held for further 5 min for column equilibration. All samples were maintained 4 °C within the autosampler refrigerator whilst the column was maintained at 50°C within the autosampler oven. Mass calibration was carried out in accordance with the manufacturer’s guidelines using caffeine (20 µg/ml), the tetrapeptide MRFA (1 µg/ml) and Ultramark 1621 (0.001%) in an aqueous solution of acetonitrile (50%), methanol (25%) and acetic acid (1%).. Acquisition settings for initial profiling were carried out at 60,000 resolution in centroid and ran at 1 µ-scan per 400ms in the 100-1000 m/z range with source gasses set at Sheath Gas = 40 arb units, Aux Gas =5 arb units, Sweep Gas = 5 arb units. The ESI source voltage was set to 4.2V, and capillary ion transfer tube temperature set at 275°C.
Mass fragmentation analysis was carried out with the same column chemistry, source settings and flow rate but with an isocratic solvent elution of 55% (A) / 45% (B), an optimum composition determined for eluting the analyte of interest, based on the initial elution profile described above. MS source, samples storage/column was kept under identical conditions. Collision Induced Dissociation (CID) settings were set up to trap ions 523 m/z with an isolation width of 1.0 m/z, normalized collision energy of 35, activation Q of 0.250 and activation time of 30 ms.
DFT calculations
Density function theory (DFT) models were optimised in the gas phase using the B3LYP/6-311++G(d,p) or BH&H/6-311++G(d,p) level of theory implemented in Gaussian 09 (ref. 35). Models are shown in Extended data Fig. 7 and structural alignments to the crystal coordinates were performed using Swiss-PdbViewer version 4.1 (ref 36). Harmonic vibrational frequencies calculated using normal mode analysis were used to confirm that optimised geometries were always in local or global minima, and to calculate relative free energies.
Extended Data
Extended Data Fig 1.
HPLC chromatogram demonstrating enzymatic carboxylation of styrene by A. niger Fdc1UbiX. Chromatogram of a 10 mM styrene and saturating NaHCO3 solution incubated in the absence (blue) and presence (red) of the A. niger Fdc1UbiX enzyme.
Extended Data Fig 2.
S. cerevisiae FdcUbiX solution data. The left panel is a direct comparison to main Fig 1b. In this case, the non-UbiX coexpressed Fdc1 binds FMN weakly. The right panel shows S. cerevisiae FdcUbiX steady state kinetic data obtained with cinnamic acid. Error bars are s.e.m. n=3
Extended Data Fig 3.
A detailed view of the S. cerevisiae and C. dubliniensis FdcUbiX active site. The omit map corresponding to the prFMN cofactor is shown in a blue mesh contoured at 3 sigma. Atoms derived from dimethylallyl phosphate are shown in green. Both FdcUbiX crystals appeared colourless as observed for A. niger Fdc1UbiX, indicating neglible FMN binding.
Extended data Fig 4.
Left panel. X-band continuous wave frozen solution EPR spectra of a) Fdc1 and b) Mn(H2O)62+ showing the characteristic six line pattern arising from the ms = ± ½ spin manifold of the S = 5/2 Mn2+ ion. The six line pattern reflects hyperfine coupling to the I = 5/2 55Mn nucleus and is sensitive to the environment of the ion, thus the differences between a) and b) indicate binding of Mn2+ to the enzyme.. Experimental conditions: microwave power 0.5 mW, modulation amplitude 7 G, temperature 20 K. Right panel. X-band continuous wave frozen solution EPR spectra of a) FdcUbiX reduced using sodium cyanoborohydride (NaBH3CN) and subsequently exposed to air. b) WT UbiX + DMAP reduced with dithionite and reoxidised with oxygen. Experimental conditions: microwave power 10 μW, modulation amplitude 1.5 G, temperature 20 K. Re-reduction using NaBH3CN of the modified cofactor formed in FdcUbiX (prFMNiminium)gives rise to a radical on air oxidation with the same g value (gav) and line width as that formed on the modified flavin (prFMN) in UbiX. However, the lack of the distinctive fine structure in a) that is normally observed for the UbiX radical, b), suggests heterogeneity in the FdcUbiX radical or possibly a magnetic interaction with the nearby Mn2+ ion in Fdc.
Extended Data Figure 5.
a (i) Structural elucidation of the reduced UbiD/Fdc1 co-factor. Full scan TIC created under a gradient elution using H2O/ acetonitrile both containing 0.1% formic acid indicating a major peak apex at 9.53 mins with a 52/48 solvent composition. Also shown is the proposed structure of 523 m/z. Mass spectrum taken at major peak apex in (ii) (9.53 mins) indicating an associated full scan molecular ion peak with m/z = 523.1589 (M+ = C22H28N4O9P) at a resolution of 58501 with a mass accuracy of 0.06 ppm. Also eluting alongside the target molecule are two isotopic variants containing 13C and 13C2. The 13C peak is displaying a relative abundance of 22 to the 523m/z peak which is in line with the number of carbon atoms contained within the structure. Fragmentation of the 523.16 m/z molecular ion peak (iii) in an automated data dependent manner using helium based-chemical induced dissociation (CID level 35) generated a spectral tree that indicates the removal of the phosphate head group at the MS2 level generating 425.18 m/z. Subsequent MS3 level activation (CID 35) on 425.18 m/z partially (A) or completely (B) removing the tail group from the newly formed 4-ring system generating 335.13 m/z or 309.09 m/z, respectively. The presence of an oxidised species with 541 m/z is also reported (iv).
b Native mass spectra of Fdc (top) and FdcUbiX (bottom). Fdc presents in charge states 19+ to 23+ while FdcUbiX in charge states 19+ to 22+. Right hand spectrum; an enlarged view of the 21+ charge state. The predicted masses are shown by blue dashed lines. The spectrum of FdcUbiX shows that approximately two thirds of the ions have 2 non-covalently bound cofactors, approximately one third have one non-covalently bound cofactor and there is a small amount with no cofactor bound. Fdc contains no cofactor. The measured mass of the Fdc dimer is 112 265 Da (predicted mass from sequence is 112 270 Da). The measured mass for the apo form of FdcUbiX is 112 345 Da, slightly higher than for Fdc which is attributed to an increased retention of salt. The mass difference of +80 Da corresponds to the mass of 2 potassium adducts. For the FdcUbiX species with one bound cofactor, the measured mass (112 968 Da) is 178 Da higher than predicted. The predicted mass corresponds to the left hand side of the peak which is the protein+cofactor with no extra salt retained. The extra mass could be attributed to 2 Mn2+ ions and 2 K+ ions. The FdcUbiX bound to 2 cofactors has a measured mass of 113 583 Da which is 268 Da larger than expected. Again, however, the predicted mass corresponds to the left hand side of the peak. These spectra indicate that the protein dimer carries either 1 or 2 cofactors of 525 Da, along with a variety of other salt adducts. The extent of adductation is higher for FdcUbiX and increases with bound co-factors, indicating that the addition of the cofactor recruits counter ions.
Extended Data Fig 6.
A proposed mechanism for cofactor maturation in FdcUbix through oxidation. We propose the prFMNreduced cofactor produced by UbiX is bound by apo-Fdc and oxidized in a stepwise manner. While the initial radical species resembles that observed during non-physiological oxidation of the prFMNreduced:UbiX product complex10, we proposed that in the Fdc enzyme proton abstraction from the prFMN radical C1’ leads to a distinct radical species. The latter can either be oxidized further to the corresponding prFMNiminium or, via a radical based isomerisation process, form the central seven-membered ring ultimately leading to prFMNketimine.
Extended Data Fig 7.
DFT models of the proposed prFMNiminium and prFMNketimine isomers and their substrate adducts. a) Chemical structures of the prFMNiminium and prFMNketimine models. DFT models (pink carbons) are overlaid with crystal coordinates (green carbons) of prFMNiminium b) and the two butterfly bent conformations of prFMNketimine c) and d). The substrate-free (bent ‘up’) prFMNketimine is shown in c) and the more planar substrate-bound (bent ‘down’) in d). For comparison of the extent of the butterfly bending of prFMNketimine, the two DFT models in c) and d) are aligned over the 4 ring nitrogen atoms and overlaid in e). f) Chemical structures of the proposed initial prFMNiminium and prFMNketimine substrate adducts with the cinnamic acid substrate highlighted in red. The DFT-optimised structures of these species are overlaid in g) with the prFMNiminium species shown with pink carbons and the prFMNketimine species with teal carbons. Three projections of overlaid DFT models of the prFMNiminium species with substrate bound (pink carbons; reproduced from g), after substrate decarboxylation (teal carbons; substrate double bond is cis) and upon protonation of the substrate beta carbon (green carbons) are shown in h). Note that the substrate carboxylate was artificially protonated in these models to maintain charge neutrality. Models were geometry optimised in the gas phase using either the B3LYP/6-311++G(d,p) (panels a-e) or BH&H/6-311++G(d,p) (panels f-h)_level of theory. BH&H was chosen over B3LYP for the substrate adducts as BH&H has been shown to better describe pi-stacking interactions, which are likely to occur between the modified isoalloxazine and substrate phenyl moieties36. Harmonic vibrational frequencies calculated using normal mode analysis were used to confirm that optimised geometries of all species were in local or global minima. Absolute energies and relative free energies of the substrate-free species, determined from the normal mode calculations, are given in the table, top right. Cartesian coordinates of the optimised structures are given in Supplementary Information.
Extended Data Fig 8.
Gas chromatogram showing products formed from a solution of respectively 10 mM 2-hexenoic (1-pentene, blue; enzyme free control in black ), 10 mM 2-heptenoic (1-hexene, green; enzyme free control in black ) or 10 mM 2-octeneoic acid (1-heptene, black; enzyme free control in green). No product (1-octene, red) could be detect from 10 mM 2-nonenoic acid. Identification and quantification of 1-alkenes was based on known standards.
Extended Data Fig 9.
UV-vis spectra of Fdc1 (614 mM), Fdc1UbiX (492 mM), Fdc1 R173AUbiX (749 mM) and Fdc1 E282QUbiX (171 mM) normalised on the A280 peak. Inset, close up of the additional spectral features present in the 300 – 500 nm region.
Extended Data Table 1.
Data collection and refinement statistics
| A. niger Fdc1 (only prFMNiminium present) | A. niger Fdc1 (prFMNiminium + prFMNketimine) | A. niger Fdc1 + alpha-methyl cinnamic acid | A. niger Fdc1 + pnta-fluoro cinnamic acid | A. niger Fdc1 + alpha-fluoro cinnamic acid | A. niger Fdc1 + phenyl pyruvate | A. niger Fdc1 + 4-vinyl guaiacol | S. cerevisiae Fdc1 | C. dubliniensis Fdc1 | ||
|---|---|---|---|---|---|---|---|---|---|---|
| PDB code | 4ZA4 | 4ZA5 | 4ZA7 | 4ZA8 | 4ZAB | 4ZA9 | 4ZAA | 4ZAC | 4ZAD | |
| Data collection | ||||||||||
| Space group | P 21 21 2 | P 21 21 2 | P 21 21 2 | P 21 21 2 | P 21 21 2 | P 21 21 2 | P 21 21 2 | P 21 | P 21 | |
| Cell dimensions | ||||||||||
| a, b, c (Å) | 95.99 | 96.02 | 95.93 | 95.91 | 95.91 | 96.05 | 96.59 | 114.41 | 91.97 | |
| 63.93 | 63.79 | 64.16 | 64.20 | 64.20 | 63.85 | 64.47 | 96.18 | 64.55 | ||
| 87.63 | 87.72 | 87.73 | 87.79 | 87.79 | 87.68 | 87.89 | 116.64 | 96.05 | ||
| β (°) | 96.58 | 91.07 | ||||||||
| Resolution (Å) | 33.82-1.22 (1.25-1.22) | 48.01-1.10 (1.13-1.10) | 87.73-1.1 (1.13-1.10) | 64.81-1.06 (1.09-1.06) | 32.38-1.16 (1.19-1.16) | 63.85-1.01 (1.04-1.01) | 94.19-1.242 (1.274-1.242) | 54.19-1.65 (1.69-1.65) | 67.04-2.46 (2.52-2.46) | |
| Rpim | 3.7 (35.4) | 3.2 (37.7) | 3.5 (30.9) | 3.9 (33.9) | 3.8 (36.1) | 2.7 (31.4) | 3.1 (34.4) | 3.9 (39.2) | 9.1 (48.0) | |
| I/σI | 11.2 (2.0) | 12.6 (2.1) | 11.20 (2.4) | 12.8 (2.5) | 12.0 (2.3) | 14.3 (2.2) | 11.5 (2.0) | 11.0 (2.0) | 6.7 (1.7) | |
| Completeness (%) | 99.96 (99.99) | 99.97 (99.99) | 98.0(97.8) | 99.96 (99.98) | 99.9 (99.9) | 99.97 (99.99) | 98.9 (94.4) | 98.8 (99.7) | 99.8 (99.8) | |
| Redundancy | 6.1 (5.8) | 5.5 (3.6) | 4.2 (2.7) | 5.2 (3.6) | 4.2 (2.8) | 4.0 (2.2) | 6.5 (6.0) | 3.7 (3.8) | 3.4 (3.4) | |
| Refinement | ||||||||||
| Resolution (Å) | 33.82-1.22 (1.25-1.22) | 48.01-1.10 (1.13-1.10) | 30.05-1.10 (1.13-1.10) | 64.81-1.06 (1.09-1.06) | 32.38-1.16 (1.19-1.16) | 63.85-1.01 (1.04-1.01) | 94.19-1.25 (1.274-1.242) | 54.19-1.65 (1.69-1.65) | 67.04-2.46 (2.52-2.46) | |
| No. refelections | 152260 (8041) | 206025 (10689) | 203456 (10579) | 231449 (12068) | 175535 (9183) | 264342 (13893) | 146799 (7752) | 282233 (15010) | 39186 (1956) | |
| Rwork/ Rfree | 14.5/16.1 (23.6/26.4) | 14.5/15.6 (25.9/26.9) | 13.2/14.1 (20.7/21.2) | 14.79/16.61 (23.1/26.9) | 14.6/15.4 (23.0/23.5) | 12.99/14.50 (24.6/26.0) | 14.34/16.32 (25.4/30.0) | 16.44/19.23 (31.6/34.8) | 20.66/25.5 (35.2/44.2) | |
| No. atoms | 4595 | 4692 | 4649 | 4665 | 4694 | 4554 | 4661 | 17693 | 8213 | |
| B-factors | 9.81 | 10.71 | 10.25 | 10.321 | 9.83 | 9.38 | 11.07 | 24.8 | 26.1 | |
| R.m.s deviations | ||||||||||
| Bond lengths (Å) | 0.028 | 0.028 | 0.028 | 0.029 | 0.031 | 0.029 | 0.026 | 0.032 | 0.017 | |
| Bond angles (°) | 2.384 | 2.485 | 2.469 | 2.429 | 2.622 | 2.250 | 2.304 | 2.467 | 1.726 | |
Acknowledgements
The main part of this work was supported by BBSRC grants (BB/K017802/1 with Shell and BB/M/017702/1). Early studies were supported by EU grant FP-7 256808 to DL and NSS. SH is a BBSRC David Phillips research fellow. NSS is an EPSRC Established Career Fellow and Royal Society Wolfson Award holder. We thank Diamond Light Source for access to MX beamlines (proposal number MX8997) that contributed to the results presented here. We thank D. Procter (University of Manchester) for helpful discussions. The authors acknowledge the assistance given by IT Services and the use of the Computational Shared Facility at The University of Manchester.
Footnotes
Author contributions
KAPP carried out molecular biology, biophysical and structural biology studies of A. niger Fdc. BK carried out molecular biology experiments underpinning biophysical and structural biology studies of S. cerevisiae Fdc performed by MDW. KF and SEJR performed and analyzed EPR experiments. SH performed DFT calculations. NJWR, DKT and RG undertook liquid chromatography-mass spectrometry of extracts and interpreted the data on substrate-product species. RB and PB performed native mass spectrometry. SB solved the C. dubliniensis Fdc structure. All authors discussed the results and participated in writing the manuscript. DL initiated and directed this research.
Author information Coordinates and structure factors have been deposited in the Protein Data Bank under accession numbers 4ZA4, 4ZA5, 4ZA7, 4ZA8, 4ZAB, 4ZA9, 4ZAA, 4ZAC and 4ZAD. Reprints and permission information is available at www.nature.com/reprints. Readers are welcome to comment on the online version of the paper.
The authors declare no competing financial interest.
References
- 1.Aussel L, Pierrel F, Loiseau L, Lombard M, Fontecave M, Barras F. Biosynthesis and physiology of coenzyme Q in bacteria. Biochim Biophys Acta. 2014;1837:1004–1011. doi: 10.1016/j.bbabio.2014.01.015. [DOI] [PubMed] [Google Scholar]
- 2.Gulmezian M, Hyman KR, Marbois BN, Clarke CF, Javor GT. The role of UbiX in Escherichia coli coenzyme Q biosynthesis. Arch Biochem Biophys. 2007;467:144–153. doi: 10.1016/j.abb.2007.08.009. [DOI] [PMC free article] [PubMed] [Google Scholar]
- 3.Leppik RA, Young IG, Gibson F. Membrane-associated reactions in ubiquinone biosynthesis in Escherichia coli. 3-octoprenyl-4-hydroxybenzoate carboxy-lyase. Biochim Biophys Acta. 1976;436:800–810. doi: 10.1016/0005-2736(76)90407-7. [DOI] [PubMed] [Google Scholar]
- 4.Erb TJ. Carboxylases in natural and synthetic microbial pathways. Appl Environ Microbiol. 2011;77:8466–8477. doi: 10.1128/AEM.05702-11. [DOI] [PMC free article] [PubMed] [Google Scholar]
- 5.Boll M, Loeffler C, Morris BEL, Kung JW. Anaerobic degradation of homocyclic aromatic compounds via arylcarboxyl-coenzyme A esters: organisms, strategies and key enzymes. Environ Microbiol. 2014;16:612–627. doi: 10.1111/1462-2920.12328. [DOI] [PubMed] [Google Scholar]
- 6.Mukai N, Masaki K, Fujii T, Kawamukai M, Iefuji H. PAD1 and FDC1 are essential for the decarboxylation of phenylacrylic acids in Saccharomyces cerevisiae . J Biosci Bioeng. 2010;109:564–569. doi: 10.1016/j.jbiosc.2009.11.011. [DOI] [PubMed] [Google Scholar]
- 7.Rangarajan ES, LiY Y, Iannuzzi P, Tocilj A, Hung LW, Matte A, Cygler M. Crystal structure of a dodecameric FMN-dependent UbiX-like decarboxylate (Pad1) from Eschericia coli O157:H7. Protein Sci. 2004;13:3006–3016. doi: 10.1110/ps.04953004. [DOI] [PMC free article] [PubMed] [Google Scholar]
- 8.Jacewicz A, Izumi A, Brunner K, Schnell R, Schneider G. Structural insights into the UbiD protein family from the crystal structure of PA0254 from Pseudomonas aeruginosa. PLOS One. 2013;8:e63161. doi: 10.1371/journal.pone.0063161. [DOI] [PMC free article] [PubMed] [Google Scholar]
- 9.Stratford M, Plumridge A, Pleasants MW, Novodvorska M, Baker-Glenn CAG, Pattenden G, Archer DB. Mapping the structural requirements of inducers and substrates for decarboxylation of weak acid preservatives by the food spoilage mould Aspergillus niger . Int J Food Microbiol. 2012;157:375–383. doi: 10.1016/j.ijfoodmicro.2012.06.007. [DOI] [PubMed] [Google Scholar]
- 10.White MD, et al. UbiX is a flavin prenyltransferase required for bacterial ubiquinone biosynthesis. Nature. doi: 10.1038/nature14559. in press. [DOI] [PMC free article] [PubMed] [Google Scholar]
- 11.Pellisier H. Asymmetric 1,3-dipolar cycloadditions. Tetrahedron. 2007;63:3235–3285. [Google Scholar]
- 12.Ess DH, Houk KN. Theory of 1,3-dipolar cycloadditions: Distortion/Interaction and frontier molecular orbital models. J Am Chem Soc. 2008;130:10187–10198. doi: 10.1021/ja800009z. [DOI] [PubMed] [Google Scholar]
- 13.Li T, Huo L, Pulley C, Liu A. Decarboxylation mechanisms in biological system. Bioorganic Chem. 2012;43:2–14. doi: 10.1016/j.bioorg.2012.03.001. [DOI] [PubMed] [Google Scholar]
- 14.Desai BJ, Goto Y, Cembran A, Fedorov AA, Almo SC, Gao J, Suga H, Gerlt JA. Investigating the role of a backbone to substrate hydrogen bond in OMP decarboxylase using a site-specific amide to ester substitution. Proc Nat Acad Sci USA. 2014;111:15066–15071. doi: 10.1073/pnas.1411772111. [DOI] [PMC free article] [PubMed] [Google Scholar]
- 15.Okrasa K, Levy C, Wilding M, Goodall M, Baudendistel N, Hauer B, Leys D, Micklefield J. Structure-guided directed evolution of alkenyl and arylmalonate decarboxylases. Angew Chem. 2009;48:7691–7694. doi: 10.1002/anie.200904112. [DOI] [PubMed] [Google Scholar]
- 16.Lupa B, Lyon D, Gibbs MD, Reeves RA, Wiegel J. Distribution of genese encoding the microbial non-oxidative reversible hydroxyarylic acid decarboxylases/phenol carboxylases. Genomics. 2005;86:342–351. doi: 10.1016/j.ygeno.2005.05.002. [DOI] [PubMed] [Google Scholar]
- 17.Zhang H, Javor GT. Regulation of the isofunctional genes ubiD and ubiX of the ubiquinone biosynthetic pathway of Escherichia coli. FEMS Microbiol Lett. 2003;223:67–72. doi: 10.1016/S0378-1097(03)00343-4. [DOI] [PubMed] [Google Scholar]
- 18.Kopec J, Schnell R, Schneider G. Structure of PA4019, a putative aromatic acid decarboxylase from Pseudomonas aeruginosa. Acta Crystallogr Sect F. 2011;67:1184–1188. doi: 10.1107/S174430911102923X. [DOI] [PMC free article] [PubMed] [Google Scholar]
- 19.Plumridge A, Melin P, Stratford M, Novodvorska M, Shunburne L, Dyer PS, Roubos JA, Menke H, Stark J, Stam H, Archer DB. The decarboxylation of the weak-acid preservative, sorbic acids, is encoded by linked genes in Aspergillus spp. Fungal Genet Biol. 2010;47:683–692. doi: 10.1016/j.fgb.2010.04.011. [DOI] [PubMed] [Google Scholar]
- 20.Lin F, Ferguson KL, Boyer DR, Lin XN, Marsh EN. Isofunctional enzymes Pad1 and UbiX catalyse formation of a novel cofactor required by ferulic acid decarboxylase and 4-hydroxy-3-polyprenylbenzoic acid decarboxylase. ACS Chem Biol. 2015 doi: 10.1021/cb5008103. In press. [DOI] [PubMed] [Google Scholar]
- 21.Christendat D, et al. Structural proteomics of an archaeon. Nat Struct Biol. 2000;7:903–909. doi: 10.1038/82823. [DOI] [PubMed] [Google Scholar]
- 22.Walsh CT, Wencewicz TA. Flavoenzymes: versatile catalysts in biosynthetic pathways. Nat Prod Rep. 2013;30:175–200. doi: 10.1039/c2np20069d. [DOI] [PMC free article] [PubMed] [Google Scholar]
- 23.Xu S, Li W, Zhu J, Wang R, Li Z, Xu GL, Ding J. Crystal structures of isoorotate decarboxylases reveal a novel catalytic mechanism of 5-carboxyl-uracil decarboxylation and shed light on the search for DNA decarboxylase. Cell Res. 2013;23:1296–1309. doi: 10.1038/cr.2013.107. [DOI] [PMC free article] [PubMed] [Google Scholar]
- 24.Prantz K, Mulzer J. Synthetic applications of the carbonyl generating Grob fragmentation. Chem Rev. 2010;110:3741–3766. doi: 10.1021/cr900386h. [DOI] [PubMed] [Google Scholar]
- 25.Kim HJ, Ruszczycky MW, Choi S-H, Lie Y-N, Liu H-W. Enzyme-catalysed [4+2] cycloaddition is a key step in the biosynthesis of spinosyn A. Nature. 2011;473:109–112. doi: 10.1038/nature09981. [DOI] [PMC free article] [PubMed] [Google Scholar]
- 26.Preiswerk N, Beck T, Schulz JD, Milovnik P, Mayer C, Siegel JB, Baker D, Hilvert D. Impact of scaffold rigidity on the design and evolution of an artificial Diels-Alderase. Proc Natl Acad Sci USA. 2014;111:8013–8018. doi: 10.1073/pnas.1401073111. [DOI] [PMC free article] [PubMed] [Google Scholar]
- 27.Richter M. Functional diversity of organic molecule enzyme cofactors. Nat Prod Rep. 2013;30:1324–1345. doi: 10.1039/c3np70045c. [DOI] [PubMed] [Google Scholar]
- 28.de Gonzalo G, Smit C, Jin J, Minnaard AJ, Fraaije MW. Turning a riboflavin-binding protein into a self-sufficient monooxygenase by cofactor redesign. Chem Commun. 2011;47:11050–11052. doi: 10.1039/c1cc14039f. [DOI] [PubMed] [Google Scholar]
- 29.Imada Y, Iida H, Kitagawa T, Naota T. Aerobic reduction of olefins by in situ generation of diimide with synthetic flavin catalysts. Chemistry. 2011;17:5908–5920. doi: 10.1002/chem.201003278. [DOI] [PubMed] [Google Scholar]
- 30.Kalghatgi KK, Subba Rao PV. Microbial L-phenylalanine ammonia-lyase. Purification, subunit structure and kinetic properties of the enzyme from Rhizoctonia solani. Biochem J. 1975;149(1):65–72. doi: 10.1042/bj1490065. [DOI] [PMC free article] [PubMed] [Google Scholar]
- 31.de Villiers MM, Bergh JJ. Comparing HPLC and UV spectrophotometric analysis methods for determining the stability of sorbic acid in nonionic creams containing lactic acid. Drug Dev Ind Pharm. 2000;26(5):539–47. doi: 10.1081/ddc-100101265. [DOI] [PubMed] [Google Scholar]
- 32.Winn MD, et al. Overview of the CCP4 suite and current developments. Acta Crystallogr. 2011;D67:235–242. doi: 10.1107/S0907444910045749. [DOI] [PMC free article] [PubMed] [Google Scholar]
- 33.Kabsch W. XDS. Acta Crystallogr. 2010;D66:125–132. doi: 10.1107/S0907444909047337. [DOI] [PMC free article] [PubMed] [Google Scholar]
- 34.Fu G, et al. Atomic-Resolution Structure of an N(5) Flavin Adduct in D-Arginine Dehydrogenase. Biochemistry. 2011;50:6292–6294. doi: 10.1021/bi200831a. [DOI] [PubMed] [Google Scholar]
- 35.Frisch MJ, et al. Gaussian 09. Gaussian; Wallingford, CT: 2010. X, revision B.01. [Google Scholar]
- 36.Guex N, Peitsch MC. SWISS-MODEL and the Swiss-PdbViewer: An environment for comparative protein modeling. Electrophoresis. 1997;18:2714–2723. doi: 10.1002/elps.1150181505. http://www.expasy.org/spdbv/ [DOI] [PubMed] [Google Scholar]
- 37.Waller MP, Robertazzi A, Platts JA, Hibbs DE, Williams PA. Hybrid density functional theory for pi-stacking interactions: application to benzenes, pyridines, and DNA bases. J Comput Chem. 2006;27:491. doi: 10.1002/jcc.20363. [DOI] [PubMed] [Google Scholar]


