

Abstract
Previous research has indicated that allosteric interactions across the dimer interface of β 1‐adrenoceptors may be responsible for a secondary low affinity binding conformation. Here we have investigated the potential for probe dependence, in the determination of antagonist pKi values at the human β 1‐adenoceptor, which may result from such allosterism interactions. Three fluorescent β 1‐adrenoceptor ligands were used to investigate this using bioluminescence energy transfer (BRET) between the receptor‐bound fluorescent ligand and the N‐terminal NanoLuc tag of a human β 1‐adrenoceptor expressed in HEK 293 cells (NanoBRET). This proximity assay showed high‐affinity‐specific binding to the NanoLuc‐ β 1‐adrenoceptor with each of the three fluorescent ligands yielding K D values of 87.1 ± 10 nmol/L (n = 8), 38.1 ± 12 nmol/L (n = 7), 13.4 ± 2 nmol/L (n = 14) for propranolol‐Peg8‐BY630, propranolol‐ β(Ala‐Ala)‐BY630 and CGP‐12177‐TMR, respectively. Parallel radioligand‐binding studies with 3H‐CGP12177 and TIRF microscopy, to monitor NanoLuc bioluminescence, confirmed a high cell surface expression of the NanoLuc‐ β 1‐adrenoceptor in HEK 293 cells (circa 1500 fmol.mg protein−1). Following a 1 h incubation with fluorescent ligands and β 1‐adrenoceptor competing antagonists, there were significant differences (P < 0.001) in the pKi values obtained for CGP20712a and CGP 12177 with the different fluorescent ligands and 3H‐CGP 12177. However, increasing the incubation time to 2 h removed these significant differences. The data obtained show that the NanoBRET assay can be applied successfully to study ligand‐receptor interactions at the human β 1‐adrenoceptor. However, the study also emphasizes the importance of ensuring that both the fluorescent and competing ligands are in true equilibrium before interpretations regarding probe dependence can be made.
Keywords: Bioluminescence energy transfer, ligand binding, probe dependence, β‐adrenoceptors
Abbreviations
- BRET
bioluminescence energy transfer
- DMEM
Dulbecco's modified Eagles medium
- FCS
fetal calf serum
- HEK
human embryonic kidney
- Nluc
NanoLuc
- PBS
phosphate‐buffered saline
Introduction
The human β 1‐adrenoceptor appears to exist in two active conformations (Kaumann et al. 2001; Kaumann and Molenaar 2008; Pak and Fishman 1996; Granneman 2001; Baker et al. 2003). One of these is a classical orthosteric‐binding site via which endogenous ligands, such as adrenaline and noradrenaline, mediate their agonist effects. The actions of agonists at this site are potently and competitively antagonized by β‐blockers such as CGP 20712A, CGP 12177, and propranolol (Baker et al. 2003; Baker 2005; Lowe et al. 2002; Joseph et al. 2004a). However, at much higher concentrations than required to occupy the orthosteric site, CGP 12177 (Staehelin et al. 1983) is able to produce an agonist response that is effectively resistant to β‐blocker antagonism at the concentrations normally employed to prevent the binding of agonists to the orthosteric site (Pak and Fishman 1996; Baker et al. 2003; Baker 2005; Joseph et al. 2004a; Konkar et al. 2000). The dissociation constants of classical β‐adrenoceptor antagonists are therefore one to two orders of magnitude higher when determined from inhibition of functional responses mediated by CGP 12177 at the β 1‐adrenoceptor compared to those determined from antagonism of catecholamine responses (Molenaar et al. 2007; Lowe et al. 2002; Baker et al. 2003; Baker 2005). Studies in recombinant cell systems and cardiac tissue isolated from β 2‐ and β 1‐/β 2‐adrenoceptor knockout mice have confirmed that the second‐site pharmacology of CGP 12177 is a direct consequence of its interaction with the β 1‐adrenoceptor (Kaumann et al. 2001; Kaumann and Molenaar 2008; Pak and Fishman 1996).
Site‐directed mutagenesis studies have attempted to isolate the regions of the β 1‐adrenoceptor responsible for this second site pharmacology in CHO‐K1 cells (Baker et al. 2008, 2014; Joseph et al. 2004b). Baker et al. (2014) have indicated that residues within the dimer interface region in transmembrane domain (TM) 4 of the β 1‐adrenoceptor may be responsible for the secondary β 1‐adrenoceptor conformation (Gherbi et al. 2015). In this situation, negative cooperativity across the TM4‐TM5 β 1‐adrenoceptor homodimer interface may be responsible for generating the low affinity pharmacology of the secondary β 1‐adrenoceptor conformation (Gherbi et al. 2015) in a manner analogous to that observed for the adenosine A3‐receptor (May et al. 2011; Corriden et al. 2014).
Recent studies with a fluorescent analog of CGP 12177 (BODIPY‐TMR‐CGP) have shown that at high concentrations it can begin to label both conformations of the human β 1‐adrenoceptor expressed in CHO‐K1 cells (Gherbi et al. 2014, 2015). The availability of this ligand has made it possible to study the dynamics of ligand‐receptor interactions in living cells and provided evidence for negatively cooperative interactions (Gherbi et al. 2014, 2015). Recently, we developed an exquisitely sensitive proximity‐based method to monitor ligand‐receptor interactions in living cells using bioluminescence resonance energy transfer (BRET) (Stoddart et al. 2015). This used a recently described and extremely bright luciferase NanoLuc (Hall et al. 2012) fused to the N‐terminus of different GPCRs expressed in HEK 293 cells in conjunction with red‐shifted fluorescent ligands (Stoddart et al. 2015). This NanoBRET approach was able to show binding of fluorescent ligands to GPCRs in a highly specific way. Furthermore, in the case of the adenosine A3‐receptor where a number of different fluorescent ligands were available to probe this receptor, the study highlighted the fact that binding affinities varied depending on the A3‐receptor fluorescent probe used (Stoddart et al. 2015). These observations were in keeping with the known allosterism observed across the A3‐receptor homodimer interface (May et al. 2011; Corriden et al. 2014; Stoddart et al. 2015), and consistent with the expected probe dependence for such allosteric interactions (May et al. 2007, 2010; Christopoulos and Kenakin 2002).
Here, we have investigated the potential for probe dependence in the determination of antagonist pKi values at the human β 1‐adenoceptor using three different fluorescent β 1‐adrenoceptor ligands, in conjunction with a N‐terminal tagged NanoLuc human β 1‐adrenoceptor expressed in HEK 293 cells.
Materials and Methods
cDNA constructs
To create the NL‐ β 1‐AR construct, NanoLuc (NL) was initially ligated into pcDNA3.1 containing the 5‐HT receptor membrane localization signal sequence (sig) using KpnI and BamHI restriction enzymes, generating the sig‐NL plasmid. The β 1 adrenoceptor with no start codon was then ligated to the C‐terminus of NL from pcDNA3.1 containing SNAP‐β 1 (Gherbi et al. 2015) using BamHI and XbaI restriction enzymes. The resulting fusion protein contained a Gly‐Ser linker between the Nluc open reading frame (ORF) and the β 1 ORF. The NanoLuc Histamine 1 receptor construct (NL‐H1) was made by removing the internal BamHI site in the H1 receptor (in pcDNA3.1) by site‐directed mutagenesis while maintaining the amino acid sequence. This was then ligated into the sig‐NL plasmid with BamHI and XhoI restriction enzymes.
Materials
Propranolol‐Peg8‐BY630 (propranolol‐peg8‐BODIPY630/650) and prop‐β(Ala‐Ala)‐BY630 (propranolol‐βalanine‐ βalanine‐X‐BODIPY630/650) were obtained from CellAura (Nottingham, UK). BODIPY‐TMR‐CGP (CGP‐12177‐TMR) was purchased from Molecular Probes (Eugene, OR). Propranolol, ICI 118551, CGP 12177, CGP 20712A, and cimaterol were from Tocris (Bristol, UK). Isoprenaline was purchased from Sigma‐Aldrich (Gillingham, UK). The NanoLuc substrate furimazine was obtained from Promega (Southampton, UK). The radioligand 3H CGP 12177 was obtained from PerkinElmer (Coventry, UK).
Cell lines
HEK 293 cells were maintained in Dulbecco's modified eagle medium (DMEM) containing 10% fetal calf serum (FCS) and 2 mmol/L l‐glutamine at 37°C in 5% CO2 atmosphere. Mixed population NL‐β 1‐AR and NL‐H1 HEK 293 cell lines were generated using Fugene HD (Promega) according to the manufacturer's instructions and cells were then subjected to 1 mg/mL G418‐selective pressure for 2 weeks.
Radioligand‐binding assays
Saturation‐ and competition‐binding assays were performed on stably transfected HEK NL‐ β 1‐AR cells. These were seeded 24 h before experimentation in white Thermo Scientific 96‐well microplates. The medium was removed from each well and replaced with serum‐free media (DMEM with 2 mmol/L l‐glutamine), followed immediately by the required concentrations of 3H‐CGP 12177 radioligand and competing compounds. For saturation‐binding assays, nonspecific binding was determined in the presence of 10 μmol/L propranolol. The cells were incubated for 2 h at 37°C, 5% CO2. The cells were washed twice by the addition and subsequent removal of 200 μL phosphate‐buffered saline (PBS). 200 μL microscint‐20 (PerkinElmer) was added to each well, a white base applied to the plate, and the plate sealed with a clear topseal heat seal (PerkinElmer). The plates were counted on a Topcount scintillation reader (PerkinElmer). Protein content of wells was determined by the method of Lowry et al. (1951).
BRET NL‐β 1‐AR receptor‐ligand‐binding assays
Saturation‐ and competition‐binding assays were performed on stably transfected HEK 293 cells. Cells were seeded 24 h before experimentation in white Thermo Scientific 96‐well microplates. The medium was removed from each well and replaced with HEPES‐buffered saline solution (HBSS; 147 mmol/L NaCL, 24 mmol/L KCl, 1.3 mmol/L CaCl2, 1 mmol/L MgSO4, 10 mmol/L HEPES, 2 mmol/L sodium pyruvate, 1.43 mmol/L NaHCO3, 4.5 mmol/L d‐glucose, pH 7.2–7.45) with the relevant concentration of fluorescent ligand and, if necessary, competing ligand. Nonspecific binding was determined with 10 μmol/L propranolol. Cells were then incubated in the dark for 1 or 2 h at 37°C (no CO2). The NanoLuc substrate furimazine (Promega) was then added to each well at a final concentration of 10 μmol/L and allowed to equilibrate for 5 min prior to reading. We measured the luminescence signals at two different wavelengths using the PHERAstar FS plate reader (BMG Labtech, UK) at room temperature. The filtered light from each well was simultaneously measured using 460 nm (80‐nm bandpass) and >610 nm longpass filters. The resulting raw BRET ratio was calculated by dividing the >610 nm emission by the 460 nm emission.
Bioluminescence imaging of NL‐β 1‐AR
Bioluniescence imaging experiments were performed to determine the cellular localization of the NL‐β 1‐AR fusion protein. Imaging was performed using the Zeiss TIRF3 microscope equipped with a Photometrics Quantum EM camera and a 20× EC Plan‐Neofluar objective lens. No filter was used in these experiments, in order to maximize the luminescence detected by the camera. HEK 293 cells were seeded onto glass‐bottom MatTek dishes (Ashland, MA) and transiently transfected with the NL‐β 1‐AR construct 24 h before experimentation using Fugene HD (Promega). The medium was removed and replaced with HBSS at 37°C. The luminescence of NL‐β 1‐AR was captured as a single 10 sec exposure immediately after the addition of 10 μmol/L furimazine. Following this a phase contrast image was acquired of the cells with a 33 msec exposure time. All images were acquired using the Zeiss Zen 2 software (Jena, Germany). Image processing was performed with FIJI software (Schindelin et al., 2012).
Data analysis
Data were presented and analyzed using Prism 6 software (GraphPad).
Saturation‐binding curves were simultaneously fitted to obtain the total and nonspecific components using the following equation:
where B max is the maximal level of specific binding, [B] is the concentration of fluorescent ligand or radioligand in nmol/L, K D is the equilibrium dissociation constant in nmol/L, M is the slope of the linear nonspecific binding component, and C is the y‐axis intercept.
Competition radioligand and NanoBRET data were fitted using a one‐site sigmoidal response curve given by the following equation:
where [A] is the concentration of competing drug, NS is the nonspecific binding, n is the Hill coefficient, and IC 50 is the concentration of ligand required to inhibit 50% of the specific binding of the radioligand or fluorescent ligand.
The IC50 values from competition‐binding curves were used to calculate the K i of the unlabeled ligands using the Cheng–Prusoff equation:
where [L] is the concentration of fluorescent ligand or radioligand in nmol/L, and K D is the dissociation constant of the fluorescent ligand or radioligand in nmol/L. The K D values used were obtained from the saturation‐binding experiments.
Statistical significance was determined by one‐way analysis of variance (ANOVA, P < 0.05 considered significant).
Results
3H‐CGP 12177‐binding experiments in NL‐β 1‐AR HEK 293 cells
Initial radioligand‐binding experiments were performed with the high affinity ligand 3H‐CGP 12177 in HEK 293 cells stably expressing human β 1‐adrenoceptors containing an N‐terminal Nanoluc luciferase fusion (NL‐β 1‐ARs). Saturation analysis showed clear specific binding (Fig. 1; K D for 3H‐CGP 12177 = 0.92 ± 0.19 nmol/L; n = 6) and a mean receptor expression level of 1581 ± 350 pmol.mg protein−1 (n = 6). The level of nonspecific binding deduced in the presence of 10 μmol/L propranolol was low across the concentrations of 3H‐CGP 12177 employed (0–5 nmol/L; Fig. 1). Competition experiments with a range of β 1‐adrenoceptor agonists and antagonists (Fig. 2A and B) fitted well to a simple single mass action equilibrium model and allowed the calculation of pKi values for the different inhibitors (Table 1). As expected, the selective β 1‐adrenoceptor antagonist CGP 20712A showed a much higher affinity for the NL‐β 1‐adrenoceptor (pKi: 7.92; Fig. 2A; Table 1) than the β 2‐adrenoceptor‐selective antagonist ICI 118551 (pKi 6.01; Table 1; Fig. 2A), although both values were lower than those (8.81 and 6.52 for CGP 20712A and ICI 118551, respectively) obtained in CHO cells (Baker 2005).
Figure 1.
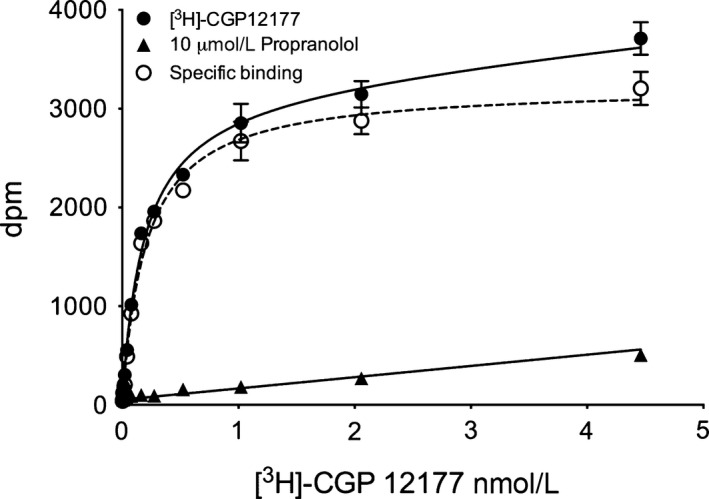
3H‐CGP 12177 binding to HEK‐NL‐β 1‐AR cells showing total 3H‐CGP 12177 binding, nonspecific binding (obtained in the presence of 10 μmol/L propranolol) and specific binding. Data points are mean ± SEM of quadruplicate determinations from a single experiment. Similar data were obtained in six separate experiments.
Figure 2.
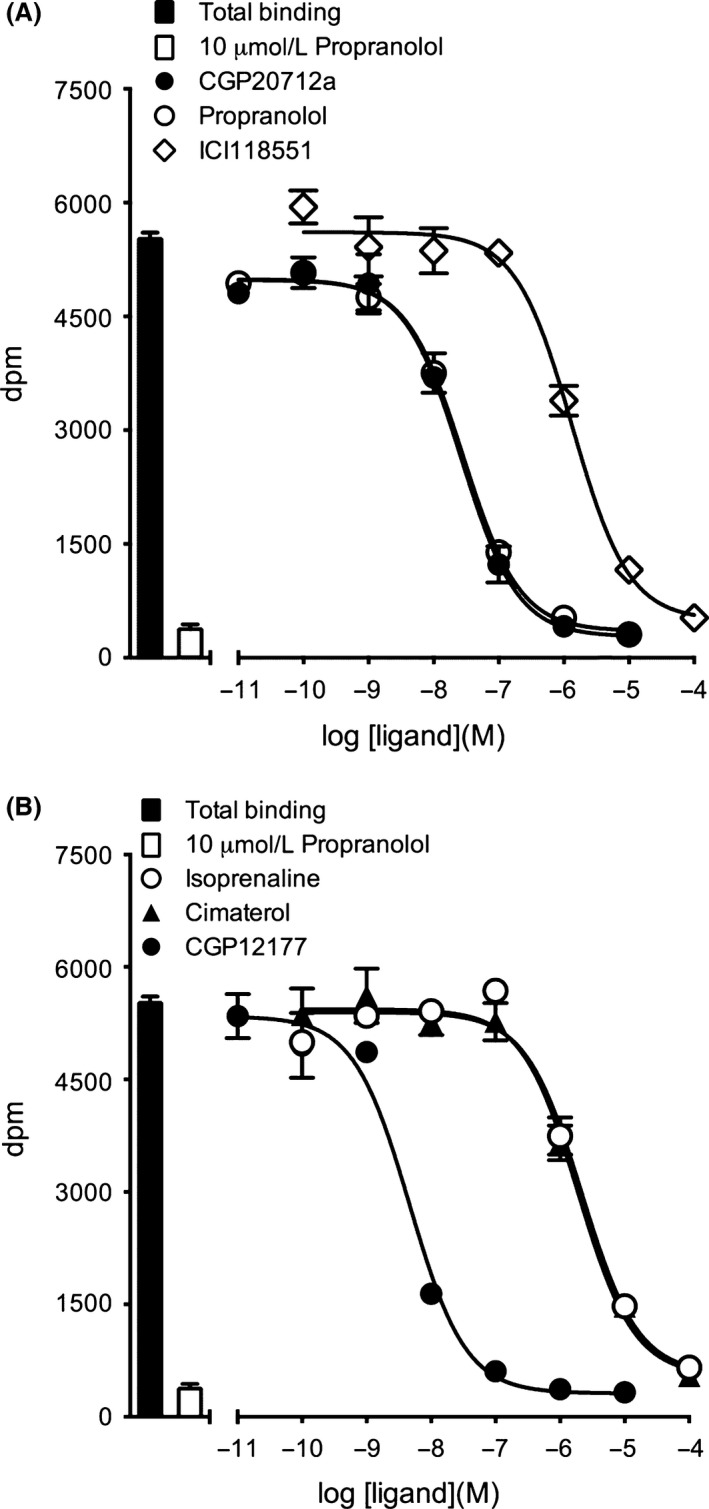
Inhibition of 3H‐CGP 12177 binding to HEK‐NL‐β 1‐AR cells by (A) CGP 20712A, propranolol, ICI 118551, (B) isoprenaline, cimaterol, CGP 12177. Nonspecific binding was defined in the presence of 10 μmol/L propranolol. The concentration of 3H‐CGP 12177 present in these experiments was 2.2 nmol/L. Data points are triplicate determinations of mean ± SEM and these single experiments are representative of five separate experiments. Summary data from the replicate experiments are provided in Table 1.
Table 1.
Binding affinities of competing ligands determined from inhibition of the specific binding of 0.9–2.5 nmol/L 3H‐CGP 12177, 100 nmol/L Propranolol‐Peg8‐BY630, 50 nmol/L Propranolol‐β(Ala‐Ala)‐BY630 or 50 nmol/L CGP‐12177‐TMR in HEK 293 cells expressing a NanoLuc‐tagged human β 1‐adrenoceptor
| 3H‐CGP‐12177 | Propranolol‐Peg8‐BY630 | Propranolol‐ β(Ala‐Ala)‐BY630 | CGP‐12177‐TMR | |||||
|---|---|---|---|---|---|---|---|---|
| pKi | n | pKi | n | pKi | n | pKi | n | |
| Isoprenaline** | 6.18 ± 0.07 | 5 | 6.72 ± 0.12 | 7 | 5.95 ± 0.09 | 8 | 6.56 ± 0.05 | 5 |
| Cimaterol* | 6.03 ± 0.05 | 5 | 6.44 ± 0.11 | 7 | 5.84 ± 0.22 | 8 | 6.34 ± 0.19 | 5 |
| CGP 12177** | 8.76 ± 0.09 | 5 | 8.67 ± 0.05 | 7 | 8.15 ± 0.10 | 8 | 8.93 ± 0.07 | 5 |
| CGP 20712A** | 7.92 ± 0.11 | 5 | 8.52 ± 0.09 | 7 | 7.84 ± 0.07 | 8 | 8.85 ± 0.19 | 5 |
| Propranolol | 7.92 ± 0.09 | 5 | 8.11 ± 0.12 | 5 | 7.77 ± 0.21 | 5 | 7.80 ± 0.08 | 5 |
| ICI 118551 | 6.01 ± 0.13 | 5 | 6.55 ± 0.19 | 5 | 6.18 ± 0.22 | 5 | 6.51 ± 0.05 | 5 |
Incubations were for 1 h. Values show mean ± SEM obtained in n separate experiments. In each individual experiment triplicate determinations were made for each experimental condition. pKi values were determined from IC 50 values using the Cheng–Prusoff equation as described under Methods. **,*pKi values obtained of competing ligand significantly differ between fluorescent/radioactive probes (**P < 0.001; *P < 0.05; One‐way ANOVA).
Inhibition of 3H‐CGP 12177 binding by three different fluorescent β 1‐adrenoceptor antagonists at the human β 1‐AR
Three different fluorescent β‐AR ligands were used to investigate binding to the β 1‐AR in this study: (1) Propranolol‐Peg8‐BY630 (Baker et al. 2011); (2) Propranolol‐ β(Ala‐Ala)‐BY630 (Stoddart et al. 2015), and (3) CGP‐12177‐TMR (Gherbi et al. 2014). Initial studies were performed to evaluate the ability of these ligands to inhibit the binding of 3H‐CGP 12177 (Fig. 3 and Table 2). The pKi values obtained from these studies indicated that Propranolol‐β(Ala‐Ala)‐BY630 and CGP‐12177‐TMR were approximately an order of magnitude higher affinity than Propranolol‐Peg8‐BY630 in HEK‐293 cell expressing the human β 1‐adrenoceptor (Table 2).
Figure 3.
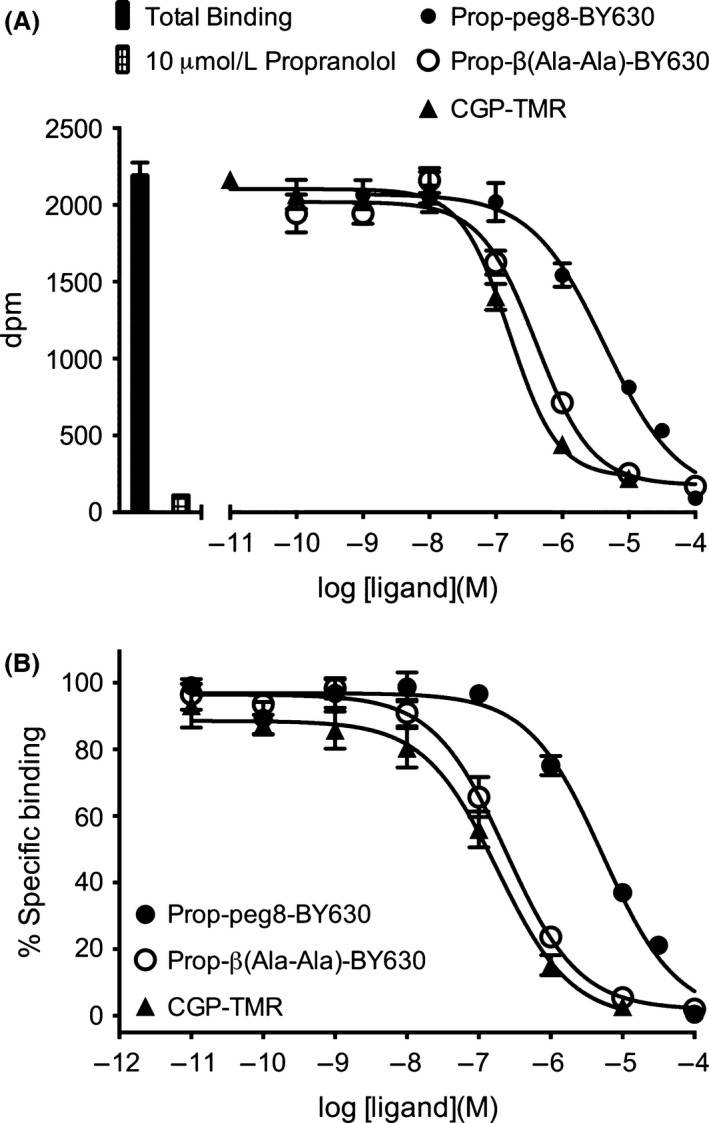
Inhibition of 3H‐CGP 12177 binding to HEK‐NL‐β 1‐AR cells by propranolol‐Peg8‐BY630, propranolol‐β(Ala‐Ala)‐BY630 and CGP‐12177‐TMR. Nonspecific binding was defined in the presence of 10 μmol/L propranolol. The concentration of 3H‐CGP 12177 present in these experiments was 0.9–2.5 nmol/L. Data points in (A) are mean ± SEM of triplicate determinations in a single representative experiment. (B) Inhibition of specific 3H‐CGP 12177 binding by each fluorescent ligand expressed as a percentage of the specific binding obtained in the absence of inhibitor. Data points in (B) are mean ± SEM of six (propranolol‐Peg8‐BY630), seven (propranolol‐β (Ala‐Ala)‐BY630), and five (CGP‐12177‐TMR) separate experiments. Summary data from the replicate experiments are provided in Table 2.
Table 2.
Binding affinities of three fluorescent ligands determined from inhibition of the specific binding of 0.9–2.5 nmol/L 3H‐CGP 12177 and from the saturation of Prop‐peg8‐BY630, Prop‐ β(Ala‐Ala)‐BY630, or CGP‐12177‐TMR in HEK 293 cells expressing a NanoLuc‐tagged human β 1‐adrenoceptor
| Radioligand | 1 h NanoBRET | 2 h NanoBRET | ||||
|---|---|---|---|---|---|---|
| Fluorescent Ligand | pKi | n | pKd | n | pKd | n |
| Prop‐peg8‐BY630 | 6.17 ± 0.15 | 6 | 7.06 ± 0.12 | 8 | 6.18 ± 0.22 | 5 |
| Prop‐ β(Ala‐Ala)‐BY630 | 7.26 ± 0.09 | 7 | 7.23 ± 0.12 | 7 | 7.86 ± 0.14 | 5 |
| CGP‐12177‐TMR | 7.55 ± 0.15 | 5 | 7.87 ± 0.06 | 14 | 7.72 ± 0.10 | 5 |
Values show mean ± SEM obtained in n separate experiments. In each individual experiment triplicate determinations were made for each experimental condition. pKi values were determined from IC 50 values using the Cheng–Prusoff equation as described under Methods. pKd values were determined from NanoBRET saturation fluorescent ligand‐binding analysis performed over 1 h or 2 h incubation. Radioligand‐binding studies were performed over 2 h incubations. BRET, bioluminescence energy transfer.
Binding characteristics of three fluorescent β 1‐adrenoceptor antagonists at the human β 1‐AR using NanoBRET
The successful expression of the NL‐β 1‐AR on the surface of HEK 293 cells is indicated by the radioligand‐binding studies with 3H‐CGP‐12177 (above), but also from imaging of the Nanoluc bioluminescence using TIRF microscopy (Fig. 4). In Figure 4, clear membrane‐associated luminescence can be seen at the single cell level. This cell surface expression provided the opportunity to investigate ligand binding of different fluorescent ligands using BRET (NanoBRET) to report the proximity of the fluorescent ligand to the NL‐tagged β 1‐AR, as we have previously shown for other receptors (Stoddart et al. 2015). All three fluorescent ligands showed clear specific binding (as determined by BRET) to the β 1‐AR (Figs. 5, 6). These data provided estimates for the K D values of Propranolol‐Peg8‐BY630 (87.1 ± 10 nmol/L, n = 8; Figs. 5A, 6A), Propranolol‐ β(Ala‐Ala)‐BY630 (38.1 ± 12 nmol/L, n = 7; Figs. 5B, 6B), and CGP‐12177‐TMR (13.4 ± 2 nmol/L, n = 14; Fig. 5C, 6C). The latter value is very similar to the value (22.4 nmol/L; Gherbi et al. 2014) deduced with this fluorescent probe at the wild‐type β 1‐AR expressed in CHO cells. To confirm that the interaction of the fluorescent ligands with the β 1‐AR was receptor specific, we also evaluated their ability to generate a BRET signal in HEK 293 cell expressing an unrelated receptor, the human H1‐receptor with an N‐terminal NanoLuc fusion (Fig. 7). The binding of Propranolol‐Peg8‐BY630 (Fig. 7A), Propranolol‐ β(Ala‐Ala)‐BY630 (Fig. 7B), and CGP‐12177‐TMR (Fig. 7C) to the histamine H1‐receptor showed an essentially linear increase in BRET over a wide concentration range (0–500 nmol/L) consistent with nonspecific (Fig. 7A and C) or very low affinity binding (Fig. 7B).
Figure 4.
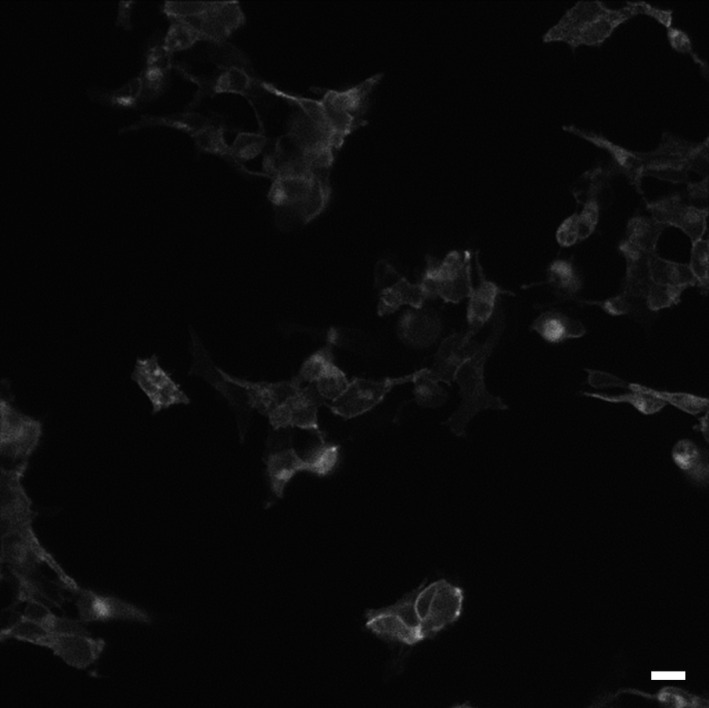
Image of HEK 293 cells transiently transfected with NL‐β 1‐AR showing clear plasma membrane distribution of the fusion protein. This single 10 sec exposure image was taken immediately after the addition of 10 μmol/L furimazine and is representative of five separate experiments. Scale bar is 20 μm.
Figure 5.
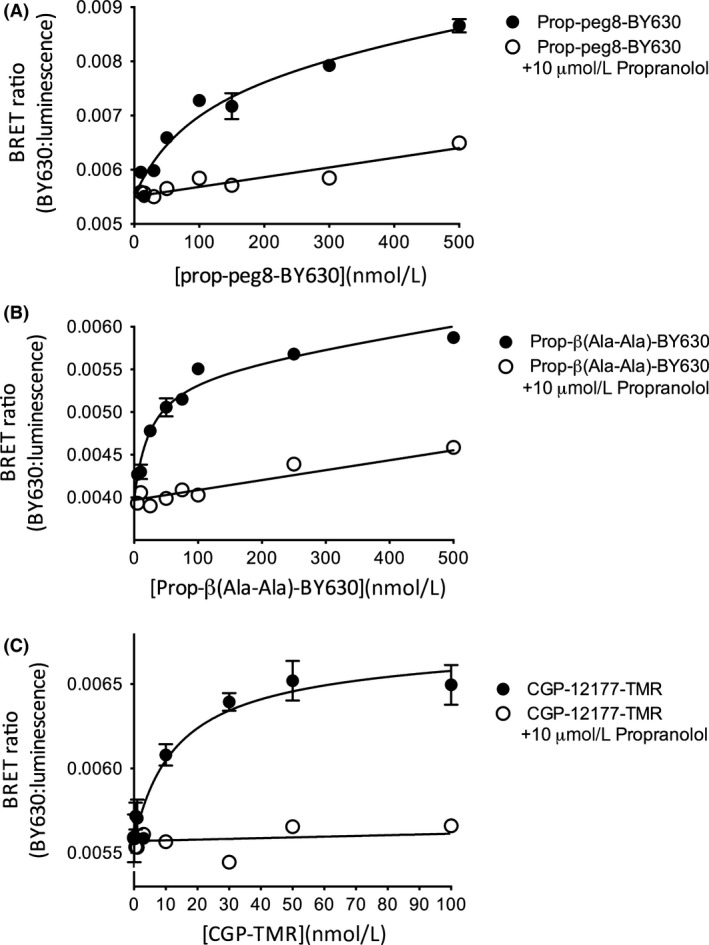
NanoBRET signal obtained from HEK 293 NL‐β 1‐AR cells incubated for 1 h with increasing concentrations of (A) Propranolol‐Peg8‐BY630 (B) Propranolol‐β(Ala‐Ala)‐BY630, or (C) CGP‐12177‐TMR. Nonspecific binding was determined in the presence of 10 μmol/L propranolol. Data points are mean ± SEM of triplicate determinations from a single experiment. These single experiments are representative of (A) eight, (B) seven, and (C) fourteen separate experiments. Where not seen, error bars are within the symbol. BRET, bioluminescence energy transfer.
Figure 6.
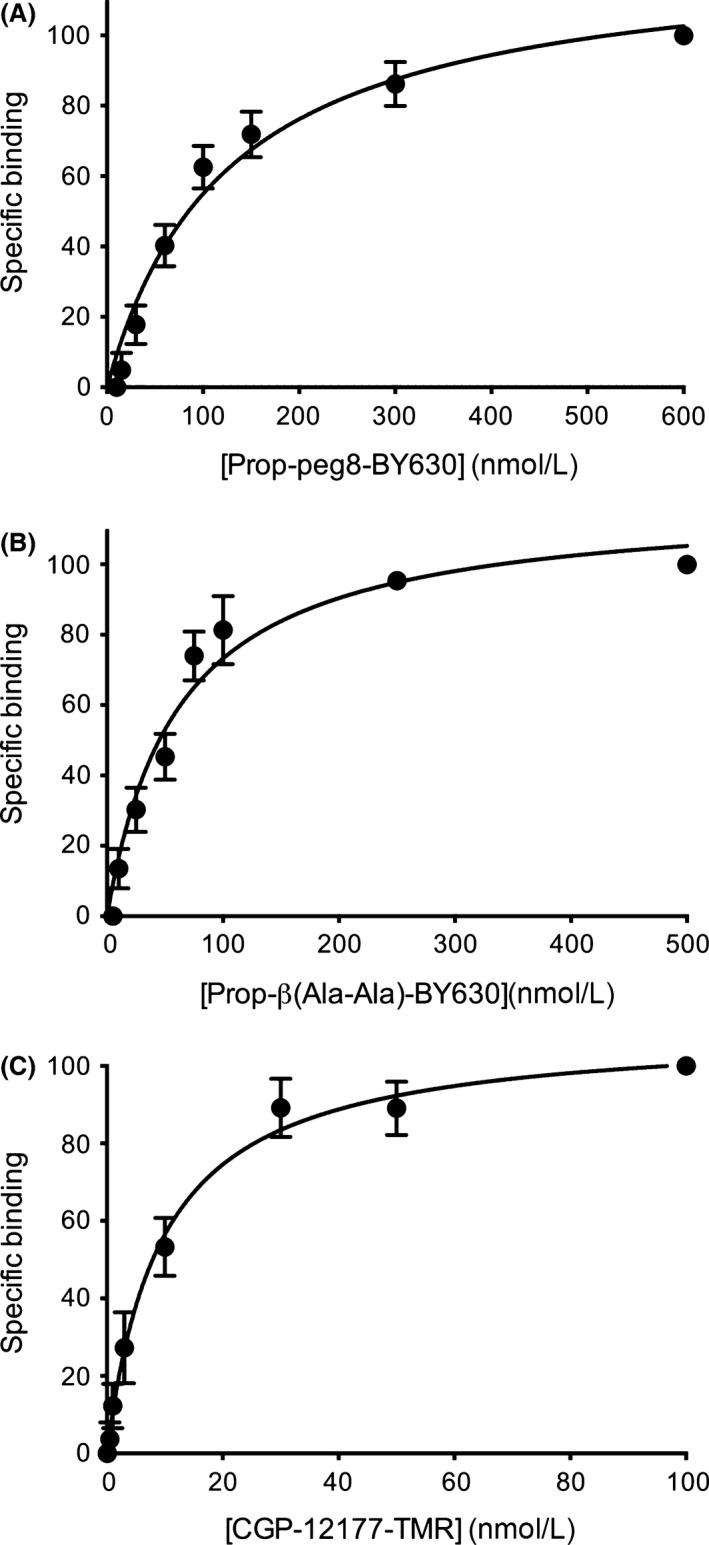
Normalized saturation‐binding curves of the specific binding of (A) Propranolol‐Peg8‐BY630 (B) Propranolol‐β(Ala‐Ala)‐BY630, or (C) CGP‐12177‐TMR. Data points are mean ± SEM of eight (propranolol‐Peg8‐BY630), seven (propranolol‐ β(Ala‐Ala)‐BY630), and fourteen (CGP‐12177‐TMR) separate experiments. Values have been normalized to the specific binding obtained at the highest concentration of each fluorescent ligand in each separate experiment. Nonspecific binding was determined in the presence of 10 μmol/L propranolol and subtracted from the total binding values to obtain specific binding levels in each individual experiment. Summary data for the pKd values obtained in each replicate experiment are provided in Table 2.
Figure 7.

NanoBRET signal obtained from HEK 293 cells expressing an NLuc‐tagged histamine H1‐receptor incubated for 1 h with increasing concentrations of (A) Propranolol‐Peg8‐BY630, (B) Propranolol‐β(Ala‐Ala)‐BY630, (C) CGP‐12177‐TMR. Nonspecific binding was determined in the presence of 10 μmol/L mepyramine. Data points are mean ± SEM from triplicate determinations in a single representative experiment. These single experiments are representative of five separate experiments. BRET, bioluminescence energy transfer.
Probe dependence of pKi values determine for β 1‐AR agonists and antagonists
The availability of three different fluorescent ligands for the β 1‐AR provided the opportunity to investigate whether competition‐binding experiments exhibited probe dependence, and the extent to which the values obtained for pKi differed from those obtained from radioligand‐binding experiments. Competition‐binding experiments were initially undertaken with the two fluorescent propranolol derivatives that essentially only differ in the length and composition of the linker between propranolol and the BODIPY 630/650 fluorophore (Fig. 8). In both cases, there was a reasonable agreement with the values obtained from radioligand‐binding experiments with 3H‐CGP 12177 (Fig. 8B and D). The slope of the linear regression lines in Figures 8B and D were 0.87 ± 0.08 (R 2 = 0.97; y intercept = 1.38 ± 0.56) and 0.87 ± 0.08 (R 2 = 0.97; y intercept = 0.73 ± 0.60), respectively. However, a comparison of the pKi values obtained with the two fluorescent propranolol derivatives revealed a trend to higher values obtained with Propranolol‐Peg8‐BY630 relative to Propranolol‐β(Ala‐Ala)‐BY630 (Table 1). Comparable higher pKi values were also obtained with CGP‐12177‐TMR (Fig. 9; Table 1). However, although the correlation between pKi values obtained with 3H‐CGP 12177 and CGP‐12177‐TMR was similar to the other comparisons (Fig. 9C; 0.95 ± 0.14; y intercept 0.74 ± 1.00; R 2 = 0.92) the values obtained with CGP 20712A differed by an order of magnitude. A comparison of the pKi values obtained for each competing antagonist ligand suggested that there were significant probe‐dependent differences between them (Fig. 10). In the case of CGP20712A and CGP 12177, the differences were highly significant (P < 0.001; one‐way ANOVA; Fig. 10A).
Figure 8.
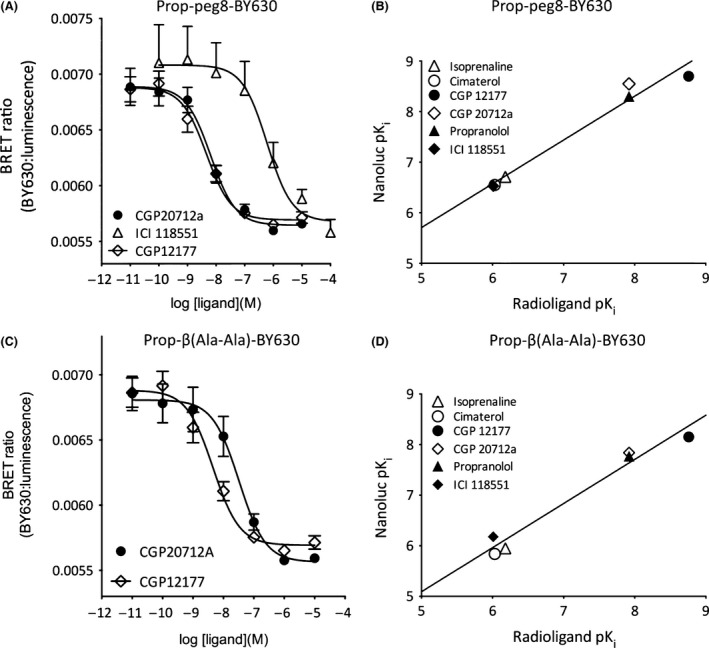
NanoBRET signal from NL‐ β 1‐AR cells treated with (A–B) 100 nmol/L Propranolol‐Peg8‐BY630, (C–D) 50 nmol/L Propranolol‐ β(Ala‐Ala)‐BY630 and increasing concentrations of (A) CGP 20712A, ICI 118551, CGP 12177 or (C) CGP 20712A, CGP 12177. (B, D) Regression plots comparing the pKi obtained from NanoBRET binding to those obtained using radioligand binding. Data points are combined mean ± SEM from (A–B) seven and (C–D) eight separate experiments. Exceptions are propranolol and ICI 118551 in both figures where data represent mean ± SEM from five separate experiments. BRET, bioluminescence energy transfer.
Figure 9.
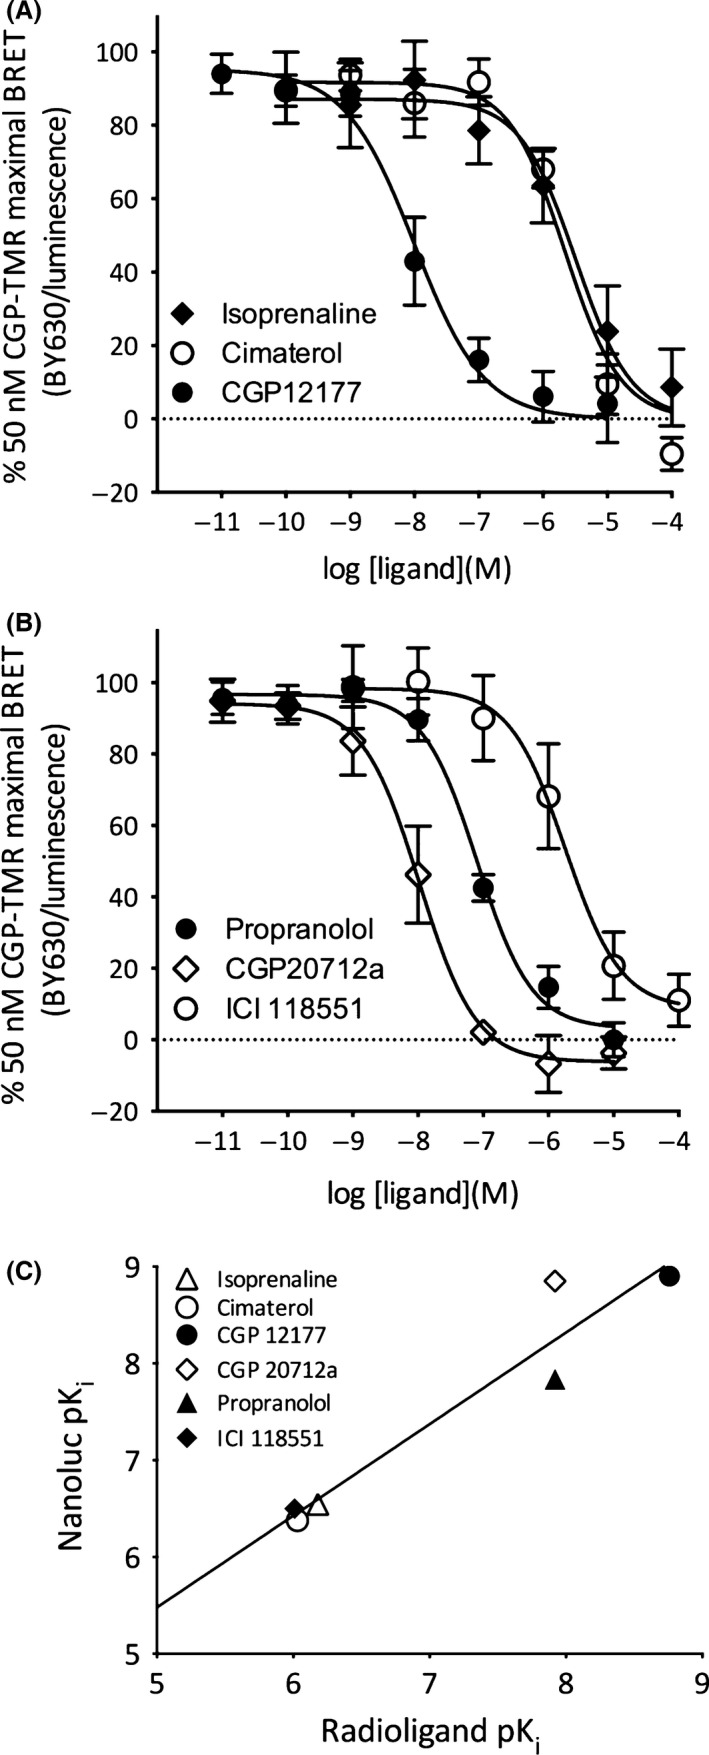
NanoBRET signal from NL‐β 1‐AR cells treated with 50 nmol/L CGP‐12177‐TMR and increasing concentrations of (A) isoprenaline, cimaterol, CGP‐12177 (B) propranolol, CGP 20712A, ICI 118551. Data points are expressed as a % of the specific binding of CGP‐12177‐TMR obtained (in the absence of inhibitor) in each individual experiment and represent the mean ± SEM from five separate experiments. Nonspecific binding was determined in the presence of 10 μmol/L propranolol. (C) Regression plot comparing the pKi obtained from the NanoBRET experiments in (A–B) to pKi obtained with radioligand‐binding studies. BRET, bioluminescence energy transfer.
Figure 10.

A comparison of pKi values obtained at the NL‐tagged β 1‐adrenoceptor using three different fluorescent β 1‐adrenoceptor ligands (Propranolol‐Peg8‐BY630, Propranolol‐β(Ala‐Ala)‐BY630, or CGP‐12177‐TMR) and 3H‐CGP 12177. Incubation with fluorescent ligands was for either 1 h (A) or 2 h (B). pKi values were taken from Table 1 (A) or Table 3 (B) (see tables for SEMs and n numbers). **,*pKi values obtained for competing ligand significantly differ between fluorescent/radioactive probes (**P < 0.001; One‐way ANOVA).
Impact of incubation time
One clear difference between the experimental conditions used for fluorescent ligand‐binding (1 h incubation) and radioligand‐binding (2 h incubation) studies was incubation time. The initial choice of 1 h for incubation with fluorescent ligands was to limit the potential for uptake of the more lipophilic ligands into the cells, which has been previously observed to increase the nonspecific binding determined in fluorescence intensity measurements (Baker et al. 2011; Gherbi et al. 2014). To explore the potential for the shorter incubation time to be a confounding factor due to differences in the ligand‐binding kinetics of the ligands used (both fluorescent and competing ligands), we repeated the fluorescent ligand experiments with CGP 20712A and CGP 12177 as competing drugs over 2 h incubations. Analysis of these data indicated that there were no significant differences between pKi values obtained with different fluorescent ligands or 3H‐CGP12177 following 2 h incubation (Table 3, Fig. 10B). Here, the IC 50 values for CGP 12177 and CGP 20712A were corrected for the presence of the fluorescent ligand using the Cheng–Prusoff equation and the pKd values for the three fluorescent ligands obtained from saturation analysis at 2 h incubation (Table 2).
Table 3.
Binding affinities of competing ligands determined from inhibition of the specific binding of a 2‐h incubation with 0.9–2.5 nmol/L 3H‐CGP 12177, 100 nmol/L Propranolol‐Peg8‐BY630, 50 nmol/L Propranolol‐ β(Ala‐Ala)‐BY630, or 50 nmol/L CGP‐12177‐TMR in HEK 293 cells expressing a NanoLuc‐tagged human β 1‐adrenoceptor
| 3H‐CGP‐12177 | Propranolol‐Peg8‐BY630 | Propranolol‐β(Ala‐Ala)‐BY630 | CGP‐12177‐TMR | |||||
|---|---|---|---|---|---|---|---|---|
| pKi | n | pKi | n | pKi | n | pKi | n | |
| CGP 12177 | 8.76 ± 0.09 | 5 | 8.51 ± 0.13 | 9 | 8.84 ± 0.14 | 5 | 8.51 ± 0.10 | 9 |
| CGP 20712A | 7.92 ± 0.11 | 5 | 8.17 ± 0.16 | 7 | 8.32 ± 0.16 | 5 | 7.99 ± 0.10 | 8 |
Values show mean ± SEM obtained in n separate experiments. In each individual experiment triplicate determinations were made for each experimental condition. pKi values were determined from IC 50 values using the Cheng–Prusoff equation as described under Methods. pKi values obtained of competing ligand do not significantly differ between fluorescent/radioactive probes (One‐way ANOVA).
Discussion and Conclusions
This study has confirmed that the recently described NanoBRET proximity assay for the study of ligand binding to cell surface GPCRs (Stoddart et al. 2015) can be applied to the human β 1‐adrenoceptor expressed in HEK 293 cells. The presence of the NanoLuc tag on the N‐terminus of the β 1‐adrenoceptor did not prevent a good level of cell surface expression of the receptor, as determined by both single cell bioluminescence imaging of the NanoLuc tag and whole‐cell radioligand‐binding studies with 3H‐CGP 12177 (circa 1500 fmol. mg protein−1). Radioligand‐binding studies with 3H‐CGP 12177 also confirmed that the NLuc‐ β 1‐adrenoceptor had high affinity for the β 1‐adrenoceptor‐selective ligand CGP 20712A and low affinity for the β 2‐adrenceptor antagonist ICI 118551.
Three different fluorescent β‐AR ligands were used to investigate binding to the β 1‐AR in this study: (1) Propranolol‐Peg8‐BY630 (Baker et al. 2011); (2) Propranolol‐ β(Ala‐Ala)‐BY630 (Stoddart et al. 2015), and (3) CGP‐12177‐TMR (Gherbi et al. 2014). Only one of these has been previously used in a NanoBRET ligand‐binding assay, and that was to study binding to a NanoLuc‐tagged human β 2‐adrenoceptor (Stoddart et al. 2015). All three ligands showed good receptor‐specific binding to the human β 1‐adrenoceptor in HEK 293 cells. Their rank order of affinity (K D values) was: CGP‐12177‐TMR (13.4 nmol/L), propranolol‐ β(Ala‐Ala)‐BY630 (38 nmol/L), and propranolol‐Peg8‐BY630 (87.1 nmol/L). Interestingly, this proximity‐based assay allowed ligand binding to be monitored over a wide concentration range and nonspecific binding was not excessive. Nonspecific binding was greatest for propranolol‐ β(Ala‐Ala)‐BY630 and propranolol‐Peg8‐BY630. This is likely to be a consequence of partitioning in the membrane of these more lipophilic ligands in close proximity to the NLuc tag on the β 1‐adrenoceptor.
To investigate further whether these fluorescent ligands could generate a BRET signal with the N‐terminal NLuc‐tag of the β 1‐adrenoceptor from nonspecific partitioning in the adjacent membrane (i.e., in close proximity to the receptor), we studied an unrelated NLuc‐tagged GPCR, namely the histamine H1‐receptor. Interestingly, both propranolol‐ β(Ala‐Ala)‐BY630 and propranolol‐Peg8‐BY630 generated a linear concentration‐dependent increase in energy transfer from the NLuc of the H1‐receptor to the fluorescent ligand that was consistent with some component of the BRET signal being due to the fluorescent ligand in the adjacent plasma membrane. In contrast, when CGP‐12177‐TMR was used as the fluorescent ligand there was no concentration‐dependent increase in nonspecific binding. In the case of both propranolol‐Peg8‐BY630 and CGP‐12177‐TMR, the binding obtained was not inhibited by 10 μmol/L mepyramine, while any effect on propranolol‐ β(Ala‐Ala)‐BY630 was marginal, confirming that it was predominately nonspecific in nature.
The specific binding of each fluorescent ligand to the NL‐β 1‐adrenoceptor was antagonized by a range of antagonists in a manner consistent with that expected of a specific β1‐adrenoceptor interaction. However, closer inspection of the pKi values obtained for individual competing antagonists indicated that some of them varied significantly depending on the particular fluorescent ligand used as the probe (Fig. 10A). This was particularly the case for CGP 12177 and CGP 20712a (Fig. 10A). One clear difference between the experimental conditions used for fluorescent ligand binding and those for radioligand‐binding studies was incubation time. The initial choice of 1 h for incubation with fluorescent ligands was designed to limit the potential for uptake of the more lipophilic ligands into the cells, which tends to increase the nonspecific binding determined in fluorescence intensity measurements (Baker et al. 2011; Gherbi et al. 2014; Rose et al. 2012). However, if the incubation times used for the various assays are not sufficiently long to achieve equilibrium, then over‐ or under‐estimates of pKi values for certain competing ligands may be obtained (Motulsky and Mahan 1984). This may be compounded if the probe or competing drugs are lipophilic and their rate of achieving equilibrium is delayed by membrane‐binding interactions (Sykes et al. 2014; Vauquelin and Charlton 2010; Vauquelin 2010).
Extending the incubation time for the NanoBRET competition assay to 2 h provided consistent measurements of ligand binding with all three fluorescent ligands. Furthermore, in keeping with the above hypothesis, extension of the fluorescent ligand‐binding incubation time from 1 h to 2 h removed any significant probe‐dependent differences in the observed pKi values obtained (Fig. 10B). These data suggest that at the concentrations of fluorescent ligand employed here there is no evidence of probe dependence. The data obtained at the two incubation times also emphasize the importance of ensuring that both the fluorescent and competing ligands are in true equilibrium before interpretations regarding probe dependence can be made.
In summary, we have shown here that a NanoBRET proximity assay can be used to undertake a detailed characterization of the ligand‐binding characteristics of three different fluorescent ligands at the human β 1‐adrenoceptor expressed in living HEK 293 cells. Provided that the incubation time was sufficiently long to achieve equilibrium, the pKi values obtained for four different β‐adrenoceptor antagonists did not provide any evidence for probe dependence at the human β1‐adrenoceptor. Further studies will be required using mutagenesis and kinetic approaches to determine whether there is allosterism across dimer interfaces involving the β 1‐adrenoceptor in HEK 293 cells similar to that observed previously in CHO‐K1 cells (Gherbi et al. 2015).
Author Contributions
Soave, Stoddart, Brown, Woolard, and Hill participated in research design. Soave conducted experiments. Soave and Hill performed data analysis. Soave, Brown, Woolard, and Hill wrote or contributed to the writing of the manuscript.
Disclosures
The authors declare no conflict of interest.
Acknowledgements
We thank the Medical Research Council (0800006), Heptares Therapeutics Ltd. and the University of Nottingham for financial support.
Soave M. , Stoddart L. A. , Brown A. , Woolard J. , Hill S. J.. Use of a new proximity assay (NanoBRET) to investigate the ligand‐binding characteristics of three fluorescent ligands to the human β 1‐adrenoceptor expressed in HEK‐293 cells. Pharma Res Per, 4(5), 2016, e00250, doi:10.1002/prp2.250
References
- Baker JG (2005). Site of action of beta‐ligands at the human β1‐adrenoceptor. J Pharmacol Exp Ther 313: 1163–1171. [DOI] [PubMed] [Google Scholar]
- Baker JG, Hall IP, Hill SJ (2003). Agonist actions of “β‐blockers” provide evidence for two agonist activation sites or conformations of the human β1‐adrenoceptor. Mol Pharmacol 63: 1312–1321. [DOI] [PubMed] [Google Scholar]
- Baker JG, Proudman RG, Hawley NC, Fischer PM, Hill SJ (2008). Role of key transmembrane residues in agonist and antagonist actions at the two conformations of the human β1‐adrenoceptor. Mol Pharmacol 74: 1246–1260. [DOI] [PubMed] [Google Scholar]
- Baker JG, Adams L, Salchow K, Mistry S, Middleton R, Hill SJ, et al. (2011). Synthesis and characterization of high‐affinity 4,4‐difluoro‐4‐bora‐3a,4a‐diaza‐s‐indacene (BODIPY)‐labeled fluorescent ligands for human beta‐adrenoceptors. J Med Chem 54: 6874–6887. [DOI] [PMC free article] [PubMed] [Google Scholar]
- Baker JG, Proudman RG, Hill SJ (2014). Identification of key residues in transmembrane 4 responsible for the secondary, low‐affinity conformation of the human β1‐adrenoceptor. Mol Pharmacol 85: 811–829. [DOI] [PMC free article] [PubMed] [Google Scholar]
- Christopoulos A, Kenakin T (2002). G protein‐coupled receptor allosterism and complexing. Pharmacol Rev 54: 323–374. [DOI] [PubMed] [Google Scholar]
- Corriden R, Kilpatrick LE, Kellam B, Briddon SJ, Hill SJ (2014). Kinetic analysis of antagonist‐occupied adenosine‐A3 receptors within membrane microdomains of individual cells provides evidence of receptor dimerization and allosterism. FASEB J 28: 4211–4222. [DOI] [PMC free article] [PubMed] [Google Scholar]
- Gherbi K, Briddon SJ, Hill SJ (2014). Detection of the secondary low affinity β1‐adrenoceptor site in living cells using the fluorescent CGP 12177 derivative BODIPY‐TMR‐CGP. Br J Pharmacol 171: 5431–5445. [DOI] [PMC free article] [PubMed] [Google Scholar]
- Gherbi K, May LT, Baker JG, Briddon SJ, Hill SJ (2015). Negative cooperativity across β1‐adrenoceptor homodimers provides insights into the nature of the secondary low affinity “CGP 12177″ β1‐adrenoceptor binding conformation. FASEB J 29: 2859–2871. [DOI] [PMC free article] [PubMed] [Google Scholar]
- Granneman JG (2001). The putative β4‐adrenergic receptor is a novel state of the β1‐adrenergic receptor. Am J Physiol Endocrinol Metab 280: E199–E202. [DOI] [PubMed] [Google Scholar]
- Hall MP, Unch J, Binkowski BF, Valley MP, Butler BL, Wood MG, et al. (2012). Engineered luciferase reporter from a deep sea shrimp utilizing a novel imidazopyrazinone substrate. ACS Chem Biol 16: 1848–1857. [DOI] [PMC free article] [PubMed] [Google Scholar]
- Joseph SS, Lynham JA, Colledge WH, Kaumann AJ (2004a). Binding of (‐)‐[3H]‐CGP12177 at two sites in recombinant human β1‐adrenoceptors and interaction with β‐blockers. Naunyn Schmiedebergs Arch Pharmacol 369: 525–532. [DOI] [PubMed] [Google Scholar]
- Joseph SS, Lynham JA, Grace AA, Colledge WH, Kaumann AJ (2004b). Markedly reduced effects of (‐)‐isoprenaline but not of (‐)‐CGP12177 and unchanged affinity of β‐blockers at Gly389‐β1‐adrenoceptors compared to Arg389‐β1‐adrenoceptors. Br J Pharmacol 142: 51–56. [DOI] [PMC free article] [PubMed] [Google Scholar]
- Kaumann AJ, Molenaar P (2008). The low‐affinity site of the β1‐adrenoceptor and its relevance to cardiovascular pharmacology. Pharmacol Ther 118: 303–336. [DOI] [PubMed] [Google Scholar]
- Kaumann AJ, Engelhardt S, Hein L, Molenaar P, Lohse M (2001). Abolition of (‐)‐CGP 12177‐evoked cardio stimulation in double β1/β2‐adrenoceptor knockout mice. Obligatory role of β1‐adrenoceptors for putative β4‐adrenoceptor pharmacology. Naunyn Schmiedebergs Arch Pharmacol 363: 87–93. [DOI] [PubMed] [Google Scholar]
- Konkar AA, Zhu Z, Granneman JG (2000). Aryloxypropanolamine and catecholamine ligand interactions with the β1‐adrenergic receptor: evidence for interaction with distinct conformations of β1‐adrenergic receptors. J Pharmacol Exp Ther 294: 923–932. [PubMed] [Google Scholar]
- Lowe MD, Lynham JA, Grace AA, Kaumann AJ (2002). Comparison of the affinity of β‐blockers for two states of the β1‐adrenoceptor in ferret ventricular myocardium. Br J Pharmacol 135: 451–461. [DOI] [PMC free article] [PubMed] [Google Scholar]
- Lowry OH, Rosebrough NJ, Farr AL, Randall RJ (1951). Protein measurement with the Folin phenol reagent. J Biol Chem 193: 265–275. [PubMed] [Google Scholar]
- May LT, Leach K, Sexton PM, Christopoulos A (2007). Allosteric modulation of G protein‐coupled receptors. Annu Rev Pharmacol Toxicol 47: 1–51. [DOI] [PubMed] [Google Scholar]
- May LT, Self TJ, Briddon SJ, Hill SJ (2010). The effect of allosteric modulators on the kinetics of agonist‐G protein‐coupled receptor interactions in single living cells. Mol Pharmacol 78: 511–523. [DOI] [PMC free article] [PubMed] [Google Scholar]
- May LT, Bridge LJ, Stoddart LA, Briddon SJ, Hill SJ (2011). Allosteric interactions across native adenosine‐A3 receptor homodimers: quantification using single‐cell ligand‐binding kinetics. FASEB J 25: 3465–3476. [DOI] [PMC free article] [PubMed] [Google Scholar]
- Molenaar P, Chen L, Semmler AB, Parsonage WA, Kaumann AJ (2007). Human heart beta‐adrenoceptors: β1‐adrenoceptor diversification through ‘affinity states’ and polymorphism. Clin Exp Pharmacol Physiol 34: 1020–1028. [DOI] [PubMed] [Google Scholar]
- Motulsky HJ, Mahan LC (1984). The kinetics of competitive radioligand binding predicted by the law of mass action. Mol Pharm 25: 1–9. [PubMed] [Google Scholar]
- Pak MD, Fishman PH (1996). Anomalous behavior of CGP 12177A on β1‐adrenergic receptors. J Recept Signal Transduct Res 16: 1–23. [DOI] [PubMed] [Google Scholar]
- Rose RH, Briddon SJ, Hill SJ (2012). A novel fluorescent histamine H1 receptor antagonist demonstrates the advantage of using fluorescence correlation spectroscopy to study the binding of lipophilic ligands. Br J Pharmacol 165: 1789–1800. [DOI] [PMC free article] [PubMed] [Google Scholar]
- Staehelin M, Simons P, Jaeggi K, Wigger N (1983). CGP‐12177. A hydrophilic β‐adrenergic receptor radioligand reveals high affinity binding of agonists to intact cells. J Biol Chem 258: 3496–3502. [PubMed] [Google Scholar]
- Schindelin J, Arganda‐Carreras I, Frise E, Kaynig V, Longair M, Pietzsch T, Preibisch S, Rueden C, Saalfeld S, Schmid B, Tinevez J‐Y, White DJ, Hartenstein V, Eliceiri K, Tomancak P, Cardona A (2012). Fiji: an open‐source platform for biological‐image analysis. Nat Methods 9: 676–682. [DOI] [PMC free article] [PubMed] [Google Scholar]
- Stoddart LA, Johnstone EKM, Wheal AJ, Goulding J, Robers MB, Machleidt T, et al. (2015). Application of BRET to monitor ligand binding to GPCRs. Nat Methods 12: 661–663. [DOI] [PMC free article] [PubMed] [Google Scholar]
- Sykes DA, Parry C, Reilly J, Wright P, Fairhurst RA, Charlton SJ (2014). Observed drug‐receptor association rates are governed by membrane affinity: the importance of establishing “micro‐pharmacokinetic/pharmacodynamic relationships” at the β2‐adrenoceptor. Mol Pharmacol 85: 608–617. [DOI] [PubMed] [Google Scholar]
- Vauquelin GV (2010). Rebinding: or why drugs may act longer in vivo than expected from their in vitro target residence time. Expert Opin Drug Discov 5: 927–941. [DOI] [PubMed] [Google Scholar]
- Vauquelin GV, Charlton SJ (2010). Long‐lasting target binding and rebinding as mechanisms to prolong in vivo drug action. Br J Pharmacol 161: 488–508. [DOI] [PMC free article] [PubMed] [Google Scholar]