Abstract
Three uncommon morpholine-based fluorescent probes (A, B and C) for pH were prepared by introducing morpholine residues to BODIPY dyes at 4,4’- and 2,6-positions, respectively. In contrast to morpholine-based fluorescent probes for pH reported in literature, these fluorescent probes display high fluorescence in a basic condition while they exhibit very weak fluorescence in an acidic condition. The theoretical calculation confirmed that morpholine is unable to function as either an electron donor or an electron acceptor to quench the BODIPY fluorescence in the neutral and basic condition via photo-induced electron transfer (PET) mechanism because the LUMO energy of morpholine is higher than those of the BODIPY dyes while its HOMO energy is lower than those of the BODIPY dyes. However, the protonation of tertiary amines of the morpholine residues in an acidic environment leads to fluorescence quenching of the BODIPY dyes via d-PET mechanism. The fluorescence quenching is because the protonation effectively decreases the LUMO energy which locates between the HOMO and LUMO energies of the BODIPY dyes. Fluorescent probe C with deep-red emission has been successfully used to detect pH changes in mammalian cells.
Keywords: BODIPY dye, Morpholine moiety, Intracellular pH, Photoinduced electron transfer (PET)
Intracellular pH (pHi) functions to regulate many cellular behaviors such as cell volume regulation, vesicle trafficking, cellular metabolism, cell membrane polarity, cellular signaling, and cell activation, growth, proliferation, apoptosis, enzyme activity and protein degradation. The pHi inside cells may vary considerably among subcellular compartments such as the cytosol, mitochondria, endoplasmic reticulum, endosome, lysosome, and nucleus. The pHi in a typical mammalian cell can range from 4.7 in lysosome to 8.0 in mitochondria. The lysosomal acidic environment activates enzymes to facilitate the degradation of proteins during cellular breakdown. Disruptive pHi variations in organelles can lead to dysfunction of the organelles that can result in pathophysiology in humans triggering cancer, stroke, and/or Alzheimer’s disease. Therefore, it is very important to monitor pH changes inside living cells in order to investigate cellular functions that can provide insight into physiological and pathological processes. Fluorescence-based techniques such as fluorescence microscopy and flow cytometry with high-resolution and high-throughput analysis have been widely used to investigate intact subcellular pH and possess many technical and practical advantages over other methods because of their high sensitivity, operational simplicity, and unrivaled spatial and temporal resolution. Many fluorescent probes for pH have been developed. However, only a few of them have been successfully used to monitor lysosomal pH inside living cells.1-8 Most fluorescent probes for lysosomal pH, including the commercial probes have used morpholine residues for their selective accumulation in acidic lysosomes through protonation of the tertiary amine groups in a cellular acidic environment.9 The fluorescence enhancement results from the suppression of photo-induced electron transfer (PET) of the tertiary amine attached to the probe.9 Our hypothesis was that fluorescent probes based on morpholine could display unusual responses to pH if we could effectively manipulate HOMO and LUMO energy orbitals of fluorophores so that the tertiary amines from morpholine residues were unable to serve as electron donors to quench the fluorophore fluorescence via a-PET (“a” denotes fluorophore serve as electron acceptor) mechanism while the protonated morpholine moieties can function as electron acceptor to quench the fluorescence of the fluorophore via d-PET (“d” denotes excited fluorophore serve as electron donor) mechanism. In this paper, we reported three uncommon morpholine based fluorescent probes (A, B and C) to sense pH which were prepared by introducing morpholine residues to BODIPY dyes at 4,4’-positions and 2,6-positions, respectively (Figure 1). The fluorescent probes display high fluorescence in a basic condition. However, they exhibit very weak fluorescence in an acidic condition. The theoretical calculation showed that the LUMO energy of morpholine is higher than those of the BODIPY dyes while its HOMO energy is lower than those of the BODIPY dyes. As a result, morpholine is unable to serve as an electron donor or an electron acceptor to quench the BODIPY fluorescence in the neutral and basic conditions via PET mechanism. Furthermore, the protonation of tertiary amines of the morpholine residues in an acidic environment effectively decreases the LUMO energy so that it locates between the HOMO and LUMO energies of the BODIPY dyes, resulting in fluorescence quenching of the BODIPY dyes via d-PET mechanism. These probes also possesses great photostability and selectivity at different pH values. Among them, fluorescent probe C has more advantages for live cell fluorescence imaging because of its long emission wavelength, large Stokes shifts and high pKa near physiological pH and it displays turn-on fluorescence responses to the increasing intracellular pH, demonstrating the potential applications for non-invasive monitoring pH changes inside of living cells.
Figure 1.
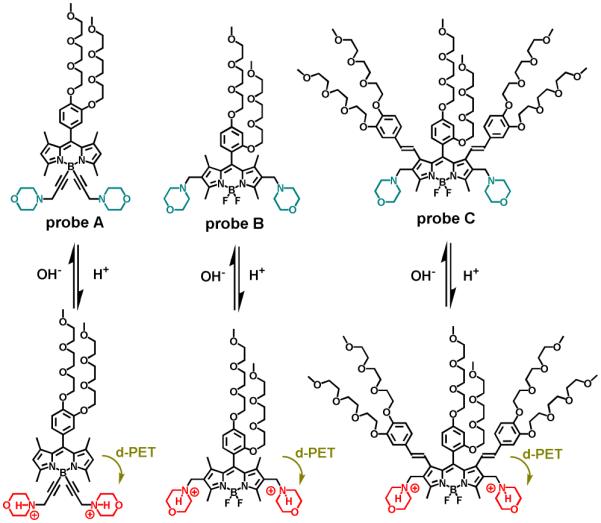
Chemical structures of fluorescent probes A, B and C and their responses to acid and base.
Experimental section
Instrumentation
1H NMR and 13C NMR spectra were collected by 400 MHz Varian Unity Inova NMR spectrophotometer instrument. 1H and 13C NMR spectra were recorded in CDCl3 and DMSO-d6 solutions. Chemical shifts (δ) are given in ppm with solvent residual peaks (1H: δ 7.26 for CDCl3,δ 2.50 for DMSO-d6; 13C: δ 77.3 for CDCl3) as internal standards. HRMS were measured with electrospray ionization (ESI) mass spectrometer. Absorption spectra were taken on a Perkin Elmer Lambda 35 UV/VIS spectrometer. Fluorescence spectra were recorded on a Jobin Yvon Fluoro-max-4 spectrofluorometer.
Materials
Unless specific indicated, all reagents and solvents were obtained from commercial suppliers and used without further purification. Compound 2 was prepared according to the reported literature10
Fluorescent probe A
1H NMR (400 MHz, CDCl3 ): δ 6.99 (d, J = 8 Hz, 1H), 6.85 (d, J = 2 Hz, 1H), 6.82 (dd, J = 2, 8 Hz, 1H), 6.00 (s, 2H), 4.21 (t, J = 5.2 Hz, 2H), 4.12 (t, J = 5.2 Hz, 2H), 3.91 (t, J = 5.2 Hz, 2H), 3.86 (t, J = 5.2 Hz, 2H), 3.79 – 3.51 (m, 24H), 3.38 (s, 3H), 3.36 (s, 3H), 3.28 (s, 4H), 2.73 (s, 6H), 2.56 (br, 8H), 1.45 (s, 6H). 13C NMR (100 MHz, CDCl3): δ 155.1, 149.9, 149.5, 141.2, 130.1, 128.6, 121.5, 114.8, 114.6, 72.2, 71.2, 71.0, 70.9, 70.8, 70.0, 69.3, 69.0, 67.2, 59.3, 52.48, 7.8, 16.5, 15.0. HRMS (ESI): calculated for C47H67BN4O10Na [M+Na] , 881.4842; found, 881.4832.
Fluorescent probe B
1 H NMR (400 MHz, CDCl3): δ 6.95 (d, J = 8 Hz, 1H), 3.59 – 3.55 (m, 2H), 4.13 (t, J = 4.8 Hz, 2H), 4.01 (t, J = 4.8 Hz, 2H), 3.86 (t, J = 4.8 Hz, 2H), 3.74 – 3.28 (m, 32H), 3.15 (s, 4H), 2.52 (s, 6H), 2.31 (br, 13 8H), 1.42 (s, 6H). C NMR (100 MHz, CDCl3): δ 161.2, 156.8, 155.2, 141.1, 138.7, 131.5, 130.2, 126.2, 117.2, 106.5, 100.7, 72.1, 72.0, 71.1, 71.0, 70.8, 70.7, 70.6, 70.4, 69.8, 69.2, 68.9, 67.8, 67.2, 59.2, 59.1, 53.5, 52.1, 12.9, 11.8. HRMS (ESI): calculated for C43 H64 BF2 N4 O10 [M-H]−, 845.4792; found, 845.4809.
Fluorescent probe C
1H NMR (400 MHz, CDCl ): δ 7.18 – 7.09 (m, 3H), 6.77 (d, J = 8 Hz, 2H), 6.45 (s, 1H), 5.90 (d, J = 16 Hz, 2H), 4.14 (t, J = 5.2 Hz, 4H), 4.07 (t, J = 5.2 Hz, 4H), 3.90 – 3.40 (m, 72H), 3.38 (s, 3H), 3.37 (s, 6H), 3.36 (s, 3H), 3.34(s, 6H), 3.31 (s, 3H), 3.23(brs, 4H), 2.62 (s, 6H), 2.50 (s, 8H). 13C NMR (100 MHz, CDCl ): δ 172.5, 161.3, 157.8, 149.0, 148.9, 146.2, 142.7, 135.0, 131.3, 129.2, 124.3, 120.1, 114.4, 111.9, 106.7, 100.3, 97.5, 71.9, 71.8, 71.0, 70.8, 70.7, 70.6, 70.5, 70.4, 70.2, 69.7, 68.8, 68.6, 58.9. HRMS (ESI): calculated for C H BF N O [M-H]−, 1669.8987; found, 1669.8971.
Optical measurement
20 mM citrate-phosphate-borate buffer was used for pH dependency and photostability measurements of fluorescent probes. To avoid the interference caused by metalphosphate and metal-citrate binding interactions (forming precipitates of divalent cation phosphate and forming complex of the metal-citrate), 10 mM KHP buffer (pH 4.0) and 10 mM HEPES (pH 7.4) buffer were used for selectivity measurements of fluorescent probes A, B and C.
Computational modeling
Electronic properties of the chemical structures of all the fluorescent probes were calculated using density functional theory (DFT) incorporating Hartree–Fock (HF) exchange with DFT exchange–correlation. In particular, the hybrid functional B3LYP11-13 and all electron basis sets 6-311G (2d, 2p)14 as implemented in the Gaussian09 suite of programs15 were used for full geometry optimization of the probes. HOMO and LUMO were calculated for the optimized geometries. All calculations were performed in vacuum.
Live cell fluorescence imaging
Normal endothelial cells HUVEC-C (from ATCC) were plated on 12-well culture plates at 1 × 10⁵ cells/well and were incubated at 37 °C in 5% CO2 incubator overnight. Next day, the medium was removed and cells were rinsed twice with 1x PBS (pH 7.4) followed by incubation with probe C for 2 h at 5 μM, 15 μM, or 25 μM concentrations in fresh serum free media containing 1 μM LysoSensor Green DND-189 (Life Technologies). Hoechst 33342 (Sigma-Aldrich) dye was added at 1 μg·mL−1 and the cells were further incubated for 10 minutes. After incubation, the medium was removed, cells were gently rinsed with PBS (pH 7.4) three times. The cells were treated with nigericin (5 μg·mL−1) in potassium rich PBS with pH range from 5.5, 6.5, 7.5 to 8.5, and incubated further for 15 min. Live cell images were acquired using an inverted fluorescence microscope (AMF-4306, EVOSfl, AMG) with DAPI filter for Hoechst 33342 (Sigma-Aldich), GFP filter for LysoSensor Green, and RFP filter for fluorescent probe C. The fluorescence images were obtained at 40× magnification. The exposure times for each filter were kept constant. Co-localization analysis based on Pearson's coefficient was done using JACoP plugin from ImageJ.16
Results and discussion
Synthetic approach
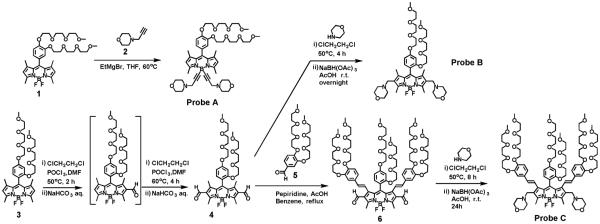
In order to prepare morpholine-functionalized BODIPY-based fluorescent probes for pH, we incorporated morpholine moieties onto the BODIPY core at 4,4’-positions and 2,6-positions while we introduced ortho-or meta-substituent group of tri(ethylene glycol)methyl ether on the meso-phenyl rings and at 1,7-positions of BODIPY dyes to enhance their hydrophilicity and solubility in polar solvents (Scheme 1). Fluorescent probe A was prepared by replacing fluorine atoms of BOIDPY dye 1 at 4,4’-positions with 4-prop-2-ynyl-morpholine (2) (BODIPY dye 1 was synthesized according our reported procedures17 via a Grignard reaction. In order to incorporate morpholine moieties onto 2,6-positions of BODIPY core, formyl groups were introduced to the BODIPY dye 3 (it was also synthesized according to our reported procedures)18-19 at 2,6-positions via two-step Vilsmeier-Haack reactions, affording 2,6-diformyl BODIPY dye 4. Then a reductive amination of BODIPY dye 4 with morpholine was carried out by using sodium acetoxyborohydride to yield fluorescent probe B. To tune the BOIDPY core of fluorescence probe to longer emission wavelengths with smaller HOMO-LUMO energy gap, a Knoevenagel condensation of BODIPY dye 4 with benzaldehyde derivative (5) was conducted. The presence of formyl groups of BODIPY dye 4 at 2,6-positions initiated formation of distyryl bonds at 1,7-positions instead of 3,5-positions, yielding 2,6-diformyl-1,7-distyryl-BODIPY dye (6), which was confirmed by the clear disappearance of 1,7-methyl proton peak at 1.85 ppm and the preservation of 3,5-methyl proton peak at 2.92 ppm in 1H NMR spectrum of BODIPY dye 6 (please see Figures S3 and S7 in supporting information). This is because the 1,7-methyl groups become activated by introduction of formyl groups at 2,6-positions to BODIPY core, which has been discussed in our previous paper.17 1,7-distyryl BODIPY dye bearing morpholine groups at 2,6-positions (fluorescent probe C) was obtained by amination of BODIPY dye 6 with morpholine using sodium acetoxyborohydride in the same approach to prepare fluorescent probe B. Fluorescent probes A, B and C are easily dissolved in common organic solvents such as dichloromethane, ethanol, THF, DMF and DMSO. They can be readily dissolved in aqueous solution with the help of small amount of polar organic solvent as the polar co-solvent such as DMSO because of the hydrophilic features of tri(ethylene glycol)methyl ether residues and morpholine residues on the BODIPY cores.
Scheme 1.
Synthetic route to fluorescent probes A, B and C.
Optical properties
Fluorescent probe A displays absorption and emission peaks of BODIPY dyes at 498 nm and 508 nm in ethanol, respectively. The fluorescence quantum yield of probe A in ethanol is 56%. Fluorescent probe B shows absorption and emission peaks at 515 and 529 nm with a fluorescence quantum yield of 8%, and exhibits 17 nm and 21 nm red shifts in absorption and emission spectra in ethanol, respectively, compared with fluorescent probe A. The red shifts in absorption and emission peaks of fluorescent probe B may be due to the enhanced electron donating effect of methylene groups with adjacent electrondonating tertiary amines from the morpholine groups at 2,6-positions to the BODIPY core compared with methyl groups of fluorescent probe A at 2,6-positions, resulting in a decreased HOMO-LUMO energy gap. Compared with fluorescent probes A and B, the significant red shifts in both absorption and emission spectra were observed for fluorescent probe C with absorption and emission peaks at 565 and 652 nm in ethanol solution, respectively, because of its significantly enhanced π-conjugation via its distyryl groups at 1,7-positions. In addition, we examined the optical properties of fluorescent probes A, B and C in aqueous solution at physiological pH (with 1% DMSO as co-solvent). Fluorescent probes A and B show similar absorption and emission bands in aqueous solution with negligible shifts compared with those in ethanol while fluorescent probe C, with an enlarged Stokes shifts of 115 nm in aqueous solution which is 28 nm larger than its Stokes shift of 87 nm in ethanol, was interestingly observed with 15 nm blue shift in absorption peak and 13 nm red shift in emission peak relative to its absorption and emission peaks in ethanol (see Table S1 in supporting information). The fluorescence quantum yields of the fluorescent probes A, B and C significantly dropped from ethanol to buffer solution (pH 7.4) as fluorescent probes show fluorescence quantum yields of 18%, 1.3% and 0.32% in buffer solution compared with those of 56%, 8% and 8.6% in ethanol solution, respectively. The low fluorescence quantum yields of the fluorescent probes in aqueous solution may result from fluorescence self-quenching due to the potential dye aggregations in aqueous solution.
Optical responses of fluorescent probes to pH
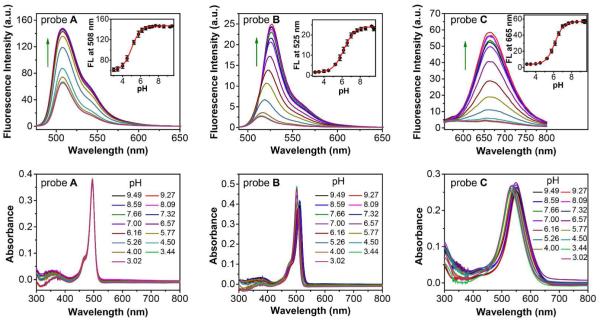
We investigated the pH effect of fluorescent probes A, B, C, and their intermediates (BODIPY dyes 1, 4 and 6) in buffer solution. There were no obvious changes observed in both absorption and emission spectra of all intermediates 1, 4 and 6 in different pH conditions (see Figure S11 in supporting information). However, fluorescent probes A, B and C exhibit very sensitive fluorescent responses to pH. They show very low fluorescence in acidic condition while most morpholine-functionalized fluorescent probes reported in the literature are highly fluorescent in acidic condition because of the prohibited a-PET effect from morpholine moiety to the fluorophore through the protonation of morpholine moiety. However, change of the pH from an acidic condition of 3.02 to a basic condition of 9.49 results in significant increases of fluorescence intensity of fluorescent probes A, B and C with 2.4-fold, 15.7-fold and 14.3-fold enhancements, respectively (Figure 2). This unique pH-dependent behavior of the probes is in agreement with our hypothesis that protonated morpholine moieties can function as electron acceptors to quench the fluorescence of the BODIPY dye via d-PET mechanism while the tertiary amines from morpholine residues are unable to serve as electron donors to quench the BODIPY dye fluorescence via a-PET mechanism when the HOMO and LUMO energy orbitals of the BODIPY dye are controlled in a certain range. Fluorescent probe A shows a significant fluorescence intensity change between pH 4.0 and pH 6.2 with a pKa of 5.04 while the significant fluorescence changes of fluorescent probes B and C shift to the window between pH 4.5 to pH 7.4 with pKa of 6.16 and 6.15, respectively (Figure 2). The different pKa values indicate the different availability (or basicity) of the nitrogen lone-pair electrons on the morpholine moieties of the probes for protonation, where fluorescent probe A possesses the least availability due to the electron-withdrawing property of the alkyne groups adjacent to the morpholine moieties. In addition, 11-nm and 10-nm blue shifts in fluorescence and absorption spectra were observed for probe B, respectively, when pH decreases from 9.49 to 3.02. The blue shifts may arise from weaker electron donating effect of methylene groups with adjacent electron-withdrawing protonated tertiary amines from morpholine moieties at 2,6-positions in an acid condition. The similar blue shifts (13 nm and 16 nm shifts in fluorescence and absorption, respectively) of probe C were also observed due to the same weaker electron-donating effect of methylene groups at 2,6-positions in an acid condition. In addition, the absorbance of probes A, B and C at 470 nm, 480 nm and 535 nm respectively, which were used as the excitation wavelengths for their corresponding fluorescence spectra, display negligible changes under different pH values, (Figure 2). This further indicates that the pH responses of the probes are mainly due to d-PET effect instead of the absorbance change.
Figure 2.
Fluorescence (upper row) and absorption spectra (lower row) of fluorescent probes A, B and C (5 μM) in buffer solution with different pH conditions (1% DMSO as co-solvent). Insets in upper row: the corresponding curves of fluorescence intensity versus pH.
Theoretical modeling
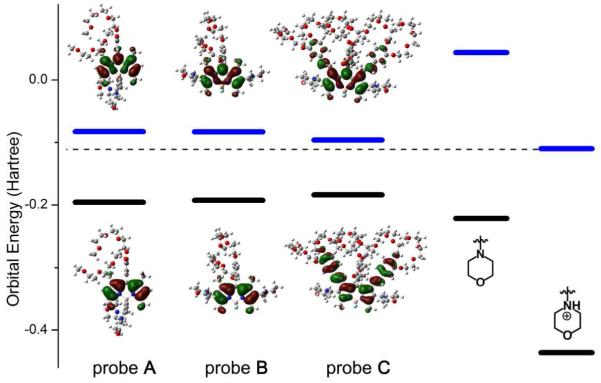
In order to further reveal the structural properties of the fluorescent probes, and more importantly, to verify the hypothesis that the fluorescent probes respond to pH via a modulation of d-PET effect from BODIPY core to protonated morpholine moieties at different pH conditions, we calculated the HOMOs and LUMOs of fluorescent probes A, B and C, N-methylmorpholine and protonated N-methylmorpholine using density functional theory (DFT-B3LYP/6-311G(2d,2p)). The obtained results are shown in Figure 3. The results show that fluorescent probe B has a slightly smaller HOMO-LUMO energy gap (2.97 eV) than that of fluorescent probe A (3.07 eV), indicating a mild electron donating effect of methylene groups with adjacent electron-donating tertiary amine groups to the BODIPY core at 2,6-positions. This is in accord with the spectra red shifts observed in absorption and emission spectra of fluorescent probe B relative to those of fluorescent probe A in a basic condition (Figure 2 and Table S1 in supporting information). Fluorescent probe C possesses the smallest energy gap (2.39 eV) among three probes; the increasing in the HOMO and the decreasing in the LUMO arise from the enhanced π-conjugation occurring via the distryl groups on the BODIPY core at 1,7-positions. The density distributions of HOMO-and LUMO-electrons on the probes show that there are no π-electrons spared onto the morpholine moieties for any of the three probes (Figure 3), indicating that the morpholine moieties are isolated from π-conjugations of the BODIPY cores. We calculated the HOMO and LUMO energy of morpholine moieties before and after protonation using N-methylmorpholine as a model. As we expected, the calculated HOMO energy of morpholine moieties is lower than those of all three probes while its LUMO energy is higher than those of all three probes. This leads to a prohibited a-PET effect from morpholine moiety to the probe core. However, the protonation of the morpholine moiety in acidic condition dramatically reduces its HOMO and LUMO energies so that the LUMO energy of protonated morpholine moiety lies between of the HOMO and LUMO energies of the probes. As a result, the protonated morpholine moiety is able to serve as an electron acceptor allowing for the electron transition be possible from the LUMO of the fluorescent probes A, B or C to the LUMO of protonated morpholine moiety, resulting in the fluorescence quenching of the probes via a d-PET effect.
Figure 3.
Comparisons of calculated HOMO and LUMO energies of fluorescent probes A, B and C, morpholine moiety (N-methylmorpholine) and protonated morpholine moiety (protonated N-methylmorpholine), as well as the electron density distributions in HOMO and LUMO of fluorescent probes A, B and C.
Selectivity and photostability
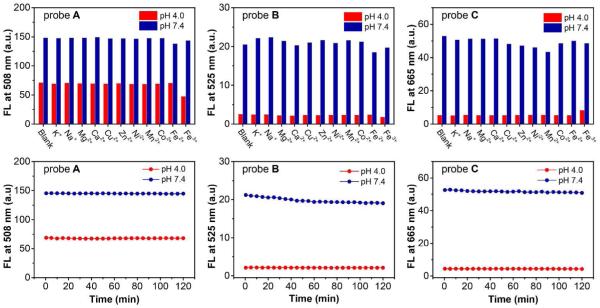
Considering the potential binding events between amines and metal ions when applying the fluorescent probes in complex environments such as physiological condition, we further investigate selectivity of fluorescent probes to pH over other metal ions. The results showed that 5 μM fluorescent probes A, B and C display excellent selective responses to pH over other metal ions because there is no significant change observed in terms of fluorescence intensity of the probes in the absence and presence of different metal ions (200 μM) such as K+, Na+, Mg2+ and Ca2+, Cu2+, Zn2+, Ni2+,Mn2+, Co2+, Fe2+ and Fe3+ in buffer solution at pH 4.0 and 7.4(Figure 4, upper row). We also studied the photostability of fluorescent probes A, B and C in both acidic (pH 4.0) and near neutral conditions (pH 7.4). Under 2-hour excitation (with excitation wavelength of 470 nm, 490 nm and 580 nm for fluorescent probes A B and C, respectively), fluorescent probe A showed an excellent photostability with less than 1% decrease of fluorescence intensity within 2 hours. Fluorescent probes B and C also showed very good photostability in pH 4.0 as fluorescent probe A. While in pH 7.4, the fluorescence intensity of fluorescent probe B decreased by 7.5% in the first hour and further decreased by 2% in the second hour under excitation and fluorescent probe C had a gradually decrease by 3% in fluorescence intensity within 2-hour excitation (Figure 4, lower row).
Figure 4.
Upper row: fluorescence responses of fluorescent probes A, B and C (5 μM) to pH at 4.0 and 7.4 in the absence and presence of various metal ions (200 μM) in buffer solutions (with 1% DMSO as co-solvent). Lower row: fluorescence intensities changes of fluorescent probes A, B and C (5 μM) as a function of time in 2 hours under excitation in buffer solutions (1% DMSO as co-solvent) at pH 4.0 and 7.4.
In-vitro cell imaging and intracellular pH detection
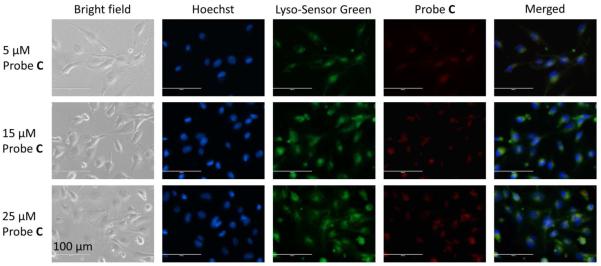
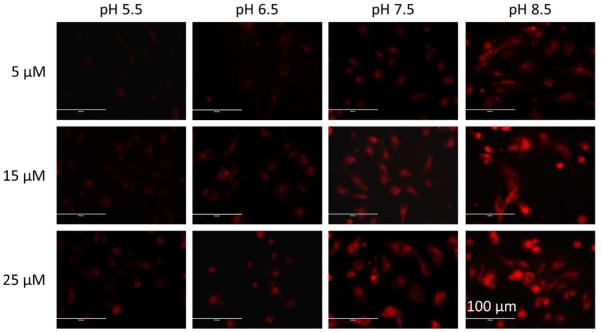
In order to determine if the fluorescent probes could selectively detect change in intracellular pH of live cells, we chose the fluorescent probe C for live cell fluorescence imaging with normal endothelial (HUVEC-C) cells at different intracellular pH values. This is because fluorescent probe C has sensitive pH responses (14.3-fold enhancement from pH 3.02 to pH 9.49), pKa value near physiological pH, deep-red emission that prevents the cell damage, and large Stokes shift (115 nm in buffer solution at pH 7.4) that minimizes the potential interference caused by excitation signals. It should be noted that many reported morpholine contained fluorescent probes and dyes show labeling of lysosomes and other acidic organelles in mammalian cells due to their accumulative effect of tertiary amines on the morpholine moieties in acidic condition.9 Therefore, to investigate whether our probe could respond to intracellular pH by identifying these inherently acid compartments and the corresponding probe concentration effect, we first incubated HUVEC-C cells with 5 μM, 15 μM and 25 μM fluorescent probe C and compared with a well-known commercial lysosome probe, LysoSensor Green DND-189 that specifically labels the acidic organelles in cells. The results show that probe C exhibited very weak fluorescence signals in all three concentrations although slight fluorescence enhancements could be observed with increased probe concentrations (Figure 5). The merged fluorescence images shows green-yellowish areas around nucleus and many green-yellowish dot structures also can be observed by a careful examination (Figure 5). The calculated Pearson’s coefficients of red (fluorescent probe C) and green (LysoSensor Green) channels are 0.92, 0.85 and 0.88 for 5 μM, 15 μM and 25 μM probe C, respectively (please see Figures S15-S17 in supporting information for cytofluorograms). The results indicate the area stained by the fluorescent probe C matches those stained by LysoSensor Green DND-189 in cells, which confirms fluorescent probe C mainly stained lysosomes or other acidic organelles in cells (Figure 5). Therefore, the weak fluorescence of probe C observed in the cells is able to be elucidated via a d-PET modulated fluorescence quenching by the protonated morpholine moieties under lysosomal pH (4.5-5.5), which demon-strates the ability of pH response for probe C to the inherent acidic environment in live cells. In order to examine the fluorescence responses of fluorescent probe C to different pH inside of cells, we further incubated HUVEC-C cells with 5 μM, 15 μM and 25 μM fluorescent probe C in buffer solutions (K+ rich PBS) at pH 5.5, 6.5, 7.5, or 8.5 having nigericin (H+/K+ ionophore). Nigericin is a widely used ionophore for adjusting the intracellular pH (pHi) through equilibrating the intracellular and extracellular pHs. At all three concentrations, fluorescent probe C displayed very weak fluorescence at acidic pH (pH 5.5), whereas its fluorescence intensity showed gradual enhancement as intracellular pH increased from 5.5 to 8.5 (Figure 6). In addition, at each intracellular pH, higher probe concentration resulted in stronger fluorescence signals (Figure 6). These responses of fluorescent probe C to intracellular pH are in line with its optical responses to pH in buffer solutions (Figure 2), which further proved the d-PET mechanism of fluorescent probe C at different pH in live cells. However, the commercial lysosome probe LysoSensor Green DND-189 did not exhibit any change in fluorescence upon change of intracellular pH (please see Figures S18-S20 in supporting information).
Figure 5.
Fluorescence images of HUVEC-C cells incubated with 5 μM, 15 μM, or 25 μM fluorescent probe C. HUVEC-C cells were incubated with fluorescent probe C for 2 h, post serum starvation (2 h) and imaged for co-localization with 1 μM LysoSensor Green and (1 μg·mL−1) Hoechst 33342 stains. Images were acquired using the inverted fluorescence microscope (AMF-4306, EVOSfl, AMG) at 40× magnification, scale bars = 100 μm.
Figure 6.
Fluorescence images of HUVEC-C cells incubated with 5 μM, 15 μM, or 25 μM fluorescent probe C in buffers at different pH values of 5.5, 6.5, 7.5, or 8.5 having nigericin. Images were acquired using the inverted fluorescence microscope (AMF-4306, EVOSfl, AMG) at 40× magnification, scale bars = 100 μm.
We also investigated the toxicity of fluorescent probe C to HUVEC-C cells using MTS assay (Figure 7). At low concentration of 5 μM, the fluorescent probe C provided more than 80% cell viability, when the concentration increased to 15 μM, the cell viability dropped to 60-70%, indicating the low to moderate toxicity of fluorescent probe C to the cells in this concentration range. However, fluorescent probe C at higher concentrations like 25 μM and 50 μM were very toxic to the cells as less than 10% cell viability were observed, which may limit the application of the probe C with this high concentrations, and the reason for this toxicity is still under investigation. However, we are still able to effectively image and visualize pH changes by using low concentration of probe C (with less than 15 μM) with the relative low cellular toxicity.
Figure 7.
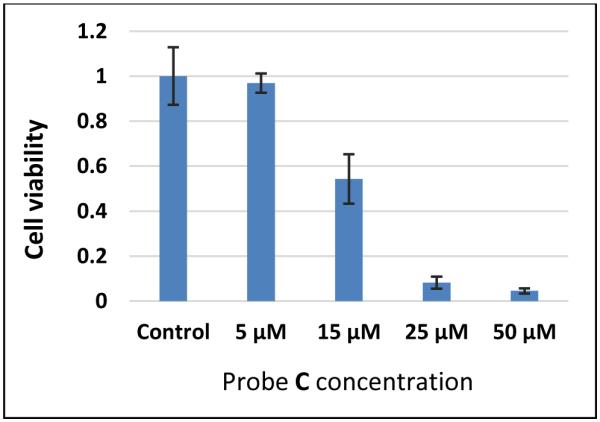
Effects of fluorescent probe C on cell proliferation measured by MTS assay. HUVEC-C cells were incubated with 5 μM, 15 μM, 25 μM, or 50 μM of fluorescent probe C for 48 h. To this 20 μL of MTS reagent was added per well and absorbance at 490 nm was measured to determine cell viability. Error bars indicate ± SD.
Conclusion
We have successfully prepared three pH sensitive morpholine-functionalized fluorescent probes A, B and C. These probes display unusual pH responses in aqueous solutions with high fluorescence in basic conditions while their fluorescence get quenched in acidic condition due to the d-PET effect from protonated morpholine moieties to the BODIPY cores. All three probes are photostable and display selectively responses to pH over common metal ions. Fluorescent probe C provided a potential non-invasive method with deep-red fluorescence and low background for monitoring intracellular pH changes inside of living cells.
Supplementary Material
Acknowledgments
Funding Sources
This research reported in this publication was supported by the National Institute of General Medical Sciences of the National Institutes of Health under Award Number R15GM114751 (to H.Y. Liu and A. Tiwari). The research was also partially supported by the National Science Foundation (award number 1048655) (to H. Y. Liu), Michigan Technological University faculty start-up fund, and Research Excellence Fund (to A. Tiwari).
Footnotes
Supporting Information Available: The following files are available free of charge. Morpholine_BODIPY_Dyes_intracellular_pH_SI.pdf: The detailed synthetic procedures, 1H-and 13C-NMR spectra of BODIPY dyes 4 and 6, fluorescent probes A, B and C, detailed supplemental optical spectra of fluorescent probes A, B, C and their precursors (BODIPY dyes 1, 4 and 6) at different pH and in the presence of different metal ions, MTS method and the fluorescence images of HUVEC-C cells with probe C at different concentrations are included. This material is available free of charge via the Internet at http://pubs.acs.org
REFERENCES
- (1.).Han JY, Burgess K. Fluorescent Indicators for Intracellular pH. Chem. Rev. 2010;110:2709–2728. doi: 10.1021/cr900249z. [DOI] [PubMed] [Google Scholar]
- (2.).Fan JL, Dong HJ, Hu MM, Wang JY, Zhang H, Zhu H, Sun W, Peng XJ. Fluorescence Imaging Lysosomal Changes During Cell Division and Apoptosis Observed Using Nile Blue Based Near-infrared Emission. Chem. Commun. 2014;50:882–884. doi: 10.1039/c3cc48043g. [DOI] [PubMed] [Google Scholar]
- (3.).Fan JL, Lin CY, Li HL, Zhan P, Wang JY, Cui S, Hu MM, Cheng GH, Peng XJ. A Ratiometric Lysosomal pH Chemosensor Based on Fluorescence Resonance Energy Transfer. Dyes Pigm. 2013;99:620–626. [Google Scholar]
- (4.).Zhang H, Fan JL, Dong HJ, Zhang SZ, Xu WY, Wang JY, Gao P, Peng XJ. Fluorene-derived Two-photon Fluorescent Probes for Specific and Simultaneous Bioimaging of Endoplasmic Reticulum and Lysosomes: Group-effect and Localization. J. Mater. Chem. B. 2013;1:5450–5455. doi: 10.1039/c3tb20646g. [DOI] [PubMed] [Google Scholar]
- (5.).zhang XF, Wang C, Han Z, Xiao Y. A Photostable Near-Infrared Fluorescent Tracker with pH-Independent Specificity to Lysosomes for Long Time and Multicolor Imaging. ACS Appl. Mater. Interfaces. 2014;6:21669–21676. doi: 10.1021/am506750m. [DOI] [PubMed] [Google Scholar]
- (6.).Wang L, Xiao Y, Tian WM, Deng LZ. Activatable Rotor for Quantifying Lysosomal Viscosity in Living Cells. J. Am. Chem. Soc. 2013;135:2903–2906. doi: 10.1021/ja311688g. [DOI] [PubMed] [Google Scholar]
- (7.).Vegesna GK, Janjanam J, Bi JH, Luo FT, Zhang JT, Olds C, Tiwari A, Liu HY. pH-Activatable Near-infrared Fluorescent Probes for Detection of Lysosomal pH Inside Living Cells. J. Mater. Chem. B. 2014;2:4500–4508. doi: 10.1039/c4tb00475b. [DOI] [PubMed] [Google Scholar]
- (8.).Zhang JT, Yang M, Li C, Dorh N, Xie F, Luo FT, Tiwari A, Liu HY. Near-infrared Fluorescent Probes Based on Piperazine-functionalized BODIPY Dyes for Sensitive Detection of Lysosomal pH. J. Mater. Chem. B. 2015;3:2173–2184. doi: 10.1039/c4tb01878h. [DOI] [PubMed] [Google Scholar]
- (9.).Galindo F, Burguete MI, Vigara L, Luis SV, Kabir N, Gavrilovic J, Russell DA. Synthetic Macrocyclic Peptidomimetics as Tunable pH Probes for The Fluorescence Imaging of Acidic Organelles in Live Cells. Angew. Chem.-Int. Edit. 2005;44:6504–6508. doi: 10.1002/anie.200501920. [DOI] [PubMed] [Google Scholar]
- (10.).Chauhan DP, Varma SJ, Vijeta A, Banerjee P, Talukdar P. A 1,3-Amino Group Migration Route to form Acrylamidines. Chem. Commun. 2014;50:323–325. doi: 10.1039/c3cc47182a. [DOI] [PubMed] [Google Scholar]
- (11.).Becke AD. Density-functional Thermochemistry .3. The Role of Exact Exchange. J. Chem. Phys. 1993;98:5648–5652. [Google Scholar]
- (12.).Becke AD. A New Mixing of Hartree-fock and Local Density-functional Theories. J. Chem. Phys. 1993;98:1372–1377. [Google Scholar]
- (13.).Lee CT, Yang WT, Parr RG. Development of The Colle-salvetti Correlation-energy Formula into A Functional of The Electron-density. Phys. Rev. B: Condens. Matter Mater. Phys. 1988;37:785–789. doi: 10.1103/physrevb.37.785. [DOI] [PubMed] [Google Scholar]
- (14.).Hehre WJ, Radom L, Schelyer PVR, Pople JA. Ab Initio Molecular Orbital Theory. Wiley; New York: 1986. [Google Scholar]
- (15.).Frisch MJ, Trucks GW, Schlegel HB, Scuseria GE, Robb MA, Cheeseman JR, Scalmani G, Barone V, Mennucci B, Petersson GA, et al. Gaussian 09. Gaussian, Inc.; Wallingford CT: 2009. [Google Scholar]
- (16.).Bolte S, Cordelieres FP. A Guided Tour into Subcellular Colocalization Analysis in Light Microscopy. J. Microsc. (Oxford, U. K.) 2006;224:213–232. doi: 10.1111/j.1365-2818.2006.01706.x. [DOI] [PubMed] [Google Scholar]
- (17.).Zhu SL, Zhang JT, Vegesna GK, Pandey R, Luo FT, Green SA, Liu HY. One-pot Efficient Synthesis of Dimeric, Trimeric, and Tetrameric BODIPY Dyes for Panchromatic Absorption. Chem. Commun. 2011;47:3508–3510. doi: 10.1039/c0cc05303a. [DOI] [PubMed] [Google Scholar]
- (18.).Zhu SL, Zhang JT, Vegesna G, Tiwari A, Luo FT, Zeller M, Luck R, Li HH, Green S, Liu HY. Controlled Knoevenagel Reactions of Methyl Groups of 1,3,5,7-Tetramethyl BODIPY Dyes for Unique BODIPY Dyes. RSC Adv. 2012;2:404–407. [Google Scholar]
- (19.).Zhu SL, Bi JH, Vegesna G, Zhang JT, Luo FT, Valenzano L, Liu HY. Functionalization of BODIPY Dyes at 2,6-Positions through Formyl Groups. RSC Adv. 2013;3:4793–4800. [Google Scholar]
Associated Data
This section collects any data citations, data availability statements, or supplementary materials included in this article.


