

Significance
Understanding how social dynamics drive outcomes in environmental systems is critical to advancing global sustainability. We link comprehensive data on fishers’ information-sharing networks and observed fishing behaviors to demonstrate that social networks are tied to actions that can directly impact ecological health. Specifically, we find evidence that the propensity for individuals to share information primarily with others most similar to themselves creates segregated networks that impede the diffusion of sustainable behaviors—behaviors that could have mitigated the incidental catch of over 46,000 sharks in a single commercial fishery between 2008 and 2012. Our results suggest having a better understanding of social structures and bolstering effective communication across segregated networks has the potential to contribute toward more sustainable environmental outcomes.
Keywords: social networks, environmental outcomes, homophily, shark bycatch, sustainability
Abstract
Social networks can profoundly affect human behavior, which is the primary force driving environmental change. However, empirical evidence linking microlevel social interactions to large-scale environmental outcomes has remained scarce. Here, we leverage comprehensive data on information-sharing networks among large-scale commercial tuna fishers to examine how social networks relate to shark bycatch, a global environmental issue. We demonstrate that the tendency for fishers to primarily share information within their ethnic group creates segregated networks that are strongly correlated with shark bycatch. However, some fishers share information across ethnic lines, and examinations of their bycatch rates show that network contacts are more strongly related to fishing behaviors than ethnicity. Our findings indicate that social networks are tied to actions that can directly impact marine ecosystems, and that biases toward within-group ties may impede the diffusion of sustainable behaviors. Importantly, our analysis suggests that enhanced communication channels across segregated fisher groups could have prevented the incidental catch of over 46,000 sharks between 2008 and 2012 in a single commercial fishery.
As policy makers and natural resource managers struggle to devise effective strategies to sustain both natural and human capital in the face of growing human impacts, recent research has emphasized the importance of understanding relationships between social interactions and environmental outcomes (1–4). Social networks serve as primary channels for the flow of information and resources that facilitate human action (5, 6). Social interactions with our friends, family, and coworkers also directly affect our beliefs, decisions, and behaviors (7, 8). The degree to which information and behaviors spread through social networks is greatly affected by their structure (5, 9–11). One of the most basic factors governing social network structure is the principle of “homophily” (Fig. 1).
Fig. 1.

Homophily, social network structure, and causal mechanisms. A depiction of three network communities (A–C) where nodes represent people and colors represent individual traits. People in the same community are more likely to be similar (same color node) and to adopt the same ideas and behaviors. This is the principle of homophily. There are two potential causal mechanisms at play here: (i) Social selection: similar people are attracted to each other and tend to form social ties (e.g., blue nodes tend to form ties with blue nodes, red nodes tend to form ties with red nodes, etc.). This can lead to the formation of dense communities segregated by ethnicity, race, gender, or other traits, such as those depicted here. (ii) Social influence/contagion: people are often influenced by those in their social network through the diffusion of information and the pressure to conform. This is sometimes referred to as peer effects and it is thought to be stronger among people who are already similar in other ways. For example, someone in community C is more likely to be influenced by others in community C than by those in community A, even if they have exposure to community A. Inevitably, this can cause similar people to become even more similar over time. A critical challenge in most empirical work attempting to make casual network claims is thus disentangling social influence from social selection processes (38): Are people similar because they are socially connected (and therefore subject to social influence), or are similar people simply forming ties with each other in the first place (social selection)?
Homophily is a social selection process that describes the tendency for people to disproportionately form social ties with others most similar to themselves (12–14). It has been observed for various types of social relations, including friendships, marriage, and information sharing (12). Existing research on homophily shows that it can heavily influence the structure of social networks and their effects on people’s lives (15–23). One of the most pervasive effects of homophily is that it can cause social networks to become highly clustered (13, 21, 24). Intuitively, clustered social networks consist of multiple groups of people who are more densely connected internally and more sparsely connected externally (Fig. 1). At the extreme, strong homophily-driven clustering can result in segregated networks, where social ties tend to be restricted within groups of similar people and largely fail to extend to groups that are different along some trait or set of traits (21). Segregation in social networks is important because it can inhibit communication and learning across groups (5, 9, 17), causing knowledge and behaviors to become localized in social space (12).
The effects of homophily-driven social network segregation in information-sharing networks is particularly important in the context of environmental systems. Environmental systems are often characterized by diverse groups of actors competing over limited resources where individual decisions and behaviors can have substantial impacts on ecosystem health (25). Because environmental systems are inherently dynamic and complex, information that can support decision making in this context can be a highly valuable resource and is not shared indiscriminately (26). Indeed, in line with the literature on homophily, existing research suggests that actors in these settings often choose to primarily share information with others most similar to themselves, creating somewhat distinct social groups (24, 27). Due to heightened competition for limited resources, any behavioral differences across groups that potentially emerge from this preference for within-group ties can be further exacerbated (28, 29). Thus, in environmental systems characterized by diverse groups of actors and high levels of competition, homophily-driven social network segregation is likely to hinder the diffusion of information and associated behaviors across dissimilar groups (12). This is of particular concern when the information or behavior leads to more (or less) sustainable environmental outcomes.
To understand the link between social networks, homophily, and environmental outcomes, we interviewed nearly every fisher in Hawaii’s tuna longline fishery about who they regularly exchange valuable information with about fishing (Supporting Information). These data allowed us to create a network of information exchange within the fishery, which we refer to as the “information-sharing network.” We also leveraged data on shark bycatch rates as an example of an environmental outcome. Using this information, we tested the hypothesis that homophily-driven social network segregation can result in divergent behaviors that have important implications for ecosystem health. Although shark bycatch rates exhibit a high level of variability related to spatiotemporal factors such as prey abundance and sea surface temperature, they can also be influenced by fishing behaviors (30). Thus, our hypothesis rests on the assumption that fishing behaviors are in some part influenced by information access and the larger structure of fishers’ information-sharing networks. Specifically, because catching sharks can be both dangerous and costly for longline tuna fishers in Hawaii (31), we assume there is an incentive to avoid shark bycatch, and that a fisher’s information-sharing network provides a means by which they can obtain information to aid them in selecting and implementing bycatch avoidance behaviors. These behaviors may include changing bait, sharing information about how to accurately identify high shark areas, observing lunar and seasonal patterns, or cooperating to actively avoid bycatch hotspots while at sea. In line with the literature on homophily and social network segregation (5, 12, 32), we expect that actual adoption of particular strategies are more likely to occur within more densely connected communities driven by preferences for within-group ties (homophily) and may not cross over to other groups (17, 33), resulting in divergent fishing behaviors that can directly impact shark bycatch and indirectly impact ecosystem health.
We observe strong homophily based on ethnicity within the information-sharing network, i.e., the network is highly segregated along ethnic lines, creating distinct information-sharing network groups that largely correspond to ethnicity (Fig. 2). As we show in the following section, ethnic groups also demonstrate divergent behavior in terms of our environmental outcome: rates of shark bycatch differ across groups. This is suggestive evidence that segregated information-sharing network groups driven by ethnic homophily are influencing bycatch avoidance behavior, and that these behaviors are not diffusing from one group to another. This finding is very much in line with the literature on the effects of homophily and social network segregation (5, 12, 17, 32). However, as highlighted in Fig. 1, a challenge exists in conclusively attributing differences in shark bycatch to the influence of information-sharing networks. First, in addition to choosing information-sharing partners from the same ethnic background (social selection), fishers could be choosing information-sharing partners with similar bycatch avoidance behaviors (an additional form of social selection). Although this is unlikely given that bycatch is a by-product of a competitive economic pursuit (tuna fishing), we nonetheless discuss this possibility in the following section. Second, and more critically, it is possible that culturally embedded norms correlated with ethnicity may instead be influencing fishing behaviors, but the near-perfect association between ethnicity and information-sharing groups makes it difficult to disentangle these two potentially competing explanations. Interestingly, a number of “outliers” exist in the network. These actors do not form networks according to ethnic homophily: they mostly share information with ethnic groups that are different to their own. In the next section, we present empirical evidence that these actors behave in accordance with their network contacts (that is, the average behavior of the information-sharing group they have a majority of ties to). Thus, our results indicate that network contacts are more strongly related to behavior than ethnicity, suggesting that social networks are indeed tied to environmental outcomes.
Fig. 2.

Shark bycatch by information-sharing network group. Information-sharing networks in Hawaii’s longline fishery generated in NetDraw (41) using the spring embedding algorithm. Each node corresponds to an individual fisher color coded by ethnicity, or an actor deemed important for information sharing by respondents (i.e., industry leader, government, or management official). Information-sharing groups are delimited by shaded backgrounds, the color of which corresponds to their dominant ethnicity. Two isolates not connected to anyone are located in the top left corner. Circled nodes denote outliers. Those with solid lines represent fishers who have a majority of ties outside their ethnic group, with the color of the circle corresponding to the group they have a majority of ties to. Those with gray dashed lines denote nodes with an equal proportion of ties both within and outside their ethnic group. Excluding these outliers, mean (μ) shark bycatch and SDs (σ) per 1,000 hooks in Hawaii's tuna longline fishery from 2008 to 2012 are reported by community. Although informative, these statistics do not account for the conditions under which fishers are operating, such as when and where they fish, which can substantially influence rates of bycatch.
Our environmental outcome of interest—fisheries bycatch—is a significant global issue. From an ecological perspective, high rates of bycatch can cause population declines, remove top predators, and alter the foraging behavior of proximate species (34). From an economic perspective, bycatch is often discarded, which is extremely wasteful (31). When a bycatch species is a target species for a different fishery, this can cause conflict between different fishing fleets. Moreover, concern over bycatch is often the cause of increased regulation in fisheries, which can have adverse economic impacts on fishers and fishing communities (31). From a conservation perspective, many shark species have been classified as endangered, and bycatch represents a primary threat to shark populations worldwide (34). Importantly, our results suggest that complete diffusion of shark avoidance strategies across segregated information-sharing networks could have prevented the incidental catch of over 46,000 sharks between 2008 and 2012, providing support to our hypothesis that social network segregation can have important implications for ecosystem health.
Results and Discussion
Hawaii’s longline fishery is a limited-entry, multimillion-dollar industry supplying domestic and international markets with fresh tuna and swordfish, and is the largest commercial fishing sector in the Hawaiian Islands. From 2008 to 2012, there were 122–129 active vessels that completed between 1,205 and 1,381 annual fishing trips generating revenues of $65 to $94 million USD per year (Fig. S1). The fishery is composed of three distinct ethnic groups: Vietnamese Americans (V-A), European Americans (E-A), and Korean Americans (K-A), all of which target tuna (primarily bigeye tuna, Thunnus obesus) for at least a portion of the year (24).
Fig. S1.

Total numbers of active vessels and trips per year.
We surveyed nearly all fishers in Hawaii’s longline fishery about who they commonly exchanged important information with about fishing. This information-sharing network exhibits strong homophily (Supporting Information), with the majority of fishers organizing themselves into three distinct “network groups” corresponding to ethnicity (Fig. 2). Of the 159 fishers present in the network, only 6 have a majority of ties outside their ethnic group, whereas 1 has an equal proportion of intraethnic and interethnic group ties. We refer to these individuals as outliers. Excluding these outliers, we tested whether there was any observable difference in shark bycatch across these network groups using a sample of 12,062 observed tuna fishing sets from 2008 to 2012. The data on fishing sets, summarized in Table S1, were collected by federal fisheries observers onboard each vessel (Supporting Information).
Table S1.
Descriptive statistics, tuna fishing trips
| Variable | Mean | SD |
| Days/trip | 22.578 | 5.174 |
| Sets/trip | 13.912 | 3.554 |
| Bigeye tuna/set | 9.106 | 9.388 |
| Shark/set | 4.603 | 5.331 |
| Bigeye tuna per 1,000 hooks | 3.925 | 4.116 |
| Shark per 1,000 hooks | 1.996 | 2.322 |
An examination of the simple average number of sharks caught per 1,000 hooks across the 5-y period suggests a negligible difference between the K-A and E-A network groups, and a larger difference between the V-A and both other network groups (Fig. 2 and Table S2). However, the conditions under which fishers operate, i.e., when, where, and how they fish, is known to have a significant impact on shark bycatch rates (30, 35). When accounting for these factors (e.g., fishing location, vessel size, seasonality; see Table S3) in a negative binomial regression model, we find no evidence to suggest a difference between the K-A and V-A network groups (Table 1 and Table S4). However, our results show a statistically significant difference in shark bycatch between the E-A network group compared with both the V-A and K-A network groups (Table 1 and Table S4). In other words, segregation along ethnic lines in fishers’ information-sharing networks appears to be correlated with differences in shark bycatch for some network groups.
Table S2.
Descriptive statistics, shark bycatch
| Variable | Total fishers | Fishers observed* | Observed trips | Observed sets (N) | Shark per set | Shark/1,000 hooks | No. hooks/set | |||
| Mean | SD | Mean | SD | Mean | SD | |||||
| All fishers | 145 | 120 | 867 | 12,062 | 4.603 | 5.331 | 1.996 | 2.322 | 2,327.052 | 409.217 |
| E-A fishers | 52 | 46 | 371 | 4,793 | 4.386 | 4.982 | 1.776 | 2.053 | 2,492.924 | 481.605 |
| K-A fishers | 24 | 23 | 199 | 2,645 | 3.847 | 4.853 | 1.794 | 2.209 | 2,130.047 | 288.505 |
| V-A fishers† | 70 | 51 | 297 | 4,624 | 5.260 | 5.843 | 2.339 | 2.592 | 2,267.808 | 307.597 |
| Network groups, not including outliers | ||||||||||
| E-A network | 51 | 45 | 362 | 4,694 | 4.365 | 4.968 | 1.765 | 2.047 | 2,495.662 | 485.292 |
| K-A network | 20 | 20 | 172 | 2,281 | 3.84 | 5.034 | 1.759 | 2.267 | 2,158.983 | 286.927 |
| V-A network† | 69 | 51 | 297 | 4,624 | 5.261 | 5.843 | 2.339 | 2.592 | 2,267.808 | 307.597 |
| Outliers | ||||||||||
| A (E-A, majority K-A) | 1 | 1 | 9 | 99 | — | — | — | — | — | — |
| B (K-A, majority E-A) | 1 | 1 | 7 | 88 | — | — | — | — | — | — |
| C (K-A, split) | 1 | 1 | 9 | 123 | — | — | — | — | — | — |
| D (K-A, majority V-A) | 1 | 1 | 11 | 153 | — | — | — | — | — | — |
| E (K-A, majority E-A) | 1 | 0 | 0 | 0 | — | — | — | — | — | — |
| F (V-A, majority E-A) | 1 | 0 | 0 | 0 | — | — | — | — | — | — |
| G (E-A, majority V-A) | 1 | 0 | 0 | 0 | — | — | — | — | — | — |
| Final network groups‡ | ||||||||||
| E-A network | 52 | 45 | 362 | 4,694 | 4.365 | 4.968 | 1.764 | 2.042 | 2,490.852 | 482.504 |
| K-A network | 23 | 20 | 172 | 2,281 | 3.84 | 5.034 | 1.792 | 2.251 | 2,149.052 | 295.116 |
| V-A network | 70 | 51 | 297 | 4,624 | 5.261 | 5.843 | 2.335 | 2.569 | 2,256.347 | 309.418 |
The bold dashes (—) represent values that are protected by federal law due to confidentiality agreements, which protect all data pertaining to less than three aggregated individuals.
Defined as fishers who captained a tuna targeting trip with a NOAA fisheries observer onboard between 2008 and 2012; ∼20% of all tuna trips are observed.
Some fishers in this group also participate in swordfish fishing; swordfish trips are not included in this analysis.
In the final network groups, A was included in the K-A network, B was included in the E-A network, and C and D remained in the K-A network (Table 2).
Table S3.
Descriptive statistics, model covariates
| Variable (variable name) | Description | Mean | SD |
| Bigeye tuna/set (tuna) | No. of target species (bigeye tuna) caught per set | 9.106 | 9.388 |
| Vessel length (len) | Length of vessel, in feet | 71.224 | 9.949 |
| No. hooks/set (hks) | No. of hooks per fishing set | 2,327.052 | 409.217 |
| Latitude, °N (lat) | Latitude at the beginning of each set | 22.196 | 5.929 |
| Lattitude2 (lat2) | Latitude squared | 527.813 | 252.335 |
| Longitude, °W (lon) | Longitude at the beginning of each set | −157.462 | 7.251 |
| Longitude2 (lon2) | Longitude squared | 24,846.740 | 2,264.203 |
| Soak time (soaktime) | Time the baited hooks are left to soak in the water column for each set, in hours | 4.697 | 1.416 |
| Temperature, °F (temp) | Average temperature (°F) between the beginning and end of each set | 77.032 | 2.952 |
| Temperature2 (temp2) | Average temperature squared | 5,942.712 | 450.535 |
| Bait (bait) | Bait dummy variables | ||
| Mixed (base) | 1 if Sanma and sardines, 0 otherwise | 0.107 | 0.309 |
| Sanma | 1 if Sanma, 0 otherwise | 0.851 | 0.356 |
| Sardine | 1 if Sardines, 0 otherwise | 0.042 | 0.201 |
| Seasonality (season) | Represents seasonal variation; described in detail in Data Preparation, Fisheries Observer Data | 0.037 | 0.743 |
| Lunar (lunar) | Represents lunar variation; described in detail in Data Preparation, Fisheries Observer Data | −0.003 | 0.709 |
| Year (year) | Annual dummy variables to represent annual variation | ||
| 2008 | 1 if 2008, 0 otherwise | 0.186 | 0.389 |
| 2009 | 1 if 2009, 0 otherwise | 0.186 | 0.389 |
| 2010 | 1 if 2010, 0 otherwise | 0.193 | 0.395 |
| 2011 | 1 if 2011, 0 otherwise | 0.220 | 0.414 |
| 2012 | 1 if 2012, 0 otherwise | 0.215 | 0.411 |
Table 1.
The relationship between social network segregation and shark bycatch
| Regression | ||
| Network group | 1 | 2 |
| E-A network | −0.217 (0.049)* | (Base) |
| K-A network | −0.031 (0.052) | 0.187 (0.053)* |
| V-A network | (Base) | 0.217 (0.049)* |
Values shown are coefficients (and SEs) from two negative binomial regressions. The dependent variable is shark per fishing set in Hawaii's tuna longline fishery from 2008 to 2012 (n = 12,062). Controls accounting for the conditions under which fishers are operating include target species catch, vessel length, number of hooks, set location, soak time, temperature, type of bait, seasonality, lunar variability, and annual variability (see Table S3 for variable descriptions and Table S4 for full model results). SEs are clustered to account for multiple observations of 120 individual fishers.
Significance at P < 0.05.
Table S4.
The relationship between social network segregation and shark bycatch, full model results
| Predictor variable | Coefficient (β) | Robust SE | P > |z| | 95% Confidence interval | |
| K-A network | 0.187 | 0.053 | 0.000 | 0.083 | 0.291 |
| V-A network | 0.217 | 0.049 | 0.000 | 0.121 | 0.313 |
| Bigeye tuna/set | 0.000 | 0.001 | 0.807 | −0.002 | 0.003 |
| Vessel length | 0.005 | 0.002 | 0.012 | 0.001 | 0.009 |
| No. hooks/set | 0.000 | 0.000 | 0.000 | 0.000 | 0.001 |
| Latitude, °N | 0.026 | 0.028 | 0.351 | −0.029 | 0.080 |
| Latitude2 | −0.001 | 0.001 | 0.033 | −0.003 | 0.000 |
| Longitude, °W | −0.231 | 0.097 | 0.017 | −0.421 | −0.042 |
| Longitude2 | −0.001 | 0.000 | 0.050 | −0.001 | 0.000 |
| Soak time | 0.054 | 0.010 | 0.000 | 0.034 | 0.074 |
| Temperature, °F | −0.740 | 0.239 | 0.002 | −1.209 | −0.271 |
| Temperature2 | 0.005 | 0.002 | 0.001 | 0.002 | 0.008 |
| Bait | |||||
| Sanma | 0.100 | 0.055 | 0.069 | −0.008 | 0.207 |
| Sardine | −0.080 | 0.124 | 0.518 | −0.322 | 0.162 |
| Seasonality | 0.144 | 0.026 | 0.000 | 0.093 | 0.194 |
| Lunar | 0.073 | 0.019 | 0.000 | 0.036 | 0.110 |
| Year | |||||
| 2009 | 0.046 | 0.069 | 0.505 | −0.089 | 0.180 |
| 2010 | 0.203 | 0.056 | 0.000 | 0.094 | 0.312 |
| 2011 | 0.181 | 0.055 | 0.001 | 0.073 | 0.289 |
| 2012 | 0.093 | 0.056 | 0.099 | −0.017 | 0.203 |
| Constant | 3.826 | 12.613 | 0.762 | −20.895 | 28.547 |
| Wald χ2(20) | 1,212.230 | ||||
| p > χ2 | 0.000 | ||||
| Measures of fit | |||||
| Log-likelihood intercept only | −31,553.729 | Log-likelihood full model: | −28,851.362 | ||
| D(12,038) | 57,702.725 | LR(20) | 5,404.733 | ||
| Prob > LR | 0.000 | ||||
| McFadden's R2 | 0.086 | McFadden's Adj R2 | 0.085 | ||
| Maximum likelihood R2 | 0.361 | Cragg and Uhler's R2 | 0.363 | ||
| AIC | 4.788 | AIC*n | 57,750.725 | ||
| BIC | −55,428.176 | BIC′ | −5,216.777 | ||
Negative binomial regression outcome of shark bycatch in Hawaii's longline fishery. The dependent variable is shark (any species) per fishing set in Hawaii's tuna longline fishery, from 2008 to 2012 (n = 12,062). Network variables are in bold and account for observed homophilous groupings along ethnic lines. The E-A network is set as the base. SEs are clustered to account for multiple observations of 120 individual fishers.
Although our initial model result suggests homophily-driven social network segregation may influence environmental outcomes, clearly distinguishing this as a network effect rather than a preexisting cultural effect is somewhat problematic. Culture-related behavior can obviously diffuse through networks, but our concern here is culture-related differences that exist regardless of network links. Because the primary factor driving homophily in this fishery is ethnicity (24) (Supporting Information), this may be correlated with preexisting cultural differences that influence fishing behaviors independent of network interactions, e.g., cultural norms. However, the almost perfect association of homophilous information-sharing network groups with ethnicity rules out including ethnicity as a potential control in our original model. However, if ethnicity-dependent cultural norms are in fact driving the differences in fishing behaviors we have observed here, we would expect those whose majority of ties fall outside their ethnic group (outliers) to be acting more like their ethnic group, rather than their network group, where their network group is defined as the group they have a majority of ties to.
To test for this effect, we examined whether observed outliers’ rates of shark bycatch were significantly different from their ethnic or network group while accounting for the conditions under which they operate (i.e., when, where, and how they fish). Of the seven outliers, the observer data included observations for four (A–D, Fig. 2; Table S2). Although three of these outliers had a majority of ties outside their ethnic group (A, B, and D; Fig. 2), two (A and B) are of particular interest because they spanned network groups found to have significantly different rates of shark bycatch. Results from negative binomial regressions show that these two outliers had significantly different rates of shark bycatch than their ethnic group, but not significantly different from their network group, defined as the group they have a majority of ties to (Table 2 and Table S5). In short, they appear to be acting much more like their network group, rather than their ethnic group.
Table 2.
Are outliers acting more like their ethnic group, or their network group?
| Regression | Coefficient (SE) |
| A. Regression with outlier A as the base, who is E-A with a majority of ties to the K-A network | |
| E-A network | −0.171 (0.030)* |
| K-A network | 0.017 (0.055) |
| V-A network | −0.047 (0.044) |
| B. Regression with outlier B as the base, who is K-A with a majority of ties to the E-A network | |
| E-A network | −0.018 (0.066) |
| K-A network | 0.169 (0.060)* |
| V-A network | 0.200 (0.066)* |
| C. Regression with outlier C as the base, who is K-A and has ties split between the K-A network, the V-A network, and other nonfishers | |
| E-A network | −0.144 (0.067)* |
| K-A network | 0.045 (0.057) |
| V-A network | 0.073 (0.042) |
| D. Regression with outlier D as the base, who is K-A and has a majority of ties to the V-A network | |
| E-A network | −0.244 (0.051)* |
| K-A network | −0.057 (0.044) |
| V-A network | −0.028 (0.040) |
Values shown are coefficients (and SEs) from four negative binomial regressions (A–D). The dependent variable is shark per fishing set in Hawaii’s tuna longline fishery from 2008 to 2012 (n = 12,062). Network variables account for observed homophilous groupings along ethnic lines; outliers designate circled nodes in Fig. 2, which are independently tested to determine whether their rates of shark bycatch are significantly different from their ethnic or network group. Controls include target species catch, vessel length, number of hooks, set location, soak time, temperature, type of bait, seasonality, lunar variability, and annual variability (see Table S3 for variable descriptions and Table S5 for full model results). SEs are clustered to account for multiple observations of 120 individual fishers. In each model (A–D), the network groups in question are bold.
Significance at <0.05.
Table S5.
Are outliers acting more like their ethnic group, or their network group? Full model results
| Predictor variable | Coefficient (β) | Robust SE | P > |z| | 95% Confidence interval | |
| A. Outlier A, E-A with majority K-A ties (base) | |||||
| E-A network | −0.171 | 0.030 | 0.000 | −0.230 | −0.112 |
| K-A network | 0.017 | 0.055 | 0.759 | −0.091 | 0.125 |
| V-A network | 0.047 | 0.044 | 0.292 | −0.040 | 0.133 |
| Bigeye tuna/set | 0.000 | 0.001 | 0.806 | −0.002 | 0.003 |
| Vessel length | 0.005 | 0.002 | 0.012 | 0.001 | 0.009 |
| No. hooks/set | 0.000 | 0.000 | 0.000 | 0.000 | 0.001 |
| Latitude, °N | 0.026 | 0.028 | 0.350 | −0.029 | 0.081 |
| Latitude2 | −0.001 | 0.001 | 0.033 | −0.003 | 0.000 |
| Longitude, °W | −0.231 | 0.097 | 0.017 | −0.421 | −0.042 |
| Longitude2 | −0.001 | 0.000 | 0.050 | −0.001 | 0.000 |
| Soak time | 0.054 | 0.011 | 0.000 | 0.033 | 0.075 |
| Temperature, °F | −0.740 | 0.239 | 0.002 | −1.209 | −0.271 |
| Temperature2 | 0.005 | 0.002 | 0.001 | 0.002 | 0.008 |
| Bait | |||||
| Sanma | 0.100 | 0.055 | 0.069 | −0.008 | 0.207 |
| Sardine | −0.080 | 0.124 | 0.517 | −0.323 | 0.162 |
| Seasonality | 0.144 | 0.026 | 0.000 | 0.093 | 0.194 |
| Lunar | 0.073 | 0.019 | 0.000 | 0.036 | 0.110 |
| Year | |||||
| 2009 | 0.046 | 0.069 | 0.506 | −0.089 | 0.180 |
| 2010 | 0.203 | 0.056 | 0.000 | 0.094 | 0.312 |
| 2011 | 0.181 | 0.055 | 0.001 | 0.074 | 0.289 |
| 2012 | 0.093 | 0.056 | 0.098 | −0.017 | 0.203 |
| Constant | 3.998 | 12.609 | 0.751 | −20.715 | 28.711 |
| Wald χ2(21) | 1,852.800 | ||||
| p > χ2 | 0.000 | ||||
| Measures of fit | |||||
| Log-likelihood intercept only | −31,553.729 | Log-likelihood full model: | −28,851.341 | ||
| D(12,038) | 57,702.683 | LR(20) | 5,404.775 | ||
| Prob > LR | 0.000 | ||||
| McFadden's R2 | 0.086 | McFadden's Adj R2 | 0.085 | ||
| Maximum-likelihood R2 | 0.361 | Cragg and Uhler's R2 | 0.363 | ||
| AIC | 4.788 | AIC*n | 57,750.683 | ||
| BIC | −55,428.218 | BIC′ | −5,216.819 | ||
Negative binomial regression outcome testing whether outliers have significantly different rates of bycatch than their ethnic or network group. The dependent variable is shark (any species) per fishing set in Hawaii’s tuna longline fishery from 2008 to 2012 (n = 12,062). Network variables account for observed homophilous groupings along ethnic lines; outliers designate circled nodes in Fig. 2, which were tested against network group means. SEs are clustered to account for multiple observations of 120 individual fishers. The full model with outlier A as the base is shown. The network groups in question for outlier A are in bold. See Table 2 for coefficients and SEs of remaining outliers.
The two remaining outliers present in the observer data (C and D) spanned network groups with similar bycatch rates (the K-A and V-A network groups, Table 1). When accounting for the conditions under which they operate, their individual rates of shark bycatch are also in line with our hypothesis. Outlier D’s rate was not significantly different from their ethnic or network group (K-A and V-A, respectively), yet was significantly different from the group they had no information-sharing ties to (the E-A network group; Table 2). The remaining outlier (C) had an equal proportion of intraethnic and interethnic relations, and their rate of shark bycatch was also not significantly different from their ethnic group (K-A) or the additional network group they had information-sharing ties to (V-A). Similar to D, it was, however, significantly different from the group they had no information-sharing ties to (the E-A network; Table 2). Although our analysis of outliers is inherently limited by the small number of them present in the network, these results lend empirical support for a network effect, rather than a cultural effect, being present in our original model, which included all fishers (Table 1). In other words, our results suggest that social affiliations are indeed tied to fishing behaviors that can have a direct impact on ecosystems.
We have presented evidence that social networks are related to environmental outcomes and that homophily-driven network segregation may impede the diffusion of sustainable behaviors. The magnitude of this impact is worthy of both scholarly and policy attention. A coarse analysis suggests that, if ties were less confined to ethnic groups and all fishers were able to access (and chose to act on) information that could aid them in achieving the same shark bycatch rate as the most efficient network group with the lowest rate (the E-A network group), interactions with ∼4,154 sharks directly observed in our sample might have been avoided. Applying this same rate to all hooks reported in federal logbooks on tuna-fishing trips, we estimate that, between 2008 and 2012, interactions with ∼46,339 sharks might have been avoided, representing an estimated 12% annual reduction in overall shark bycatch in Hawaii’s longline tuna fishery alone.
As is the case with many scientific inquires, our results seem to uncover more questions than answers. Namely, what exactly is the more efficient group of fishers doing differently that has enabled them to mitigate shark bycatch more effectively than others? Information gathered post hoc from key informants suggest they may be cooperating at sea by sharing information about fishing locations to avoid shark bycatch hotspots. It was also suggested that they may have adopted updated technologies that facilitate more efficient fishing practices. Although available data allowed us to control for fishing location, we were unable to capture the dynamic behavior of fishers in time and space that would help quantify explicit cooperation at sea. Similarly, the fisheries observer data did not include detailed information on all of the updated technology each vessel was equipped with. Obtaining a clear answer to this question is, however, critical for informing effective policy and should be the focus of future research.
Common to other empirical inquires on network effects (36) and highlighted in Fig. 1, our approach suffers from some limitations. Namely, due to the cross-sectional nature of our network data, the casual direction between social affiliations and environmental behaviors is difficult to statistically establish. It is clear in this case that ethnicity is a strong determinant of tie formation (social selection), and it is not possible for this trait to diffuse through networks the way information and behaviors can. However, the question of whether fishers also potentially organize themselves into information-sharing groups based on bycatch behaviors (an additional form of social selection), or whether bycatch behaviors are influenced by information-sharing groups (social influence) remains. Given the number of controls included in our model, the fact that bycatch is a by-product of the pursuit of an economic activity (tuna fishing), and the well-documented value of information in fisheries for supporting decision making and behavior (37), we believe the former is unlikely. However, firmly establishing the causal mechanisms underlying the observed correspondence between homophily-driven network segregation and behaviors affecting shark bycatch will require dynamic network data collected at multiple points in time (38), which does not currently exist. Such data could also enable future research to determine how individual fishers are influenced by the behavior of their direct contacts irrespective of network clustering or segregation effects, adding further insight into the relationship between social networks and environmental outcomes.
Despite the limitations of our data and empirical approach, our results offer evidence that patterns of social structure driven by homophily correlate with behaviors that can directly impact ecological sustainability. In other words, social networks appear to be tied to fishing behaviors that can scale up to have a direct impact on ecosystems. In this case, the conclusion is that one information-sharing network group of fishers exhibits more sustainable fishing behaviors that better mitigate shark bycatch, yet homophily-driven social network segregation appears to prevent these behaviors from being diffused and adopted by all fishers. Our results thus suggest having a better understanding of social interactions and bolstering effective communication across segregated networks has the potential to contribute toward more sustainable environmental outcomes.
Methods
Further details are provided in Supporting Information.
All fisheries catch and effort data were collected by the National Oceanic and Atmospheric Administration’s (NOAA) Pacific Islands Regional Office Observer Program. Twenty percent of all Hawaii-based longline tuna trips are federally mandated to carry an onboard fisheries observer that collects detailed data on catch and effort for every fishing set. The observer data from 2008 to 2012 includes 18,059 fishing sets, of which 5,997 were missing key variables, resulting in a usable sample of 12,062 fishing sets from 867 observed trips made by 120 unique individual fishers. In the sample, a typical tuna trip lasted anywhere from 2.5–4 wk and was composed of ∼14 ± 4 fishing sets containing 2,327 ± 409 hooks each (Table S1). Across all sets in the sample, the mean rate of shark bycatch was 4.603 per fishing set (Table S1; Fig. S2).
Fig. S2.

Declared tuna trips catch per unit effort: total numbers of bigeye tuna and shark caught per 1,000 hooks, 2008–2012.
The information-sharing network data are cross-sectional and were collected from primary decision makers in Hawaii’s longline fleet from May 2011 to January 2012 (24). Primary decision makers are defined as vessel owners and captains, which we refer to collectively as “fishers.” Fishers were specifically asked to identify up to 10 individuals with whom they regularly exchanged important information with about fishing. Fishers were also asked to report how often they shared useful information with each contact, how valuable they felt the information was to their fishing success, and the degree to which their fishery-related information-sharing contacts may have changed over the past 5 y. A high response rate was achieved, including 90% of all fishers tied to 93% of all active vessels during the time of data collection (Supporting Information). Research protocols were approved by the Institutional Review Board of the Office of Research Compliance Human Studies Program at the University of Hawaii at Manoa, and informed consent was obtained from all respondents.
Fishing can be characterized as a competitive economic pursuit—particularly in this fishery, which, unlike many other US commercial fisheries, has not been rationalized by the implementation of a rights-based management scheme (Supporting Information). In this context, information that may help fishers to better mitigate bycatch, such as information on bycatch levels in specific fishing locations, is not likely to be shared indiscriminately because it has the ability to increase the fishing efficiency of others (26, 39). To more accurately capture the specific information-sharing ties more likely to influence fishing behaviors that can affect shark bycatch, we did not use information-sharing ties identified by respondents as “not valuable” or that were used less frequently than one to three times per month. The resulting network included 179 nodes (159 of which are fishers), 857 ties, 138 reciprocal ties, a mean geodesic distance of 4.42, an average degree of 8.246 network neighbors, and three components: one weakly connected containing all but two nodes, and two isolates (Fig. 2). Degree distributions for the full network including all ties and the network we have described above are presented in Fig. S3.
Fig. S3.

Degree distributions of (A) the full network including all fishery-related information-sharing ties identified by respondents, and (B) the network used in this analysis, which is a subset of A that does not include ties identified by respondents as “not valuable” or that are used less than one to three times per month for information sharing.
To test our hypothesis, we used a negative binomial regression model due to the count nature of shark interactions (Fig. S4) and the prevalence of overdispersion. We accounted for the conditions under which fishers operate, i.e., spatiotemporal and operational factors known to affect shark bycatch, directly in the model. These variables included target species catch, vessel length, number of hooks, set location, soak time, temperature, type of bait, seasonality, lunar variability, and annual variability (see Supporting Information and Table S3 for explanations of each variable). We clustered SEs to account for multiple observations of the 120 unique individual fishers that were present in the fisheries observer data.
Fig. S4.
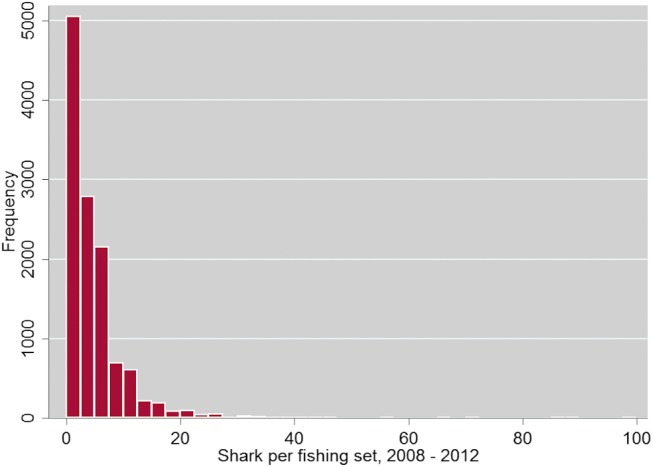
Distribution of shark per fishing set, 2008–2012.
To estimate the number of sharks in our sample that might have been avoided under conditions of more complete information sharing across all network groups, we calculated the difference in shark catch observed in our sample compared with the number of sharks that would have been caught if all fishers had the same mean shark bycatch rate as the most efficient network group (the E-A network, 1.776 sharks per 1,000 hooks; Table S2). Scaling this up to account for all Hawaii-based tuna longline fishing trips taken between 2008 and 2012 (which includes both observed and unobserved fishing sets), we applied this same rate to all hooks reported in federal logbooks during this period. However, because federal logbooks are known to contain systematic underestimates of shark bycatch (40), rather than comparing it to the total number of sharks recorded in logbooks over our study period, we compared it to an estimated total number of sharks caught in both observed and unobserved trips, using the mean shark bycatch rate for all fishers observed in our sample (1.996 sharks per 1,000 hooks; Table S2).
Study System
In Hawaii’s longline fishery, fishing sets consisting of a single mainline hanging thousands of individually hooked lines are stretched over vast portions of the water column. Fishers typically lay one set per day, letting the hooks soak an average of 5 h before haul out. Sets are intended to catch either swordfish or tuna, yet several other species are also incidentally caught. This incidental catch is referred to here as bycatch—a common term for the incidental take of nontarget or protected, endangered, or threatened species. Sometimes bycatch can be marketed, but in many cases it is deemed unusable or otherwise unwanted due to regulatory restrictions or a lack of marketability and is discarded at sea, either alive and injured, or dead.
In Hawaii’s longline fishery, where sharks comprise a substantial portion of total bycatch (35), we assume fishers have incentives to avoid catching sharks. Sharks hold little to no economic value due to a lack of market for shark meat in Hawaii (31). Although in some fisheries shark fins are retained due to their high export value, there are strict bans on shark finning in Hawaii. A federal and Hawaii state ban on shark finning has been in place since 2000, effectively prohibiting shark finning in most cases unless the carcass is retained (which takes up premium space that fishers could otherwise be using for high-value tuna). In 2010, an additional ban on the possession, distribution, and sale of shark fins was enacted throughout the state of Hawaii. Additionally, interactions with sharks can lead to the loss of target species due to shark predation, potential damage or loss of gear, risk of injury to the captain or crew, and an expenditure of time removing sharks from gear (31).
Data Preparation
Network Data.
The network data used in this analysis were originally collected by Barnes-Mauthe et al. (24) beginning in May 2011 and ending in January 2012. The data were collected via a structured survey that asked fishers to identify up to 10 individuals that they commonly exchanged information with about fishing that they considered valuable to their fishing success. The survey was targeted to capture the complete information-sharing network of all primary decision makers, defined as vessel owners and captains (and owners who also captain their vessel, “owner/operators”), of all active vessels in Hawaii’s longline fleet during the time of data collection.
The survey was employed using face-to-face interviews in the preferred language of each respondent. Respondents were prompted to consider relationships that they had with other vessel owners, captains, supply store owners and other industry leaders, fishery management officials, members of the scientific community, and individuals from other ethnic backgrounds. After each individual was identified, a series of follow-up questions were asked, e.g., nature and strength of relationship, frequency of communication, how valuable they felt the information was that they exchanged with each individual they identified, etc.
Although official records indicate there were 129 active vessels with permits during 2011, only 121 were observed at least once in Honolulu throughout the 9 mo spent in the field. Information obtained from informal discussions with respondents suggested that the difference in active vessels on record vs. vessels observed during data collection could be attributed to vessels being sold during the year (three total, according to informal reports), fishers going out of business (three vessels according to informal reports), and vessels fishing in other fisheries (two according to informal reports). According to official records, conversations with respondents, and those nominated in our resulting network, it was estimated that there were ∼159 primary decision makers who captained and/or owned the 121 observed vessels (accounting for all captains, owners, and owner–operators), which we refer to as “fishers.” In total, 145 fishers who captained and/or owned 112 vessels participated in the survey. Of the 159 total fishers, 59 were identified as European American (E-A), 26 as Korean American (K-A), and 74 as Vietnamese American (V-A), of which 51, 24, and 70 participated as respondents, respectively. Surveys from two individuals were dropped from the database due to inadequate information (1 E-A and 1 K-A fisher), resulting in a total sample of 143 fishers (90%) from 112 vessels (93%).
As described in the main text, in this analysis, we included information-sharing ties identified by the 143 respondents as at least somewhat valuable [rated on a scale of (a) very valuable, (b) somewhat valuable, and (c) not valuable] and that were used at least one to three times per month [rated on a scale of (a) 1–3 times/week or more, (b) 1–3 times/month, or (c) 1–3 times/year]. This was done to capture the information-sharing ties most likely to influence fishing behaviors (see main text). The resulting network contained 179 nodes, 159 of which were fishers (Fig. 2). Remaining nodes were identified as industry leaders and government or management officials.
Fisheries Observer Data.
Although at times some of Hawaii’s longline fishers target swordfish, in this analysis we focus on tuna trips only because tuna is targeted by all Hawaii’s longline fishers for at least a portion of the year. Detailed data on catch and effort on 20% of all Hawaii-based tuna longline trips is collected by the National Oceanic and Atmospheric Administration (NOAA)’s Pacific Islands Regional Office onboard observer program. We were granted access to this observer data from 2008 to 2012. The data we were granted access to included detailed information on 18,059 sets from a reported total of 85,989 (according to federal logbooks) laid by Hawaii-based tuna longline fishers during the 5-y period, equating to 21% of all sets.
When onboard, observers monitor interactions with protected species while recording an array of operational details for every fishing set. The data thus included a host of controls that are regularly used to model shark bycatch. In longline fisheries, shark bycatch is typically modeled as catch per unit effort (CPUE), defined as sharks caught per fishing set or per 1,000 hooks. We used sharks caught per set as our outcome variable. For reference, the most commonly caught species of shark in Hawaii’s tuna longline fishery is blue shark (Prionace glauca), followed by bigeye thresher (Alopias superciliosus), shortfin mako (Isurus oxyrinchus), oceanic whitetip (Carcharhinus longimanus), silky shark (C. falciformis), and crocodile shark (Pseudocarcharias kamoharai) (35). Other species are sometimes also caught, but at rates of less than 1% of total shark bycatch.
A handful of studies have found shark bycatch rates in longline fisheries to be influenced by (i) spatiotemporal variables, i.e., latitude, longitude, and seasonality; (ii) environmental variables, such as sea surface temperature and moon phase; and (iii) operational characteristics, such as vessel size, bait type, and fishing pressure (30, 35). The observer data included information on latitude, longitude, sea surface temperature, vessel size, and bait type for every set. Latitude, longitude, and temperature were recorded at both the beginning and end of each set. We used the location at the beginning and took the average temperature for each set. The observer data also included variables that we used as proxies for effort, i.e., soak time (time the baited hooks are left to soak in the water column) and number of target species caught (i.e., bigeye tuna). To create a seasonality variable, we maximized the correlation of sine functions of sharks caught per set by adjusting the day of the year (Julian date) divided by the number of days in a year. In addition to the seasonality variable, another cyclical variable was created to represent the lunar cycle using a sine function that equals 1 during a full moon and −1 during a new moon. See Table S3 for a full list of variables including descriptions.
We assigned unique identifiers to all individuals present in our network dataset. Using a two-stage approach and taking exceptional care to protect the confidentiality of fisher’s personal identifying information, we linked fishery observer data to our data on fisher’s social networks at the individual fisher level. All identifying information was immediately removed after the data were successfully merged and checked for accuracy. Of the 18,059 observed sets, 12,421 were linked to fishers represented in our network. A total of 150 of these observed sets were subsequently dropped due to missing information on temperature, set location, or shark catch. We also dropped all observations tied to fishers who claimed their network had completely changed over the last 5 y to account for the cross-sectional nature of our network data (209 sets total), resulting in a usable sample of 12,062 fishing sets over the 5-y period.
Data Description
Network Data.
Described previously, the network analyzed here includes all fishery-related information-sharing ties identified by respondents as at least “somewhat valuable” and that were used at least one to three times per month. The network includes 179 nodes, 857 ties, 138 reciprocal ties, a mean geodesic distance of 4.420, an average degree of 8.246 network neighbors, and three components: one weakly connected component containing all but two nodes, and two isolates. The network exhibits strong homophily along ethnic lines, with a statistically significant E-I homophily index of −0.764 (where −1 indicates extreme homophily and +1 indicates extreme heterophily; P < 0.05). A previous analysis explored the role of additional individual-level attributes (such as title, education, age, and experience) on homophily among information-sharing networks in this fishery using a density model of variable homophily, and found that ethnicity was the primary source of homophily (24). Fig. S1 shows the degree distribution of the network we used in this analysis compared with the degree distribution of the full network including all information-sharing ties identified by respondents.
Fisheries Observer Data.
Tables S1–S3 and Figs. S1, S2, and S4 contain information on fishery participation, tuna fishing trips, shark bycatch, and spatiotemporal and operational covariates. Fishery participation remained relatively stable from 2005 to 2012, averaging at 127 permitted vessels completing an average of 1,300 trips per year (Fig. S1). Trips lasted a mean of 23 d and were composed of an average of 14 sets and 2,327 hooks each (Tables S1 and S2). Shark bycatch across all fishers averaged at 4.603 per set and 1.996 per 1,000 hooks over the 5-y period, although rates varied to some degree between ethnic and network groups (Fig. S2 and Table S2). Bigeye tuna catch (the target species) averaged at 9.106 per set and 3.925 per 1,000 hooks (Table S1 and Fig. S2). Presented in Table S3, the average vessel length was 71.224 feet. The latitude and longitude where sets begun averaged at 22.196 and −157.462, respectively. Sets were soaked for a mean of 4.697 h in an average sea surface temperature of 77.032 °F. Sanma was the most commonly used bait type, although some fishers also used sardines and a mix of different types of bait.
Model Structure
Catch data for nontarget species such as sharks can be characterized as count data, and therefore call for models appropriate for nonnegative integer-valued random variables. Due to its flexibility in modeling count data, the Poisson regression model has been used to model rates of incidental catch of many nontarget species, including shark bycatch (42). The Poisson model assumes that the response variable has a Poisson distribution, which expresses the probability of an event occurring within a fixed interval of time and/or space, and assumes its expected value can be modeled by a linear combination of unknown parameters. In the Poisson regression model, the parameter , known as the rate of occurrences (which can also be characterized as the count or mean), for each case is given by the following:
| [S1] |
where is a function of a vector of predictor variables, and is also the expected value of any Poisson random variable of the ith entity at time , is a vector of the ith entity’s characteristics and other explanatory variables, and is a conformable matrix of unknown parameters to be estimated. The exponential functional form in Eq. S1 ensures a nonnegative solution for all and , and is thus particularly suited for modeling events such as shark bycatch, where nonoccurrences or zero-valued observations may occur. The Poisson probability specification is then as follows:
| [S2] |
where is the number of times an event occurs. The model assumes that the probability of an event occurs within a small interval of time, and that occurrences in different time intervals are independent events. The expected value is assumed to be proportional to some measure of scale, or exposure. In modeling incidental catch, the scale or exposure variable can be proportional to the number of fishing sets per trip, and different exposure times can be incorporated into the model as follows:
| [S3] |
where is the amount of time that observation may experience an occurrence of the event in question (such as the fishing set) and is the rate of occurrences (e.g., the expected number of observations during the set). The Poisson model can be estimated using maximum-likelihood techniques.
The Poisson regression model assumes that the variance of the data are equal to the conditional mean, yet overdispersion in count data are common. In the case of overdispersion, the negative binomial distribution can instead be used, which extends the Poisson model to allow the variance to diverge from the mean. In a negative binomial distribution, the mean is respecified as follows:
| [S4] |
where has a gamma distribution with a mean of 1 and a variance of , and is a random error that is assumed to be uncorrelated with . The negative binomial distribution is then as follows:
| [S5] |
where , and is the dispersion parameter such that . is an additional parameter to be estimated not included in the basic Poisson model. This model is estimated using the maximum-likelihood method.
Model Estimation
To test whether homophily-induced network segregation in the information-sharing network was related to shark bycatch, we ran a series of negative binomial regression models including the spatiotemporal and operational characteristics presented in Table S3 as covariates that account for the conditions under which fishers are operating. The distribution of shark bycatch displayed signs of overdispersion, with a variance over six times larger than the mean (σ2 = 28.420, µ = 4.603), suggesting a Poisson regression would be inappropriate. A goodness-of-fit test from a Poisson regression on shark bycatch per fishing set including the covariates presented in Table S3 confirmed that the Poisson model was inappropriate (χ2 = 34451.96, P = 0.000). We therefore fit a negative binomial regression model to shark bycatch per fishing set. The empirical model is defined in Eq. S6 as follows:
| [S6] |
All variables aside from the one labeled “network,” which refers to network groups, are defined in Table S3. To determine network groups, the global network was qualitatively separated into three groups based on ethnicity due to the strong presence of ethnic homophily (Fig. 2). In defining these groups, we first excluded outliers, defined as individuals whose majority of ties did not fall within their ethnic group. There were seven outliers total, four of which were present in the observer data (Table S2).
As described in the main text, we first tested whether there was any difference in mean shark bycatch among the three network groups. We then tested whether outliers behaved more similarly to their network or ethnic group, where their network group was defined as the group they had a majority of ties to. Full-model results are presented in Tables S4 and S5.
Acknowledgments
We thank M. Jackson, P. Pin, T. Valente, J. Cinner, O. Bodin, and J. Rummer for helpful comments. We also thank the NOAA Pacific Islands Regional Office Federal Fisheries Observer Program and NOAA Pacific Islands Fisheries Science Center for data access and logistical support, and all of the fishers who participated in this project. This work was supported by National Science Foundation (NSF) Coupled Natural–Human Systems Grant GEO-1211972. M.L.B. was also supported by NSF Social, Behavioral, and Economic Sciences Postdoctoral Fellowship Grant 1513354 and the University of Hawaii Graduate Student Organization.
Footnotes
The authors declare no conflict of interest.
This article is a PNAS Direct Submission.
This article contains supporting information online at www.pnas.org/lookup/suppl/doi:10.1073/pnas.1523245113/-/DCSupplemental.
References
- 1.Bodin Ö, Prell C, editors. Social Networks and Natural Resource Management: Uncovering the Social Fabric of Environmental Governance. Cambridge Univ Press; Cambridge, UK: 2011. p. 376. [Google Scholar]
- 2.Folke C. Resilience: The emergence of a perspective for social-ecological systems analyses. Glob Environ Change. 2006;16(3):253–267. [Google Scholar]
- 3.Hughes TP, Bellwood DR, Folke C, Steneck RS, Wilson J. New paradigms for supporting the resilience of marine ecosystems. Trends Ecol Evol. 2005;20(7):380–386. doi: 10.1016/j.tree.2005.03.022. [DOI] [PubMed] [Google Scholar]
- 4.Dowd A-M, et al. The role of networks in transforming Australian agriculture. Nat Clim Chang. 2014;4(7):558–563. [Google Scholar]
- 5.Rogers Everett M. Diffusion of Innovations. 4th Ed The Free Press; New York: 1995. [Google Scholar]
- 6.Burt RS. Structural Holes: The Social Structure of Competition. Harvard Univ Press; Cambridge, MA: 1992. pp. 57–91. [Google Scholar]
- 7.Christakis NA, Fowler JH. The spread of obesity in a large social network over 32 years. N Engl J Med. 2007;357(4):370–379. doi: 10.1056/NEJMsa066082. [DOI] [PubMed] [Google Scholar]
- 8.Christakis NA, Fowler JH. The collective dynamics of smoking in a large social network. N Engl J Med. 2008;358(21):2249–2258. doi: 10.1056/NEJMsa0706154. [DOI] [PMC free article] [PubMed] [Google Scholar]
- 9.Centola D. The spread of behavior in an online social network experiment. Science. 2010;329(5996):1194–1197. doi: 10.1126/science.1185231. [DOI] [PubMed] [Google Scholar]
- 10.Blau PM, Schwartz JE. Crosscutting Social Circles: Testing a Macrostructural Theory of Intergroup Relations. Academic; Orlando, FL: 1984. [Google Scholar]
- 11.Watts DJ. Small Worlds: The Dynamics of Networks Between Order and Randomness. Princeton Univ Press; Princeton: 1999. [Google Scholar]
- 12.McPherson M, Smith-Lovin L, Cook JM. Birds of a feather: Homophily in social networks. Annu Rev Sociol. 2001;2001(27):415–444. [Google Scholar]
- 13.Marsden PV. Core discussion networks of Americans. Am Sociol Rev. 1987;52(1):122–131. [Google Scholar]
- 14.Lazarsfeld PF, Merton RK. Friendship as a social process: A substantive and methodological analysis. Freedom and Control in Modern Society. 1954;18(1):18–66. [Google Scholar]
- 15.Currarini S, Jackson MO, Pin P. An economic model of friendship: Homophily, minorities, and segregation. Econometrica. 2009;77(4):1003–1045. [Google Scholar]
- 16.Axelrod R. The dissemination of culture a model with local convergence and global polarization. J Conflict Resolut. 1997;41(2):203–226. [Google Scholar]
- 17.Golub B, Jackson MO. How homophily affects the speed of learning and best-response dynamics. Q J Econ. 2012;127(3):1287–1338. [Google Scholar]
- 18.Centola D, Gonzalez-Avella JC, Eguiluz VM, San Miguel M. Homophily, cultural drift, and the co-evolution of cultural groups. J Conflict Resolut. 2007;51(6):905–929. [Google Scholar]
- 19.Centola D. An experimental study of homophily in the adoption of health behavior. Science. 2011;334(6060):1269–1272. doi: 10.1126/science.1207055. [DOI] [PubMed] [Google Scholar]
- 20.Aral S, Muchnik L, Sundararajan A. Distinguishing influence-based contagion from homophily-driven diffusion in dynamic networks. Proc Natl Acad Sci USA. 2009;106(51):21544–21549. doi: 10.1073/pnas.0908800106. [DOI] [PMC free article] [PubMed] [Google Scholar]
- 21.Moody J. Race, school integration, and friendship segregation in America. Am J Sociol. 2001;107(3):679–716. [Google Scholar]
- 22.Mercken L, Snijders TA, Steglich C, Vartiainen E, De Vries H. Dynamics of adolescent friendship networks and smoking behavior. Soc Networks. 2010;32(1):72–81. doi: 10.1016/j.socscimed.2009.08.003. [DOI] [PubMed] [Google Scholar]
- 23.Ennett ST, Bauman KE. The contribution of influence and selection to adolescent peer group homogeneity: The case of adolescent cigarette smoking. J Pers Soc Psychol. 1994;67(4):653–663. doi: 10.1037//0022-3514.67.4.653. [DOI] [PubMed] [Google Scholar]
- 24.Barnes-Mauthe M, Arita S, Allen SD, Gray SA, Leung PS. The influence of ethnic diversity on social network structure in a common-pool resource system: Implications for collaborative management. Ecol Soc. 2013;18(1):23. [Google Scholar]
- 25.Ostrom E, Gardner R, Walker J. Rules, Games, and Common-Pool Resources. Univ of Michigan Press; Ann Arbor, MI: 1994. [Google Scholar]
- 26.Wilson JA. Fishing for knowledge. Land Econ. 1990;66(1):12–29. [Google Scholar]
- 27.Crona B, Bodin Ö. Friends or neighbors? Subgroup heterogeneity and the importance of bonding and bridging ties in natural resource governance. In: Bodin Ö, Prell C, editors. Social Networks and Natural Resource Management: Uncovering the Social Fabric of Environmental Governance. Cambridge Univ Press; Cambridge, UK: 2011. pp. 206–233. [Google Scholar]
- 28.Poteete AR, Ostrom E. Heterogeneity, group size and collective action: The role of institutions in forest management. Dev Change. 2004;35(3):435–461. [Google Scholar]
- 29.Baerveldt C, Van Duijn MAJ, Vermeij L, Van Hemert DA. Ethnic boundaries and personal choice. Assessing the influence of individual inclinations to choose intra-ethnic relationships on pupils’ networks. Soc Networks. 2004;26(1):55–74. [Google Scholar]
- 30.Bromhead D, et al. Identification of factors influencing shark catch and mortality in the Marshall Islands tuna longline fishery and management implications. J Fish Biol. 2012;80(5):1870–1894. doi: 10.1111/j.1095-8649.2012.03238.x. [DOI] [PubMed] [Google Scholar]
- 31.Gilman E, et al. Shark interactions in pelagic longline fisheries. Mar Policy. 2008;32(1):1–18. [Google Scholar]
- 32.Friedkin NE. Structural cohesion and equivalence explanations of social homogeneity. Sociol Methods Res. 1984;12(3):235–261. [Google Scholar]
- 33.Centola D, Macy M. Complex contagions and the weakness of long ties. Am J Sociol. 2007;113(3):702–734. [Google Scholar]
- 34.Lewison RL, Crowder LB, Read AJ, Freeman SA. Understanding impacts of fisheries bycatch on marine megafauna. Trends Ecol Evol. 2004;19(11):598–604. [Google Scholar]
- 35.Walsh WA, Bigelow KA, Sender KL. Decreases in shark catches and mortality in the Hawaii-based longline fishery as documented by fishery observers. Mar Coast Fish. 2009;1(1):270–282. [Google Scholar]
- 36.Fortin B, Boucher V. Some challenges in the empirics of the effects of networks. In: Bramoullé Y, Galeotti A, editors. Oxford Handbook on the Economics of Networks. Oxford Univ Press; Oxford: 2015. pp. 277–302. [Google Scholar]
- 37.Branch TA, et al. Fleet dynamics and fishermen behavior: Lessons for fisheries managers. Can J Fish Aquat Sci. 2006;63(7):1647–1668. [Google Scholar]
- 38.Robins G. Doing Social Network Research: Network-Based Research Design for Social Scientists. Sage; London: 2015. [Google Scholar]
- 39.Barnes ML, Kalberg K, Pan M, Leung P. When is brokerage negatively associated with economic benefits? Ethnic diversity, competition, and common-pool resources. Soc Networks. 2016;45:55–65. [Google Scholar]
- 40.Walsh WA, Kleiber P, McCracken M. Comparison of logbook reports of incidental blue shark catch rates by Hawaii-based longline vessels to fishery observer data by application of a generalized additive model. Fish Res. 2002;58(1):79–94. [Google Scholar]
- 41.Borgatti SP. 2002. NetDraw: Graph Visualization Software (Harvard: Analytic Technologies, Lexington, KY)
- 42.Brodziak J, Walsh WA, Hilborn R. Model selection and multimodel inference for standardizing catch rates of bycatch species: A case study of oceanic whitetip shark in the Hawaii-based longline fishery. Can J Fish Aquat Sci. 2013;70(12):1723–1740. [Google Scholar]