

Abstract
Objective The objective of this study was to determine the effect of birthweight on prospective stillbirth risk.
Methods Cross-sectional study of singleton births in the United States from 2010 to 2012 from 32 through 42 weeks was conducted. Stillbirth risk was stratified by birthweight and gestational age adjusted for time from death to delivery. The primary outcome was the prospective stillbirth risk for each birthweight category. Student t-test was used for continuous data, chi-square to compare categorical data. Binomial proportions were used to derive prospective and cumulative risks. Cox proportional hazards regression with log–rank test comparison for heterogeneity was used to compare birthweight categories and derive hazard ratios.
Results There was an increase in the risk for stillbirth as birthweight diverged from the reference group. At 40 weeks adjusted gestational age, stillbirth rate per 10,000 births for the bottom (6.17, 95% CI: 7.47–4.87) and top (2.37, 95%CI: 3.1–1.65) 5th centiles of birthweight conveyed the highest risk. Hazard ratios (HR) after adjusting for covariates were: 1.55 (1.73–1.4) <5th centile and 2.2 (2.43–1.99) > 95th centile (p < 0.001).
Conclusion Stillbirth risk increases as birthweight departs from the mean. Birthweight below the 5th and above the 95th centile conveyed a significantly increased risk for stillbirth which was most noticeable after 37 weeks.
Keywords: third trimester, birthweight, stillbirth, growth restriction, prospective risk
Stillbirth rates are a sensitive indicator of quality in a country's healthcare system.1 There are relatively limited data regarding its significance and prevention.1 2 In the United States, the stillbirth rate is ∼3 per 1,000. The rate has decreased by 30% among preterm births between 1989 and 2000.3 This decline was partly caused by a 55% increase in medically indicated preterm births during the same period.3 Subsequently, from 2005 through 2012, medically indicated preterm birth declined by 17% indicating improvements in the identification of fetuses at risk for adverse outcomes.4 Aggressive management of conditions such as Rh alloimmunization, diabetes, preeclampsia, and fetal growth restriction (FGR) has also contributed to this decrease.5 6 7 8 9
Although prior case–control and cohort studies have demonstrated that low weight is a risk factor for stillbirth,10 11 several studies have shown that both the upper and lower extremes of birthweight are associated with an increased risk for stillbirth.12 13 Several reports have led to recommendations for heightened fetal surveillance of small fetuses with late preterm or early term delivery to prevent stillbirth,14 15 16 17 18 19 but there is no clear guidance for those in the highest birthweight centiles.
Stillbirth rate is defined as the number of stillbirths in a specific week of gestation per all births in the same week of gestation. The prospective stillbirth risk is defined as the number of stillbirths in a specific week of gestation per all ongoing pregnancies in that week of gestation,20 and the cumulative risk of stillbirth is the sum of the prospective stillbirth risks, and it increases with advancing gestational age. It depicts how the additive effect of prospective risk of stillbirth increases over time.21 22
We sought to quantify the effect of birthweight on the prospective risk of stillbirth in the US population. Although birthweight below the 10th centile is the most commonly used definition below which the risk increases,23 24 25 low birthweight is not a dichotomous condition. We hypothesize that the risk for stillbirth increases gradually as birthweight centile decreases. The objective of this study was to quantify the risk of stillbirth within birthweight decile categories ranging from the lowest to the highest deciles of birthweight.
Methods
This is a population-based, cross-sectional analysis of singleton live births in the United States from the years 2010 through 2012. Data were accessed from the National Center for Health Statistics (NCHS).26 The NCHS compiles information from the US birth data files and fetal death data files, which are required for all births. The validity of the data has been documented.27 This is de-identified and publicly available information and was exempt from Institutional Review Board review.
We used the obstetric estimate of gestation which provides better estimates of gestational age than does the last menstrual period LMP.28 The stillbirth certificate reports gestational age based on time of delivery and would be expected to overestimate gestational age. The gestational age for all stillbirths was randomly adjusted downwards by 0 to 4 weeks in the proportions equal to those reported for a large US stillbirth cohort.29 The adjustment was performed prior to any exclusions. We performed all analyses with and without adjustment for gestational age.
We included only singleton births from women residing and delivering in the United States between 2010 and 2012. The analysis was performed at each week of gestation from 32 to 42 weeks because this is when most fetal surveillance algorithms are implemented. Exclusion criteria were gestational age less than 32 or more than 42 weeks, twins or higher order multiples, and all fetuses with congenital anomalies or known aneuploidy, which have an increased risk for stillbirth independent of growth restriction or gestational age.
The reference curves were established using birthweights from the population of livebirths in 2012.30 31 32 The mean birthweight and standard deviation for each week of gestation were used to obtain a centile for each birthweight. Birthweight centiles were stratified into 12 groups: <3rd, < 5th, 5th to 10th, 11th to 20th, 21st to 30th, 31st to 40th, 41st to 60th, 61st to 70th, 71st to 80th, 81st to 90th, 91st to 95th and > 95th centile.
We compared the descriptive data between stillborn and live-born infants. Continuous data were compared with the Student t-test and categorical data were compared with a chi-square test. P values are all two sided with p < 0.05 considered to be significant. Binomial proportions for prospective and cumulative stillbirth risks were obtained.21 The prospective risk of stillbirth is considered to be a better indicator of the population at risk than the stillbirth rate.33 34 An adjustment that excluded half of the deliveries occurring in the week analyzed was made to account for births that occurred during that week and would no longer have been at risk for death.21 For cumulative risk for stillbirth, first we calculated the cumulative probability of survival as the product of the prospective probabilities of survival. The cumulative probability of stillbirth was 1– probability of survival.21 We plotted the cumulative probability of stillbirth with deliveries censored at each week of gestation as Kaplan Meier failure curves.35 Risks were stratified by birthweight category and reported per 10,000 births.
The effect of demographic and clinical variables on risk of stillbirth was analyzed in a multivariate model using a Cox proportional hazards regression with log-rank test comparison for heterogeneity. Hazard ratios are the best descriptor for risk of events over a specific interval of time.36 The reference group for the relative risk were infants born in the 41–60% birthweight category. For multiple analyses between birthweight categories, a Bonferroni correction was performed with p values being significant when <0.004. Variables associated with both growth restriction and stillbirth, and which were available in both the live birth and stillbirth certificates, were included in the multivariate analyses.37 38 These were live birth order, maternal age, weight gain, and race.20 38 The variables maternal smoking, body mass index, the results of antepartum surveillance, and obstetrical complications were not available in the certificate of stillbirth and were not included. The unreported values were weight gain (1,036,078), delivery method (2,058,324), race (239,201), and maternal morbidities (1,868,566). These variables were not part of the primary outcome analysis were considered missing at random and no imputations were performed.39 Values reported as unknown or blank were considered to be incomplete and were excluded.40 All data analysis was performed using SAS 9.3 (Cary, NC) .
Results
After exclusions, there were a total of 11,304,635 live births and 23,519 stillbirths available for analysis from 2010 through 2012 (Fig. 1). The characteristics of the entire cohort are described comparing the stillborn and live born infants (Table 1). Maternal age, number of prior live births, weight gain, age, race, maternal morbidities, infant weight, gender, and mode of delivery were significantly different between live and stillbirths. The total number of ongoing pregnancies, live births, stillbirths in each birthweight category is reported by adjusted gestational age in Table 1.
Fig. 1.
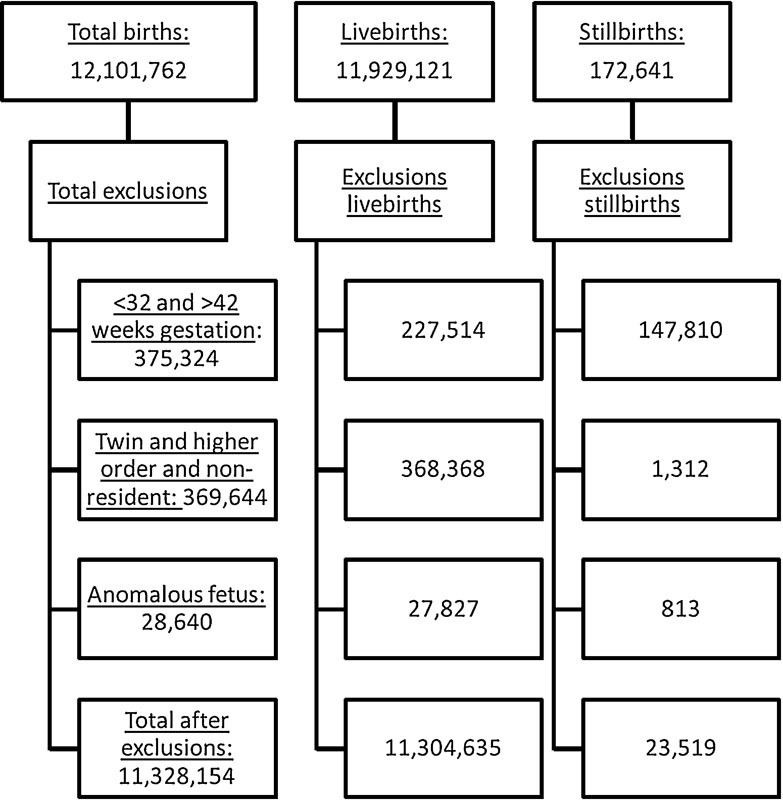
Flowchart demonstrating all women included in the study cohort according to outcome and exclusion category.
Table 1. Characteristics of cohort by pregnancy outcome (n = 11,328,154).
| Characteristics | Live birth (11,304,635) |
Stillbirth (23,519) |
|---|---|---|
| Maternal | ||
| Age, mean(SD) | 27.8 (6.0) | 28.2 (6.5) |
| Age category, y, n (%) | ||
| Younger than 25 | 3,658,180 (32.4) | 7,513 (31.9) |
| 25–34 | 6,024,789 (53.3) | 11,659 (49.6) |
| Older than 35 | 1,621,666 (14.4) | 4,347 (18.5) |
| Previous live births, n (%) | ||
| 0 | 4,566,385 (40.4) | 14,026 (59.6) |
| 1–2 | 5,383,399 (47.6) | 6,035 (25.7) |
| 3–4 | 1,058,357 (9.4) | 1,522 (6.5) |
| > 4 | 296,494 (2.6) | 1,936 (8.2) |
| Weight gain in kg, n (%) | ||
| Less than 5 | 893,990 (8.7) | 3,533 (15.9) |
| 5–14 | 4,904,098 (47.8) | 9,702 (43.7) |
| 15–24 | 3,433,494 (33.4) | 4,130 (18.6) |
| 25–34 | 432,063 (4.2) | 524 (2.4) |
| Greater than 34 | 606,235 (5.9) | 4,307 (19.4) |
| Race–ethnicity, n (%) | ||
| White non-Latino | 6,112,340 (55.2) | 10,989 (49.5) |
| Black non-Latino | 1,636,928 (14.8) | 5,148 (23.2) |
| White Latino | 2,491,475 (22.5) | 4,731 (21.3) |
| Black Latino | 125,716 (1.1) | 231 (1.0) |
| Other | 700,290 (6.3) | 1,105 (4.9) |
| Maternal morbidities, n (%) | ||
| Pregestational diabetes | 67,697 (0.7) | 2,796 (12.5) |
| Chronic hypertension | 123,368 (1.3) | 916 (4.1) |
| Preeclampsia | 395,304 (4.2) | 1,427 (6.4) |
| Eclampsia | 16,682 (0.2) | 156 (0.7) |
| Infant | ||
| Gestational age at delivery, mean (SD) | 38.8 (1.5) | 36.3 (2.5) |
| Gestational age at delivery in weeks, n (%) | ||
| 32 | 40,183 (0.4) | 2,152 (9.2) |
| 33 | 58,274 (0.5) | 1,993 (8.5) |
| 34 | 108,854 (1.0) | 2,284 (9.7) |
| 35 | 179,159 (1.6) | 2,445 (10.4) |
| 36 | 384,986 (3.4) | 2,973 (12.6) |
| 37 | 925,965 (8.2) | 3,202 (13.6) |
| 38 | 2,047,163 (18.1) | 3,305 (14.1) |
| 39 | 4,226,642 (37.4) | 2,812 (12.0) |
| 40 | 2,558,635 (22.6) | 1,742 (7.4) |
| 41 | 728,269 (6.4) | 496 (2.1) |
| 42 | 46,505 (0.4) | 115 (0.5) |
| Gender, n (%) | ||
| Female | 5,520,803 (48.8) | 11,236 (47.8) |
| Male | 5,783,832 (51.2) | 11,236 (52.2) |
| Unknown | 0 | 1,047 |
| Birth weight in grams, mean (SD) | 3,331 (526) | 2,920 (1,833) |
| Delivery method n(%) | ||
| Vaginal | 6,383,296 (69.0) | 16,812 (71.8) |
| Cesarean | 2,855,512 (30.9) | 5,663 (24.2) |
| Unknown | 7,601 (0.1) | 946 (4.0) |
Abbreviation: SD, standard deviation.
Note: Comparisons between live births and stillbirths using Student t-test for continuous variables or chi square for categorical variables. p < 0.001.
The prospective and cumulative risk of stillbirth for the entire cohort, according to clinical estimate and adjusted gestational age, are shown in Fig. 2. The prospective and cumulative stillbirth risk gradually increased up to 39 weeks, with an upwards inflection of the slope at 39 weeks among the unadjusted gestational age values. The risks after adjusting for gestational age at death demonstrated a lower risk up to 41 weeks with an inflection after 41 weeks which was observed for both adjusted and unadjusted values.
Fig. 2.

Stillbirth risk according to gestational age and adjusted gestational age. Prospective stillbirth risk numerator are stillbirths occurring in a specific week of pregnancy, and the denominator is all ongoing pregnancies. Cumulative stillbirth risk is 1- the product of the cumulative risks of survival up to a week of gestation.
The binomial proportions for the prospective and cumulative risk of stillbirth by birthweight category were derived using the adjusted gestational age (Table 2). The lowest proportions are seen in the 31st to 40th centile category, which was similar to that reported for the reference group. The highest risk was observed for birthweights below the 5th and above the 95th centiles. The cumulative stillbirth risk, which reflects the total accumulated risk, for birthweights below the 3rd centile ranged from 2.61 per 10,000 at 32 weeks to 73.33 per 10,000 at 42 weeks. For birthweights below the 5th centile, it was 2.34 per 10,000 at 32 weeks and 63.15 per 10,000 at 42 weeks. In comparison, for stillbirths with birthweights above the 95th centile, the risk was 4.03 per 10,000 at 32 weeks and 37.01 per 10,000 at 42 weeks, which was higher than in all other categories except for below the 5th centile (Table 2).
Table 2. Prospective and cumulative risk of stillbirth according to birthweight category and adjusted gestational age.
| Week | Ongoing | Live | Stillbirths | Prospective riska | Cumulative riska | Ongoing | Live | Stillbirths | Prospective riska | Cumulative riska |
|---|---|---|---|---|---|---|---|---|---|---|
| <3% | <5% | |||||||||
| 32 | 524901 | 1437 | 137 | 2.61 (3.06–2.17) | 2.61 (6.28–0) | 816537 | 2319 | 191 | 2.34 (2.68–2) | 2.34 (5.84–0) |
| 33 | 523327 | 2738 | 182 | 3.49 (4–2.97) | 6.1 (11.44–0.76) | 814027 | 4173 | 230 | 2.83 (3.2–2.46) | 5.17 (10.13–0.22) |
| 34 | 520407 | 5333 | 207 | 4 (4.55–3.44) | 10.1 (16.82–3.37) | 809624 | 7691 | 265 | 3.29 (3.69–2.89) | 8.46 (14.66–2.26) |
| 35 | 514867 | 9240 | 216 | 4.23 (4.81–3.66) | 14.32 (22.24–6.41) | 801668 | 13206 | 285 | 3.58 (4.01–3.16) | 12.04 (19.34–4.75) |
| 36 | 505411 | 19814 | 223 | 4.5 (5.1–3.9) | 18.82 (27.81–9.82) | 788177 | 29138 | 299 | 3.86 (4.31–3.42) | 15.9 (24.21–7.59) |
| 37 | 485374 | 51730 | 217 | 4.72 (5.36–4.08) | 23.53 (33.53–13.54) | 758740 | 76531 | 278 | 3.86 (4.32–3.4) | 19.76 (28.96–10.55) |
| 38 | 433427 | 94925 | 208 | 5.39 (6.13–4.64) | 28.91 (39.93–17.89) | 681931 | 145701 | 255 | 4.18 (4.71–3.66) | 23.93 (34.01–13.86) |
| 39 | 338294 | 183912 | 139 | 5.64 (6.6–4.68) | 34.53 (46.53–22.54) | 535975 | 293225 | 185 | 4.75 (5.45–4.05) | 28.67 (39.65–17.69) |
| 40 | 154243 | 121032 | 74 | 7.89 (9.74–6.04) | 42.4 (55.64–29.17) | 242565 | 190293 | 91 | 6.17 (7.47–4.87) | 34.83 (46.88–22.78) |
| 41 | 33137 | 30969 | 22 | 12.45 (17.93–6.97) | 54.81 (69.78–39.84) | 52181 | 48947 | 27 | 9.73 (13.59–5.88) | 44.54 (58.09–30.99) |
| 42 | 2146 | 2144 | 2 | 18.59 (48.97–0) | 73.33 (90.55–56.11) | 3207 | 3204 | 3 | 18.66 (42.86–0) | 63.15 (79.17–47.12) |
| 5–10% | >10–20% | |||||||||
| 32 | 620674 | 1851 | 100 | 1.61 (1.94–1.29) | 1.61 (4.6–0) | 1098704 | 3624 | 4.03 | 1.32 (1.54–1.1) | 1.32 (4.08–0) |
| 33 | 618723 | 2770 | 98 | 1.59 (1.91–1.26) | 3.2 (7.21–0) | 1094935 | 5145 | 131 | 1.2 (1.41–0.99) | 2.52 (6.13–0) |
| 34 | 615855 | 5165 | 118 | 1.92 (2.28–1.57) | 5.12 (10.06–0.19) | 1089659 | 10888 | 134 | 1.24 (1.45–1.02) | 3.76 (8.050) |
| 35 | 610572 | 8368 | 107 | 1.76 (2.11–1.42) | 6.89 (12.53–1.25) | 1078637 | 15891 | 142 | 1.33 (1.55–1.1) | 5.08 (10–0.16) |
| 36 | 602097 | 19431 | 100 | 1.69 (2.03–1.35) | 8.57 (14.81–2.34) | 1062604 | 35520 | 150 | 1.44 (1.67–1.2) | 6.52 (12.02–1.02) |
| 37 | 582566 | 48796 | 112 | 2.01 (2.39–1.63) | 10.58 (17.45–3.71) | 1026934 | 85636 | 153 | 1.55 (1.81–1.3) | 8.07 (14.14–2.01) |
| 38 | 533658 | 104824 | 95 | 1.97 (2.38–1.57) | 12.55 (19.99–5.11) | 941145 | 192596 | 137 | 1.62 (1.9–1.34) | 9.69 (16.29–3.09) |
| 39 | 428739 | 224454 | 83 | 2.62 (3.2–2.04) | 15.17 (23.3–7.04) | 748412 | 405941 | 90 | 1.65 (2–1.3) | 11.34 (18.44–4.24) |
| 40 | 204202 | 164461 | 33 | 2.7 (3.67–1.74) | 17.87 (26.65–9.09) | 342381 | 263064 | 53 | 2.51 (3.21–1.81) | 13.85 (21.64–6.06) |
| 41 | 39708 | 37578 | 8 | 3.82 (6.71–0.94) | 21.69 (31.31–12.07) | 79264 | 75440 | 12 | 2.89 (4.64–1.13) | 16.73 (25.25–8.22) |
| 42 | 2122 | 2119 | 3 | 28.14 (64.6–30) | 49.85 (64.15–35.55) | 3812 | 3809 | 3 | 15.7 (36.07–0) | 32.43 (44.08–20.79) |
| >20–30% | >30–40% | |||||||||
| 32 | 1061877 | 3619 | 117 | 1.1 (1.31–0.9) | 1.1 (3.66–0) | 1035326 | 3687 | 80 | 0.77 (0.95–0.6) | 0.77 (3–0) |
| 33 | 1058141 | 5501 | 108 | 1.02 (1.22–0.83) | 2.13 (5.48–0) | 1031559 | 5281 | 107 | 1.04 (1.24–0.84) | 1.81 (4.95–0) |
| 34 | 1052532 | 8946 | 121 | 1.15 (1.36–0.94) | 3.28 (7.33–0) | 1026171 | 9446 | 111 | 1.09 (1.29–0.88) | 2.9 (6.74–0) |
| 35 | 1043465 | 16349 | 181 | 1.75 (2.01–1.49) | 5.03 (9.92–0.13) | 1016614 | 15486 | 133 | 1.32 (1.55–1.09) | 4.22 (8.74–0) |
| 36 | 1026935 | 34339 | 131 | 1.3 (1.52–1.07) | 6.33 (11.75–0.9) | 1000995 | 31166 | 113 | 1.15 (1.36–0.93) | 5.36 (10.4–0.33) |
| 37 | 992465 | 85241 | 130 | 1.37 (1.61–1.13) | 7.69 (13.63–1.76) | 969716 | 74452 | 118 | 1.27 (1.5–1.03) | 6.63 (12.17–1.08) |
| 38 | 907094 | 187551 | 132 | 1.62 (1.91–1.34) | 9.32 (15.79–2.84) | 895146 | 198353 | 116 | 1.46 (1.73–1.19) | 8.09 (14.16–2.01) |
| 39 | 719411 | 395677 | 78 | 1.5 (1.84–1.15) | 10.81 (17.75–3.87) | 696677 | 418600 | 68 | 1.4 (1.74–1.05) | 9.48 (16.01–2.95) |
| 40 | 323656 | 252870 | 36 | 1.83 (2.45–1.2) | 12.63 (20.09–5.17) | 278009 | 214742 | 25 | 1.46 (2.07–0.86) | 10.94 (17.92–3.96) |
| 41 | 70750 | 67082 | 8 | 2.15 (3.77–0.53) | 14.78 (22.81–6.75) | 63242 | 59418 | 7 | 2.09 (3.78–0.39) | 13.03 (20.6–5.46) |
| 42 | 3660 | 3657 | 3 | 16.35 (37.56–0) | 31.13 (42.55–19.71) | 3817 | 3816 | 1 | 5.24 (18.11–0) | 18.26 (27.13–9.39) |
| >40–60% | >60–70% | |||||||||
| 32 | 1863832 | 7352 | 198 | 1.06 (1.22–0.91) | 1.06 (3.59–0) | 927021 | 4237 | 133 | 1.44 (1.69–1.19) | 1.44 (4.29–0) |
| 33 | 1856282 | 11151 | 194 | 1.05 (1.2–0.9) | 2.11 (5.46–0) | 922651 | 5136 | 106 | 1.15 (1.38–0.93) | 2.59 (6.24–0) |
| 34 | 1844937 | 19796 | 266 | 1.45 (1.63–1.27) | 3.56 (7.76–0) | 917409 | 9451 | 137 | 1.5 (1.76–1.24) | 4.09 (8.55–0) |
| 35 | 1824875 | 30639 | 230 | 1.27 (1.44–1.1) | 4.83 (9.64–0.02) | 907821 | 14714 | 114 | 1.27 (1.5–1.03) | 5.36 (10.39–0.32) |
| 36 | 1794006 | 63660 | 247 | 1.4 (1.58–1.22) | 6.23 (11.63–0.84) | 892993 | 35987 | 147 | 1.68 (1.96–1.4) | 7.04 (12.73–1.34) |
| 37 | 1730099 | 150147 | 233 | 1.41 (1.59–1.22) | 7.64 (13.56–1.72) | 856859 | 85082 | 139 | 1.71 (2–1.42) | 8.74 (15.03–2.45) |
| 38 | 1579719 | 334071 | 188 | 1.33 (1.52–1.14) | 8.97 (15.34–2.6) | 771638 | 160940 | 96 | 1.39 (1.67–1.1) | 10.13 (16.86–3.39) |
| 39 | 1245460 | 697569 | 100 | 1.12 (1.34–0.89) | 10.08 (16.81–3.36) | 610602 | 333811 | 52 | 1.17 (1.5–0.84) | 11.3 (18.38–4.21) |
| 40 | 547791 | 422381 | 61 | 1.81 (2.28–1.34) | 11.89 (19.15–4.64) | 276739 | 214184 | 34 | 2 (2.71–1.3) | 13.3 (20.94–5.66) |
| 41 | 125349 | 118391 | 20 | 3.02 (4.42–1.62) | 14.91 (22.98–6.85) | 62521 | 58919 | 7 | 2.12 (3.84–0.4) | 15.42 (23.61–7.23) |
| 42 | 6938 | 6935 | 3 | 8.64 (19.84–0) | 23.54 (33.54–13.55) | 3595 | 3594 | 1 | 5.56 (19.23–0) | 20.97 (30.43–11.5) |
| >70–80% | >80–90% | |||||||||
| 32 | 967482 | 3823 | 114 | 1.18 (1.4–0.96) | 1.18 (3.81–0) | 1061514 | 3718 | 180 | 1.7 (1.95–1.45) | 1.7 (4.75–0) |
| 33 | 963545 | 5233 | 165 | 1.72 (1.98–1.45) | 2.9 (6.73–0) | 1057616 | 4934 | 183 | 1.73 (1.99–1.48) | 3.43 (7.56–0) |
| 34 | 958147 | 9742 | 142 | 1.49 (1.74–1.24) | 4.39 (8.99–0) | 1052499 | 9532 | 201 | 1.92 (2.19–1.65) | 5.35 (10.38–0.32) |
| 35 | 948263 | 16046 | 170 | 1.81 (2.08–1.53) | 6.19 (11.57–0.82) | 1042766 | 16186 | 182 | 1.76 (2.02–1.5) | 7.11 (12.83–1.38) |
| 36 | 932047 | 28782 | 158 | 1.72 (2–1.45) | 7.91 (13.93–1.9) | 1026398 | 38204 | 234 | 2.32 (2.63–2.02) | 9.43 (15.95–2.91) |
| 37 | 903107 | 69974 | 130 | 1.5 (1.76–1.23) | 9.41 (15.92–2.9) | 987960 | 89739 | 143 | 1.52 (1.77–1.26) | 10.94 (17.93–3.96) |
| 38 | 833003 | 181259 | 109 | 1.47 (1.75–1.19) | 10.88 (17.84–3.92) | 898078 | 185972 | 105 | 1.3 (1.56–1.05) | 12.25 (19.6–4.89) |
| 39 | 651635 | 370384 | 76 | 1.63 (2.01–1.25) | 12.51 (19.93–5.08) | 712001 | 385278 | 66 | 1.27 (1.59–0.95) | 13.52 (21.22–5.82) |
| 40 | 281175 | 211756 | 19 | 1.08 (1.6–0.57) | 13.59 (21.31–5.87) | 326657 | 247646 | 42 | 2.07 (2.72–1.42) | 15.58 (23.82–7.35) |
| 41 | 69400 | 65147 | 10 | 2.71 (4.53–0.9) | 16.3 (24.71–7.89) | 78969 | 74397 | 12 | 2.87 (4.62–1.13) | 18.45 (27.36–9.54) |
| 42 | 4243 | 4241 | 2 | 9.41 (24.8–0) | 25.7 (36.13–15.28) | 4560 | 4559 | 1 | 4.38 (15.16–0) | 22.83 (32.68–12.98) |
| >90–95% | >95% | |||||||||
| 32 | 605137 | 1685 | 167 | 2.76 (3.19–2.34) | 2.76 (6.52–0) | 1059143 | 2551 | 426 | 4.03 (4.41–3.64) | 4.03 (8.46–0) |
| 33 | 603285 | 2668 | 132 | 2.19 (2.57–1.81) | 4.96 (9.82–0.09) | 1056166 | 4236 | 489 | 4.64 (5.05–4.22) | 8.66 (14.93–2.4) |
| 34 | 600485 | 5687 | 169 | 2.83 (3.26–2.39) | 7.78 (13.75–1.82) | 1051441 | 8706 | 494 | 4.72 (5.14–4.3) | 13.38 (21.04–5.71) |
| 35 | 594629 | 9231 | 123 | 2.08 (2.46–1.71) | 9.87 (16.52–3.21) | 1042241 | 17007 | 495 | 4.79 (5.21–4.36) | 18.16 (27–9.32) |
| 36 | 585275 | 20125 | 146 | 2.54 (2.96–2.12) | 12.4 (19.8–5) | 1024739 | 37066 | 424 | 4.21 (4.62–3.81) | 22.37 (32.13–12.61) |
| 37 | 565004 | 47338 | 89 | 1.64 (1.99–1.29) | 14.04 (21.88–6.2) | 987249 | 88846 | 297 | 3.15 (3.51–2.79) | 25.51 (35.9–15.12) |
| 38 | 517577 | 111481 | 72 | 1.56 (1.93–1.19) | 15.6 (23.83–7.36) | 898106 | 202545 | 161 | 2.02 (2.34–1.7) | 27.52 (38.29–16.76) |
| 39 | 406024 | 233307 | 39 | 1.35 (1.79–0.91) | 16.95 (25.51–8.38) | 695400 | 402240 | 106 | 2.14 (2.56–1.73) | 29.66 (40.82–18.5) |
| 40 | 172678 | 128604 | 16 | 1.48 (2.25–0.71) | 18.42 (27.32–9.52) | 293054 | 215424 | 44 | 2.37 (3.1–1.65) | 32.03 (43.61–20.46) |
| 41 | 44058 | 40736 | 6 | 2.53 (4.77–0.3) | 20.95 (30.41–11.49) | 77586 | 71556 | 7 | 1.67 (3.03–0.31) | 33.7 (45.56–21.84) |
| 42 | 3316 | 3316 | 0 | 6023 | 6022 | 1 | 3.32 (11.48–0) | 37.01 (49.41–24.61) | ||
Per 10,000 pregnancies.
Kaplan–Meier failure curves were used to plot the cumulative risk for fetal death according to birthweight categories. The frequencies were similar to those obtained by calculating the binomial proportions (Figs. 3A and 3B). Using the clinical estimate of gestational age used in the certificate of fetal death, events with birthweights below the 5th centile had higher cumulative stillbirth risk compared with those above the 5th centile (Log rank p < 0.001). The lowest cumulative stillbirth risks were observed for those born between the 71st and the 95th centile. These were lower than the cumulative stillbirth risk for the reference group (41st to 60th centile). Birthweights above the 95th centile were associated with cumulative stillbirth risks similar to those of the reference group (Fig. 3A).
Fig. 3.
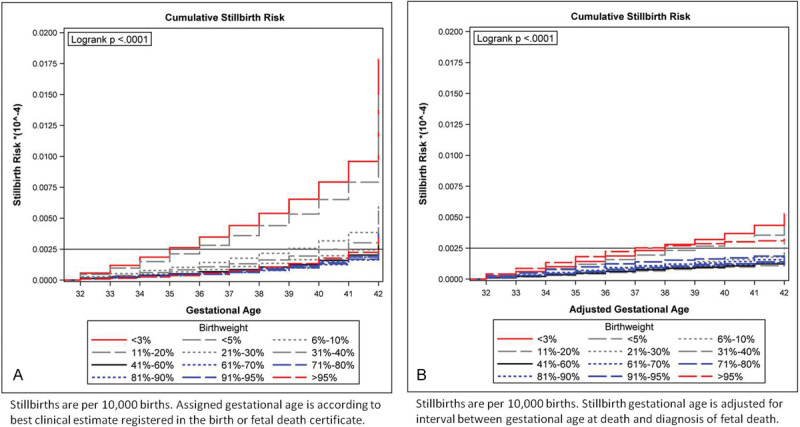
(A) Cumulative stillbirth risk by birthweight category according to unadjusted gestational age. Stillbirths are per 10,000 births. Unadjusted gestational age is according to best clinical estimate registered in the birth or fetal death certificate. (B) Cumulative stillbirth risk by birthweight category according to adjusted gestational age. Stillbirths are per 10,000 births. Stillbirth gestational age is adjusted for interval between gestational age at time of diagnosis of fetal death and gestational age at time of delivery.
After adjusting the gestational age for time from death to delivery, we observed a smoother transition in cumulative stillbirth risks between the birthweight categories. The lowest risk was for those in both the reference and 31st to 40th centile categories. The risk for those above the 95th centile was similar to that observed for those below the 5th centile, all of which were higher than the rest of the cohort (Log-rank test p < 0.001). This divergence was particularly noticeable after 37 weeks of gestation (Fig. 3B).
The hazard ratio for stillbirth in each birthweight category was compared with the reference group of birthweights between the 41st and the 60th centiles. The analysis was performed using both the clinical estimate of gestational age and the adjusted gestational age (Table 3). As observed in the Kaplan–Meier survival curves, the lowest cumulative risk of stillbirth was observed for infants with birthweights between the 61st and the 95th centile. After adjusting the gestational age, the risk gradually increased for all birthweight categories above or below the reference group. The exception was fetuses between the 31st and the 40th centiles. The hazard ratios for infants with birthweights above the 95th centile were similar to those below the 5th centile.
Table 3. Hazard ratio for stillbirth according to birthweight category.
| Birthweight | Clinical estimate gestational age | Adjusted gestational age | ||
|---|---|---|---|---|
| Hazard ratio (95% CI) | p | Hazard ratio (95% CI) | p | |
| < 3% | 4.69 (4.96–4.43) | <0.0001 | 2.85 (3.07–2.66) | <0.0001 |
| < 5% | 2.33 (2.53–2.15) | <0.0001 | 1.55 (1.73–1.4) | <0.0001 |
| 5–10% | 1.95 (2.09–1.82) | <0.0001 | 1.35 (1.47–1.24) | <0.0001 |
| 11–20% | 1.51 (1.61–1.42) | <0.0001 | 1.04 (1.13–0.96) | 0.329 |
| 21–30% | 1.26 (1.35–1.18) | <0.0001 | 1.02 (1.1–0.94) | 0.697 |
| 31–40% | 1.01 (1.08–0.94) | 0.817 | 0.89 (0.97–0.82) | 0.008 |
| 61–70% | 0.94 (1.01–0.87) | 0.088 | 1.13 (1.23–1.04) | 0.0042 |
| 71–80% | 0.91 (0.98–0.84) | 0.011 | 1.26 (1.37–1.17) | <0.0001 |
| 81–90% | 0.79 (0.85–0.73) | <0.0001 | 1.45 (1.56–1.34) | <0.0001 |
| 91–95% | 0.81 (0.89–0.74) | <0.0001 | 1.83 (1.99–1.68) | <0.0001 |
| >95% | 0.89 (1.01–0.79) | 0.066 | 2.2 (2.43–1.99) | <0.0001 |
Discussion
Main Findings
The data presented demonstrate that in the US population birthweight below the 5th and above the 95th centile was associated with the highest stillbirth risk within this US population cohort. Without accounting for time from death to delivery, the lowest risk for stillbirth was in the 71st to 95th centile categories. After adjusting for the gestational age at death, the risk gradually increased as birthweight centile category diverged from the mean. The lowest risk was observed for newborns with birthweight between the 31st and the 40th centile, who had a stillbirth risk lower than the reference group, whereas those with birthweights below the 5th and above the 95th centile had a significantly higher risk than the adjacent birthweight categories.
The clinical estimate of gestational age at birth that is reported in the fetal death certificate does not account for intrapartum deaths or time from death to delivery. Most publications regarding stillbirth rates and risks do not account for the time elapsed between actual gestational age at time of fetal death and gestational age at time of delivery. The result is an overestimation of stillbirth rates among lower birthweight categories due to assignment of gestational age at time of delivery and not gestational age at death.
Many reports on risk and odds of stillbirth use the 10th percentile or above as a reference group when calculating the relative risk or odds of stillbirths in low birthweight categories.10 Recent research has suggested that the lowest stillbirth rates are somewhere between the 80th and 95th centile of birthweight.13 41 The argument for this finding has been that higher birthweight is consistent with improved maternal nutrition and protective against perinatal mortality.13 When we analyzed our data without adjustment for time from death to delivery, we also observed the same effect, a lower stillbirth risk for larger fetuses. This effect was not seen after we adjusted gestational age for time from death to delivery suggesting that the decreased stillbirth rate observed among larger birthweight categories resulted from the assignment of those stillbirths to later gestational ages and lower birthweight categories at time of delivery. The impact of adjusting gestational age downwards among fetuses in the 80th to 95th centile would be to increase the stillbirth risk among the larger fetuses at earlier gestational ages. This may have led to the increased stillbirth rate with birthweight over the 95th centile, although increased mortality in this group has been previously reported.11
We have presented prospective and cumulative risks for stillbirth across all birthweight categories. The prospective risks and odds for stillbirth have been reported for the U.S. population, and are higher than the gestational age adjusted rates we present.10 Odds ratios can compare birthweight categories but cannot account for the effect over time or gestational age. We have reported hazard ratios which allowed us to compare the cumulative risk of stillbirth over time between birthweight categories. The magnitude of the hazard ratio gradually increased as birthweight percentile diverged from the reference group, although there was no significant difference for those with birthweights in the 61st to 70th or in the 31st to 40th birthweight centile categories. The hazard ratio was not as high as previously reported prospective risks or odds ratios for fetuses below the 5th centile, but higher than the odds ratios reported for fetuses with birthweights above the 95th centile.10 11 12
Strengths and Limitations
This study used a large national vital statistics database with over 12,000,000 deliveries in three years. The large number of events included allowed us to robustly quantify the differences in prospective and cumulative stillbirth rates across birthweight categories by week of gestation. The prospective risk for stillbirth we applied best describes the population at risk for stillbirth at 32 to 42 weeks of gestation. It included all women who were still pregnant and at risk of having a stillborn infant, a clinically useful concept. In addition, we adjusted the gestational age among all stillbirths to account for delays between time of death and delivery. This adjustment has not previously been applied in reports of stillbirth rates from a large US population cohort.
An important limitation regarding the validity of using administrative data to derive prospective and cumulative stillbirth risk is the quality of the estimates of gestational age as well as information regarding the specific cause of death and timing of death. We used the obstetrical estimate of gestational age. This has been defined as “the estimate of the infant's gestation in completed weeks based on the birth attendant's final estimate of gestation which should be determined by all perinatal factors and assessments such as ultrasound, but not the neonatal exam”42, and it appears to provide a better estimate than the last menstrual period.43
The stillbirth certificate does not account for the time transpired from the occurrence and diagnosis of stillbirth to the delivery.29 The time elapsed is reported to be less than one week in 50%, and two or more weeks in 40% stillbirths beyond 24 weeks.29 As a result, stillborns would be registered at a more advanced gestational age making them appear smaller for gestational age. To adjust for gestational age, we applied proportions from a previously validated algorithm developed to assign time of death in a cohort of stillbirths which were part of the Stillbirth Collaborative Research Network.29 On the basis of their reported data, 25.2% of stillbirths occur 0–2 days before delivery (this includes both intrapartum deaths and recent fetal deaths), 12.4% occur at approximately 1 week, 17.4% at approximately 2weeks, 8.4% at approximately 3 weeks and 20% at approximately 4 or more weeks prior to delivery. After adjusting for these predicted variations, we found a gradual increase in stillbirth rates with progressively lower or higher birthweight categories.
A third limitation is that in this database, stillbirths are all coded equally with no differentiation between intrapartum and antepartum deaths. When analyzing antepartum deaths, the correct denominator to use is the number of on-going pregnancies. However, when analyzing the risk of intrapartum deaths the correct denominator is the number of deliveries during a specific week and the overall risk is the addition of both. The frequency of intrapartum fetal death rates from previous reports show that the rates are lower than neonatal and antepartum death rates, remain stable from 37 to 42 weeks21, and would not be expected to modify the trends we have observed between birthweight categories.
Interpretation
Population-based analyses have reported on stillbirth rates according to absolute birthweight but not according to birthweight centile for gestational age.33 Although odds ratios for rates according to birthweight centile have been reported,11 12 the increased prospective and cumulative stillbirth rates below the 5th centile and above the 95th centile have not been reported by gestational age in the US population. These results support our hypothesis that the prospective stillbirth rates gradually increase as birthweight centile decreases or increases, with the largest increase among births below the 5th centile or above the 95th centile.11 44 45 The decision to analyze stillbirth rates from 32 to 42 weeks of gestation was based on the uncertainty regarding of timing of delivery and previous work demonstrating low birthweight to be a risk factor for stillbirth.11 44 45 Stillbirths prior to 30 weeks more often include aneuploidy, obstetrical, placental and infectious complications compared with deaths occurring after 30 weeks.46 After 32 weeks, maternal, and obstetrical factors play a more significant role, including maternal age and parity.47
We acknowledge that growth restriction is not a cause of stillbirth but a risk factor for stillbirth.45 The information presented highlights the impact that growth restriction and excessive fetal growth have on stillbirth rates and risk. This effect is continuous and not a dichotomous effect observed below a certain threshold. It supports the current recommendations for surveillance among growth restricted fetuses, particularly those below the 5th centile.48
An important finding in our analysis is that having a birthweight above the 95% centile was also associated with a significant increase in the risk for stillbirth when compared with infants within the median birthweight category. The magnitude of the increased risk was similar to that observed for birthweights below the 5th centile. In clinical practice, it is not uncommon to increase surveillance or intervene in cases where the fetus is considered to be large for gestational age, macrosomic or with birthweights above the 90th centile. This study defines the birthweight at which the risk increases as well as the magnitude of the risk.
Conclusion
Stillbirth risk gradually increases as birthweights diverge from the mean. Birthweights above the 95th centile or below the 5th centile convey the highest risk for stillbirth. The increased risk for stillbirth associated with birthweights above the 95th centile would qualify it as a risk factor for stillbirth similar to that attributed to birthweight below the 5th centile.14
Acknowledgments
None.
Conflict of Interest The authors have no competing interests to disclose. Authors' Contribution All three authors contributed in the conception, planning, carrying out analysis of the data, and writing up of the article. Disclosure on Ethics Approval The study was performed with publicly available administrative databases and did not require approval from our institutional review committee.
Funding
None.
References
- 1.Goldenberg R L, McClure E M, Bhutta Z A. et al. Stillbirths: the vision for 2020. Lancet. 2011;377(9779):1798–1805. doi: 10.1016/S0140-6736(10)62235-0. [DOI] [PubMed] [Google Scholar]
- 2.Darmstadt G L, Kinney M V, Chopra M. et al. Who has been caring for the baby? Lancet. 2014;384(9938):174–188. doi: 10.1016/S0140-6736(14)60458-X. [DOI] [PubMed] [Google Scholar]
- 3.Ananth C V, Joseph K S, Oyelese Y, Demissie K, Vintzileos A M. Trends in preterm birth and perinatal mortality among singletons: United States, 1989 through 2000. Obstet Gynecol. 2005;105(5 Pt 1):1084–1091. doi: 10.1097/01.AOG.0000158124.96300.c7. [DOI] [PubMed] [Google Scholar]
- 4.Gyamfi-Bannerman C, Ananth C V. Trends in spontaneous and indicated preterm delivery among singleton gestations in the United States, 2005-2012. Obstet Gynecol. 2014;124(6):1069–1074. doi: 10.1097/AOG.0000000000000546. [DOI] [PubMed] [Google Scholar]
- 5.Lees C C, Marlow N, van Wassenaer-Leemhuis A. et al. 2 year neurodevelopmental and intermediate perinatal outcomes in infants with very preterm fetal growth restriction (TRUFFLE): a randomised trial. Lancet. 2015;385(9983):2162–2172. doi: 10.1016/S0140-6736(14)62049-3. [DOI] [PubMed] [Google Scholar]
- 6.Clausson B, Gardosi J, Francis A, Cnattingius S. Perinatal outcome in SGA births defined by customised versus population-based birthweight standards. BJOG. 2001;108(8):830–834. doi: 10.1111/j.1471-0528.2001.00205.x. [DOI] [PubMed] [Google Scholar]
- 7.Getahun D, Ananth C V, Kinzler W L. Risk factors for antepartum and intrapartum stillbirth: a population-based study. Am J Obstet Gynecol. 2007;196(6):499–507. doi: 10.1016/j.ajog.2006.09.017. [DOI] [PubMed] [Google Scholar]
- 8.Malhotra A, Yahya Z, Sasi A. et al. Does fetal growth restriction lead to increased brain injury as detected by neonatal cranial ultrasound in premature infants? J Paediatr Child Health. 2015;51(11):1103–1108. doi: 10.1111/jpc.12910. [DOI] [PubMed] [Google Scholar]
- 9.Murray E, Fernandes M, Fazel M, Kennedy S H, Villar J, Stein A. Differential effect of intrauterine growth restriction on childhood neurodevelopment: a systematic review. BJOG. 2015;122(8):1062–1072. doi: 10.1111/1471-0528.13435. [DOI] [PubMed] [Google Scholar]
- 10.Pilliod R A, Cheng Y W, Snowden J M, Doss A E, Caughey A B. The risk of intrauterine fetal death in the small-for-gestational-age fetus. Am J Obstet Gynecol. 2012;207(4):3180–3.18E8. doi: 10.1016/j.ajog.2012.06.039. [DOI] [PMC free article] [PubMed] [Google Scholar]
- 11.Bukowski R, Hansen N I, Willinger M. et al. Fetal growth and risk of stillbirth: a population-based case-control study. PLoS Med. 2014;11(4):e1001633. doi: 10.1371/journal.pmed.1001633. [DOI] [PMC free article] [PubMed] [Google Scholar]
- 12.Moraitis A A, Wood A M, Fleming M, Smith G C. Birth weight percentile and the risk of term perinatal death. Obstet Gynecol. 2014;124(2 Pt 1):274–283. doi: 10.1097/AOG.0000000000000388. [DOI] [PubMed] [Google Scholar]
- 13.Vasak B, Koenen S V, Koster M P. et al. Human fetal growth is constrained below optimal for perinatal survival. Ultrasound Obstet Gynecol. 2015;45(2):162–167. doi: 10.1002/uog.14644. [DOI] [PubMed] [Google Scholar]
- 14.Spong C Y, Mercer B M, D'alton M, Kilpatrick S, Blackwell S, Saade G. Timing of indicated late-preterm and early-term birth. Obstet Gynecol. 2011;118(2 Pt 1):323–333. doi: 10.1097/AOG.0b013e3182255999. [DOI] [PMC free article] [PubMed] [Google Scholar]
- 15.Figueras F, Gardosi J. Intrauterine growth restriction: new concepts in antenatal surveillance, diagnosis, and management. Am J Obstet Gynecol. 2011;204(4):288–300. doi: 10.1016/j.ajog.2010.08.055. [DOI] [PubMed] [Google Scholar]
- 16.Hecher K, Bilardo C M, Stigter R H. et al. Monitoring of fetuses with intrauterine growth restriction: a longitudinal study. Ultrasound Obstet Gynecol. 2001;18(6):564–570. doi: 10.1046/j.0960-7692.2001.00590.x. [DOI] [PubMed] [Google Scholar]
- 17.Romero R, Kalache K D, Kadar N. Timing the delivery of the preterm severely growth-restricted fetus: venous Doppler, cardiotocography or the biophysical profile? Ultrasound Obstet Gynecol. 2002;19(2):118–121. doi: 10.1046/j.0960-7692.2002.00653.x. [DOI] [PubMed] [Google Scholar]
- 18.Turan O M, Turan S, Gungor S. et al. Progression of Doppler abnormalities in intrauterine growth restriction. Ultrasound Obstet Gynecol. 2008;32(2):160–167. doi: 10.1002/uog.5386. [DOI] [PubMed] [Google Scholar]
- 19.Crimmins S, Desai A, Block-Abraham D, Berg C, Gembruch U, Baschat A A. A comparison of Doppler and biophysical findings between liveborn and stillborn growth-restricted fetuses. Am J Obstet Gynecol. 2014;211(6):6690–6.69E12. doi: 10.1016/j.ajog.2014.06.022. [DOI] [PubMed] [Google Scholar]
- 20.MacDorman M F, Reddy U M, Silver R M. Trends in Stillbirth by Gestational Age in the United States, 2006-2012. Obstet Gynecol. 2015;126(6):1146–1150. doi: 10.1097/AOG.0000000000001152. [DOI] [PMC free article] [PubMed] [Google Scholar]
- 21.Smith G CS. Life-table analysis of the risk of perinatal death at term and post term in singleton pregnancies. Am J Obstet Gynecol. 2001;184(3):489–496. doi: 10.1067/mob.2001.109735. [DOI] [PubMed] [Google Scholar]
- 22.Smith G C Re: “A proportional hazards model with time-dependent covariates and time-varying effects for analysis of fetal and infant death” Am J Epidemiol 20051611100–101., author reply 100–101 [DOI] [PubMed] [Google Scholar]
- 23.American College of Obstetricians and Gynecologists . ACOG Practice bulletin no. 134: fetal growth restriction. Obstet Gynecol. 2013;121(5):1122–1133. doi: 10.1097/01.AOG.0000429658.85846.f9. [DOI] [PubMed] [Google Scholar]
- 24.Battaglia F C, Lubchenco L O. A practical classification of newborn infants by weight and gestational age. J Pediatr. 1967;71(2):159–163. doi: 10.1016/s0022-3476(67)80066-0. [DOI] [PubMed] [Google Scholar]
- 25.Resnik R. Intrauterine growth restriction. Obstet Gynecol. 2002;99(3):490–496. doi: 10.1016/s0029-7844(01)01780-x. [DOI] [PubMed] [Google Scholar]
- 26.National Center for Health Statistics Rockville, MD. Available at: http://www.cdc.gov/nchs/data_access/Vitalstatsonline.htm. Last accessed September 10, 2014.
- 27.Martin J A Wilson E C Osterman M J Saadi E W Sutton S R Hamilton B E Assessing the quality of medical and health data from the 2003 birth certificate revision: results from two states Natl Vital Stat Rep. 2013. Jul 22;6221–19. [PubMed] [Google Scholar]
- 28.Duryea E L, McIntire D D, Leveno K J. The rate of preterm birth in the United States is affected by the method of gestational age assignment. Am J Obstet Gynecol. 2015;213(2):2310–2.31E7. doi: 10.1016/j.ajog.2015.04.038. [DOI] [PubMed] [Google Scholar]
- 29.Conway D L, Hansen N I, Dudley D J. et al. An algorithm for the estimation of gestational age at the time of fetal death. Paediatr Perinat Epidemiol. 2013;27(2):145–157. doi: 10.1111/ppe.12037. [DOI] [PMC free article] [PubMed] [Google Scholar]
- 30.Altman D G, Chitty L S. Design and analysis of studies to derive charts of fetal size. Ultrasound Obstet Gynecol. 1993;3(6):378–384. doi: 10.1046/j.1469-0705.1993.03060378.x. [DOI] [PubMed] [Google Scholar]
- 31.Altman D G, Chitty L S. Charts of fetal size: 1. Methodology. Br J Obstet Gynaecol. 1994;101(1):29–34. doi: 10.1111/j.1471-0528.1994.tb13006.x. [DOI] [PubMed] [Google Scholar]
- 32.Royston P, Wright E M. How to construct ‘normal ranges’ for fetal variables. Ultrasound Obstet Gynecol. 1998;11(1):30–38. doi: 10.1046/j.1469-0705.1998.11010030.x. [DOI] [PubMed] [Google Scholar]
- 33.MacDorman M F Kirmeyer S E Wilson E C Fetal and perinatal mortality, United States, 2006 Natl Vital Stat Rep 2012. Aug 28;6081–22. [PubMed] [Google Scholar]
- 34.Yudkin P L, Wood L, Redman C W. Risk of unexplained stillbirth at different gestational ages. Lancet. 1987;1(8543):1192–1194. doi: 10.1016/s0140-6736(87)92154-4. [DOI] [PubMed] [Google Scholar]
- 35.Smith G C, Pell J P, Dobbie R. Caesarean section and risk of unexplained stillbirth in subsequent pregnancy. Lancet. 2003;362(9398):1779–1784. doi: 10.1016/s0140-6736(03)14896-9. [DOI] [PubMed] [Google Scholar]
- 36.K.G. M . Washington, DC: National Academies Press; 1994. Stallard E. Medical Demography: Interaction of Disability Dynamics and Mortality. [Google Scholar]
- 37.Greenland S, Neutra R. Control of confounding in the assessment of medical technology. Int J Epidemiol. 1980;9(4):361–367. doi: 10.1093/ije/9.4.361. [DOI] [PubMed] [Google Scholar]
- 38.Macdorman M F Kirmeyer S The challenge of fetal mortality NCHS data brief 2009(16):1–8. Available at: http://www.cdc.gov/nchs/data/databriefs/db16.pdf Accessed September 15, 2015. [PubMed]
- 39.Altman D G, Bland J M. Missing data. BMJ. 2007;334(7590):424. doi: 10.1136/bmj.38977.682025.2C. [DOI] [PMC free article] [PubMed] [Google Scholar]
- 40.Society for Research in Child Development . Missing data: What to do with or without them. Monogr Soc Res Child Dev. 2006;71(3):42–64. [Google Scholar]
- 41.Morales-Roselló J, Khalil A, Morlando M, Papageorghiou A, Bhide A, Thilaganathan B. Changes in fetal Doppler indices as a marker of failure to reach growth potential at term. Ultrasound Obstet Gynecol. 2014;43(3):303–310. doi: 10.1002/uog.13319. [DOI] [PubMed] [Google Scholar]
- 42.Center for Disease Control and Prevention Birth edit specifications for the 2003 proposed revision of the United States standard certificate of birth Available at: http://www.cdc.gov/nchs/data/dvs/birth_edit_specifications.pdf"> Accessed: September 30, 2015
- 43.Duryea E L, Hawkins J S, McIntire D D, Casey B M, Leveno K J. A revised birth weight reference for the United States. Obstet Gynecol. 2014;124(1):16–22. doi: 10.1097/AOG.0000000000000345. [DOI] [PubMed] [Google Scholar]
- 44.Gardosi J, Madurasinghe V, Williams M, Malik A, Francis A. Maternal and fetal risk factors for stillbirth: population based study. BMJ. 2013;346:f108. doi: 10.1136/bmj.f108. [DOI] [PMC free article] [PubMed] [Google Scholar]
- 45.Edmunds S F, Silver R M. Stillbirth reduction efforts and impact on early births. Clin Perinatol. 2013;40(4):611–628. doi: 10.1016/j.clp.2013.07.002. [DOI] [PubMed] [Google Scholar]
- 46.Stillbirth Collaborative Research Network Writing Group . Causes of death among stillbirths. JAMA. 2011;306(22):2459–2468. doi: 10.1001/jama.2011.1823. [DOI] [PMC free article] [PubMed] [Google Scholar]
- 47.Waldenström U, Cnattingius S, Norman M, Schytt E. Advanced Maternal Age and Stillbirth Risk in Nulliparous and Parous Women. Obstet Gynecol. 2015;126(2):355–362. doi: 10.1097/AOG.0000000000000947. [DOI] [PubMed] [Google Scholar]
- 48.Darmstadt G L, Shiffman J, Lawn J E. Advancing the newborn and stillbirth global agenda: priorities for the next decade. Arch Dis Child. 2015;100 01:S13–S18. doi: 10.1136/archdischild-2013-305557. [DOI] [PubMed] [Google Scholar]