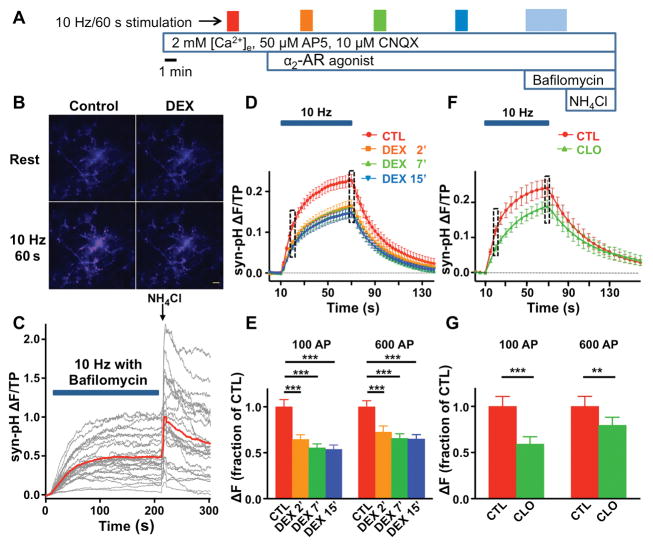
Figure 1. α2-Adrenergic receptor agonists inhibit action potential-evoked synaptic vesicle exocytosis from hippocampal neurons.
A, Schematic diagram of protocol to test the effects of α2-adrenergic receptor (AR) agonists on synaptic vesicle (SV) exocytosis. Filled boxes indicate electrical stimulation at 10 Hz for 60 s (600 action potentials (APs)), followed by 3 cycles of 600 AP stimuli in the presence of the α2-AR agonists 0.1 μM dexmedetomidine (DEX) or 0.5 μM clonidine (CLO) with at least 5 min rest between each stimulation. B, Representative fluorescence images of synaptophysin-pHluorin (syn-pH) expressing boutons at rest (upper panels) and after 600 APs (lower panels) for control (left) and DEX-treated neurons (right). Scale bar, 10 μm. C, Representative traces (gray) and average (red) of syn-pH fluorescence to determine total recycling pool (TRP) size and total pool (TP) obtained from 26 boutons analyzed from a single neuron were stimulated continuously at 10 Hz (bar indicates electrical stimulation) in the presence of 0.5 μM bafilomycin A1 to prevent SV re-acidification. The plateau in fluorescence reflects TRP. Vesicle alkalization with 50 mM NH4Cl revealed the size of the TP. D, Time series of fluorescence changes, shown every 2.5 s, for 600 APs in the absence (Control) or presence of 0.1 μM DEX (following 2, 7, and 15 min drug exposure). Fluorescence intensities were normalized to the subsequent NH4Cl response (TP). Bar indicates electrical stimulation. E, Mean values of peak syn-pH response amplitude at 10 s (100 APs) and 60 s (600 APs) of stimulation (boxed areas in D), normalized to control values for each time point. Data are expressed as mean ± SEM. ***p < 0.001 by one-way repeated measures ANOVA followed by Tukey’s multiple comparison test. F, Time series of fluorescence changes, shown every 5 s, for 600 APs in the absence or presence of 0.5 μM CLO (following 7 min exposure). G, Mean values of peak syn-pH response amplitude at 10 s (100 AP) and 60 s (600 AP) of stimulation (boxed areas in F), normalized to control values for each time point. Data are expressed as mean ± SEM. **p < 0.01, ***p < 0.001 compared to respective control by two-tailed paired t-test.

