

Abstract
Primary objective
To determine test-retest reliabilities of novel Evoked Response Potential (ERP)-based Brain Network Activation (BNA) scores in healthy athletes.
Research design
Observational, repeated-measures study.
Methods and design
Forty-two healthy male and female high school and collegiate athletes completed auditory oddball and go/no-go ERP assessments at baseline, 1 week, 6 weeks, and 1 year. The BNA algorithm was applied to the ERP data, considering electrode location, frequency band, peak latency, and normalized amplitude, to generate 7 unique BNA scores for each testing session.
Main outcomes and results
Mean BNA scores, intraclass correlation coefficient (ICC) values, and reliable change (RC) values were calculated for each of the 7 BNA networks. BNA scores ranged from 46.3±34.9 to 69.9±22.8, ICC values ranged from 0.46 to 0.65, and 95% RC values ranged from 38.3 to 68.1 across the 7 networks.
Conclusions
The wide range of BNA scores observed in this population of healthy athletes suggests that a single BNA score or set of BNA scores from a single after-injury test session may be difficult to interpret in isolation without knowledge of the athlete’s own baseline BNA score(s) and/or the results of serial tests performed at additional time points. The stability of each BNA network should be considered when interpreting test-retest BNA score changes.
Keywords: Athlete, Brain network activation, Concussion, Electroencephalography, Event-related potential, Reliability
INTRODUCTION
Despite its ubiquity in athletic training rooms and sports medicine clinics, concussion is often a challenging injury to diagnose and manage. This challenge is largely because the gold standard diagnostic “test” for concussion remains the clinical impression of the medical provider. While useful in combination, none of the symptoms, signs, or objective clinical tests currently available to sports medicine professionals offer sufficient sensitivity or specificity in isolation. Furthermore, all clinical tools assess the secondary manifestations of concussion, rather than the underlying “complex pathophysiological process affecting the brain, induced by biomechanical forces.”1 Many promising lines of research investigating potential biomarkers more directly assessing the primary pathophysiological processes underlying concussion are underway, but no objective biomarker has been sufficiently validated for routine clinical use.
Event-related potential (ERP) analysis is an electrophysiological assessment technique that has shown promise as a potential concussion biomarker.2–4 ERPs are derived from electroencephalographic (EEG) data collected while a subject performs a repetitive stereotyped cognitive task. The resulting EEG signal is time-locked to stimulus onset and averaged over trials to improve the signal-to-noise ratio of the response. The ERP signal thus reflects the brain’s characteristic electrophysiological response during cognitive processing of the stimulus. The characteristics of an ERP depend on the type of stimulus presented (e.g., visual vs. auditory), the cognitive task performed (e.g., depress a button vs. inhibit a motor response), and the electrophysiological integrity of the subject’s cerebral function.5 As such, ERPs represent a potential method for assessing electrophysiological disruption following concussion.
While recorded individually at various EEG electrode sites, ERPs are thought to reflect the summed electrical activity of neurons in multiple cortical and subcortical areas of the brain.6 This is conceptually attractive when considering that concussion is widely accepted as a diffuse “network” injury affecting brain function, as opposed to a localizable structural injury. A novel algorithm for analyzing ERP signals, referred to as Brain Network Activation (BNA) analysis, has the potential to further capitalize on the concept of diffuse cerebral network assessment in concussion. This technique considers the EEG frequency band, latency, and amplitude of ERP data recorded across multiple electrode locations to yield individual BNA scores for various BNA networks associated with a given ERP task and stimulus. Prior research investigating the BNA technique has found it to yield repeatable results in healthy subjects.7 In addition, BNA scores have been shown to distinguish adult subjects with ADHD from controls,8 and to vary with the expected pharmacological effects of medication administration.9,10 To date, only one study has assessed BNA scores in athletes with concussion. In this study, concussed athletes exhibiting post-traumatic migraine symptoms had significantly lower BNA scores 3–4 weeks post-injury than concussed subjects without post-traumatic migraine symptoms or healthy controls.11
Given that most concussion assessment programs utilize direct comparison of pre-season baseline and after-injury measurements, we sought to determine the stability of BNA scores over time in a population of healthy, non-collision sport athletes. We chose to exclude collision sport athletes to avoid possible confounding in the event that routine sport-associated head trauma might affect BNA scores, as has been reported for functional and diffusion tensor MRI studies.12–18 Therefore, the purpose of this study was to measure the test-retest reliability of BNA scores associated with auditory oddball and auditory go/no-go ERP tasks in a population of healthy high school and collegiate athletes.
METHODS
Participants
Forty-two healthy, right-handed athletes (15 males; 18.3±2.7 years) competing in non-collision sports at the high school (n=22) and collegiate levels (n=20) participated in this study. Potential participants were excluded if they had sustained a concussion in the previous 6 months, had any history of moderate or severe traumatic brain injury (Glasgow Coma Scale < 13), epilepsy/seizures, migraine headaches, intracranial surgery, intracranial abnormality on prior brain imaging, psychiatric or neuropsychological disorder, learning disability, deafness, blindness, were taking any centrally-acting medications, or had an open scalp laceration, active head lice infection, baldness, or hair style that precluded successful placement of an EEG net. Participants completed 4 identical EEG assessments using the novel ERP analysis technique to quantify BNA patterns (ElMindA, Ltd., Herzliya, Israel) at baseline, 1 week, 6 weeks, and 1 year. This study was approved by the University of Michigan’s institutional review board. All participants provided informed written consent.
ERP tasks
The ERP testing protocol utilized auditory oddball and auditory go/no-go tasks. During both tasks, participants pressed a button with their right index finger as quickly and accurately as possible in response to a randomly-ordered series of auditory stimuli presented binaurally through a headset at a volume of 70 dB. Only correct responses were analyzed.
During the auditory oddball task one of three 120 ms stimuli was randomly presented every ~1.5 seconds. Participants were instructed to press the button in response to a 1,000 Hz target tone (10% of trials) and to withhold a response when presented with a 2,000 Hz frequent tone (80% of trials). In addition various novel stimuli (e.gs, white noise, telephone ring, dog bark) were randomly presented during 10% of trials. After a brief practice set, the auditory oddball task included two 8-minute blocks of 300 trials separated by a 1-minute rest break.
During the auditory go/no-go task, either a 40 ms 2,000 Hz target or 40 ms 1,000 Hz non-target tone was randomly presented every ~1.5 sec. Participants were instructed to press the button in response to target tones, the “go” condition (80% of trials), and to inhibit a response to non-target tones, the “no-go” condition (20% of trials). After a brief practice set, the auditory go/no-go task included three 7-minute blocks of 200 trials separated by 1-minute rest breaks.
EEG data acquisition
Standard high density EEG was recorded using a 256-lead HydroCel Geodesic Sensor Net with a Net Amps 300 amplifier (Electrical Geodesics, Inc., Eugene, OR). During the ERP tasks, participants were instructed to fix their gaze on a point displayed in the center of a computer monitor at 70 cm and to minimize eye movements, blinking, and body movements. Event-related potentials were triggered by the test presentation script with epochs defined from 200 ms before to 1,200 ms after stimulus presentation. Sampling occurred at 256 Hz and bandpass filtering was performed at 0.1–100 Hz. All EEG data were saved using randomly-generated session identifier codes to permit blind BNA analysis.
BNA analysis
The BNA algorithm is explained in detail elsewhere.7–10 Briefly, the averaged ERP data associated each stimulus type and ERP task are separately assessed. After pre-processing the raw ERP data to remove artifacts, the algorithm band-pass filters each averaged ERP waveform, breaking it down into overlapping delta (1–4 Hz), theta (3–8 Hz), alpha (7–13 Hz), low beta (12–18 Hz), beta (17–23 Hz), and high beta (22–30 Hz) frequency bands, and coding the latency and normalized amplitude of each maximum and minimum peak.
The algorithm considers information encoding the scalp electrode location, frequency band, latency, and normalized amplitude of the averaged ERP data for each stimulus type-ERP task condition.
During an initial training stage of analysis performed by ElMindA prior to this study, ERP data were collected in a reference group of 53 subjects with concussion and 77 healthy control subjects to define those BNA patterns that were most similar among healthy athletes, and best able to discriminate between healthy athletes and athletes with concussion. The analysis yielded two candidate BNA networks associated with the auditory oddball frequent and target stimuli (OB-F1, OB-F2, OB-T1, OB-T2), and one candidate network associated with the auditory oddball novel (OB-N), auditory go/no-go “go” (GNG-G), and auditory oddball go/no-go “no-go” (GNG-N) stimuli.
Upon completion of each testing session, the coded raw EEG/ERP data were securely sent to ElMindA for a second, individual-level stage of blinded BNA analysis comparing the ERP data collected in each individual participant to the reference BNA patterns for each of the 7 networks derived from the reference population. Each subject was assigned a BNA score for each network ranging from 0–100, which can be interpreted as the percent similarity between the individual subject’s BNA pattern and the reference BNA pattern from the training stage of analysis. A single data quality (DQ) value for each BNA score, reflecting the within-subject variability of the raw EEG data, was also assigned.
Statistical Analysis
Statistical analyses were performed using the statistical software package, R (Version 3.0.2, The R Foundation, Vienna, Austria). We visually inspected the score distribution for each BNA network and calculated descriptive statistics to characterize each distribution.
One-way ANOVA compared mean BNA scores between the 4 testing sessions and t-tests compared BNA scores between sexes and age groups.
We assessed the stability of each BNA network across all 4 testing sessions using intraclass correlation coefficients (ICCs). ICCs were also calculated separately for males vs. females and high school vs. collegiate athletes, and compared between the subgroups using a conservative overlapping confidence interval approach. We also generated Bland-Altman plots of between-session BNA score differences vs. average BNA scores over both sessions for each BNA network.19
To investigate the potential influence of DQ on BNA scores, we re-calculated mean BNA scores and ICCs for each network after excluding those BNA scores with DQ values exceeding ElMindA’s suggested thresholds. We also plotted the absolute change in BNA score between the first and each subsequent testing session vs. the average DQ value of the two sessions across all 7 BNA networks and calculated the associated Pearson Correlation Coefficients.
Lastly, we performed reliable change (RC) calculations for each BNA network between the first two testing sessions over a range of confidence levels from 60–95%.20 Because some BNA networks had large mean differences between Sessions 1 and 2, mean difference values are also reported.
RESULTS
Thirty-two participants completed all 4 testing sessions; 6, 2, and 2 participants completed 3, 2, and 1 testing sessions, respectively. Reasons for protocol non-completion included ineligibility due to a new concussion (n=1), voluntary withdrawal (n=3), and non-response after at least 3 contact attempts (n=6).
Mean BNA scores across all testing sessions were similar between the 7 BNA networks (p=0.815). (Table 1) There was an overall difference in mean BNA scores across testing sessions for the OB-F1 (p=0.050), OB-F2 (p=0.010), and OB-T1 (p<0.001) networks, with changes present between session 1 and each subsequent session. (Figure 1) There was a sex-based difference in BNA scores for the OB-F1, OB-F2, GNG-G, and GNG-N networks and an age-group-based difference in BNA scores for the OB-N, OB-F1, OB-F2, OB-T2, and GNG-G networks (Table 1).
Table 1.
Mean BNA scores across all testing sessions for each BNA network.
| BNA Network | All Data | DQ Exceeding Threshold Excluded | Males | Females | High School | Collegiate |
|---|---|---|---|---|---|---|
| OB-F1 | 69.9 | 70.4 | 79.9 | 64.7* | 65.8 | 75.0* |
| OB-F2 | 65.6 | 66.1 | 73.7 | 61.4* | 61.7 | 70.6* |
| OB-T1 | 46.3 | 47.7* | 39.9 | 49.6 | 47.4 | 44.8 |
| OB-T2 | 58.1 | 58.8 | 60.9 | 56.7 | 52.6 | 65.1* |
| OB-N | 69.1 | 69.6 | 67.2 | 70.0 | 66.2 | 72.7* |
| GNG-G | 52.0 | 52.0 | 60.8 | 47.5* | 56.2 | 46.8* |
| GNG-N | 55.2 | 55.6 | 69.2 | 47.9* | 51.4 | 60.0 |
= significant difference at p < 0.05 for all data vs. non-DQ-threshold exceeding data, male vs. female, and high school vs. college age group comparisons.
Figure 1.

Distribution of BNA scores at each time point for the 7 BNA networks. S1–S4 = Session 1- Session 4. Horizontal lines = median values; Squares = mean values; Boxes = Inter-quartile ranges; Whiskers = 1.5 x inter-quartile ranges; Diamonds = outlier values. * = between session differences compared to S1 (p < 0.05).
Overall, the most stable BNA network was the GNG-G network (ICC=0.65) and the least stable was the OB-T1 network (ICC=0.46) (Table 2). BNA network stability values were similar between the age groups, and varied by sex only for the GNG-N network (Table 2). The stability of each BNA network at the individual participant level is illustrated in Figure 2. Bland-Altman analyses demonstrated variable patterns between the 7 BNA networks, but did not demonstrate any overall trend in between-session variability over the range of BNA scores (Figure 3). Reliable change calculations demonstrated that the OB-N network had the smallest RC cut-off value and the OB-T1 network had the largest (Table 3).
Table 2.
Intraclass correlation coefficient values across all testing sessions for each BNA network.
| BNA Network | All Data | DQ Exceeding Threshold Excluded | Males | Females | High School | Collegiate |
|---|---|---|---|---|---|---|
| OB-F1 | 0.55 | 0.57 | 0.25 | 0.59 | 0.54 | 0.65 |
| OB-F2 | 0.57 | 0.58 | 0.35 | 0.63 | 0.61 | 0.53 |
| OB-T1 | 0.46 | 0.46 | 0.45 | 0.46 | 0.56 | 0.35 |
| OB-T2 | 0.56 | 0.56 | 0.67 | 0.48 | 0.52 | 0.56 |
| OB-N | 0.49 | 0.48 | 0.62 | 0.41 | 0.45 | 0.54 |
| GNG-G | 0.65 | 0.67 | 0.46 | 0.69 | 0.70 | 0.56 |
| GNG-N | 0.62 | 0.63 | 0.13 | 0.75* | 0.70 | 0.48 |
= significant difference at p < .05 for male vs. female comparison.
Figure 2.

Participant-level between-session BNA change scores for each BNA network. Individual participants are represented by vertical lines, and are organized by sex and age group: HM = high school males; HF = high school females; CM = collegiate males; CF = collegiate females; S1–S4 = Session 1- Session 4.
Figure 3.
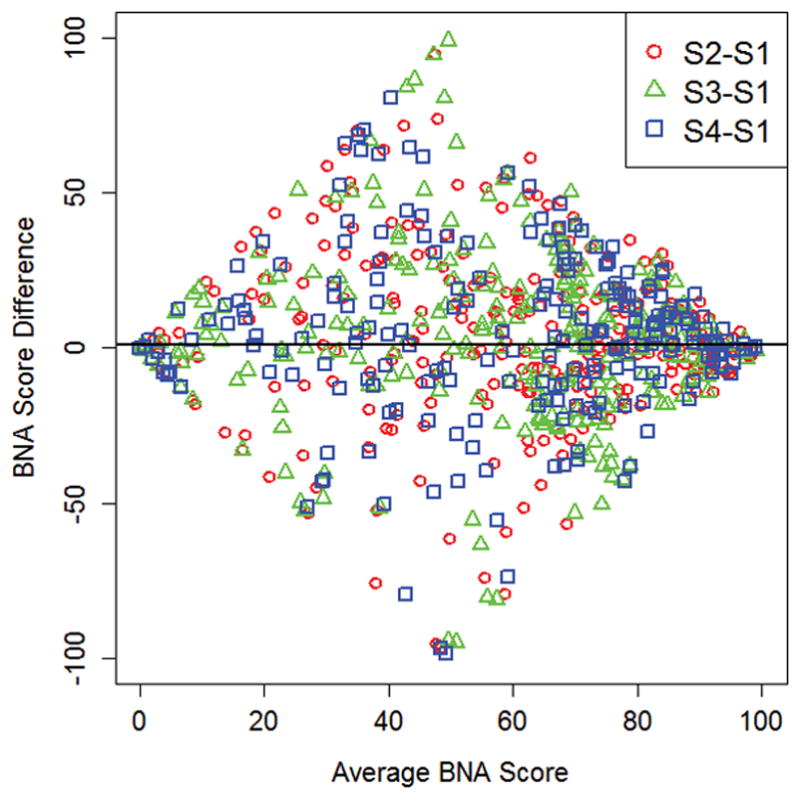
Bland-Altman plots of between-session BNA score differences vs. average BNA scores for all 7 BNA networks. S1-S4 = Session 1- Session 4.
Table 3.
Mean session 1–2 differences and reliable change cut-off values for each BNA network. Negative mean difference values represent lower session 2 scores.
| BNA Network | Mean Difference | 95% Confidence Level | 90% Confidence Level | 80% Confidence Level | 60% Confidence Level |
|---|---|---|---|---|---|
| OB-F1 | 10.5 | ±45.4 | ±38.1 | ±29.7 | ±19.5 |
| OB-F2 | 9.5 | ±44.0 | ±36.9 | ±28.8 | ±18.9 |
| OB-T1 | −17.1 | ±68.1 | ±57.2 | ±44.5 | ±29.2 |
| OB-T2 | 6.0 | ±39.5 | ±33.1 | ±25.8 | ±17.0 |
| OB-N | 3.8 | ±38.3 | ±32.1 | ±25.0 | ±16.4 |
| GNG-G | 7.8 | ±40.0 | ±33.6 | ±26.2 | ±17.2 |
| GNG-N | 7.3 | ±66.9 | ±56.1 | ±43.7 | ±28.7 |
Exclusion of BNA scores with threshold-exceeding DQ values resulted in little overall change in mean BNA scores and ICCs for the BNA networks (Tables 1 and 2). Changes reached statistical significance only for the OB-T1 BNA network (p = 0.022). Analyzing DQ value as a continuous variable, there was a weak relationship across all 7 BNA networks between absolute BNA score changes and average DQ values (r=0.12, p=0.03, Sessions 1–2; r=0.12, p=0.04, Sessions 1–3; r=0.06, p=0.36, Sessions 1–4). (Figure 4)
Figure 4.
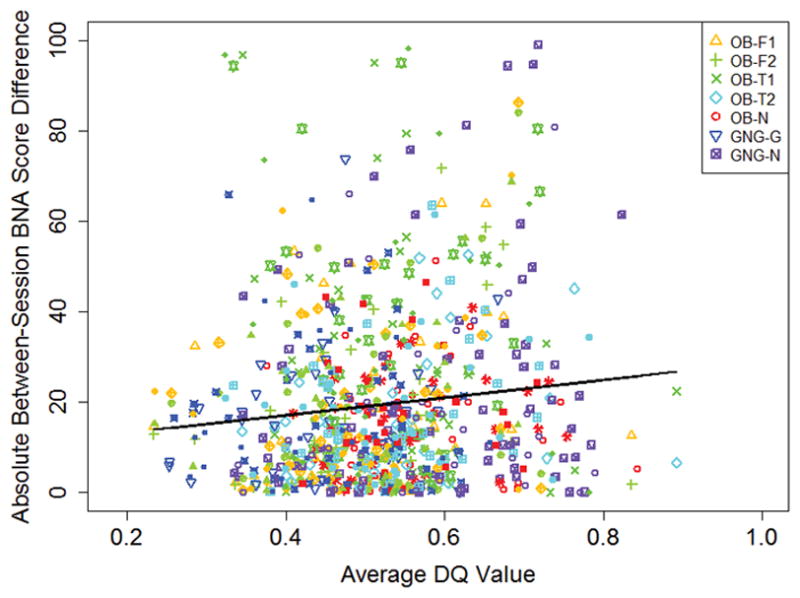
Absolute change in BNA scores between session 1 and each subsequent session vs. average data quality score.
DISCUSSION
In this population of healthy high school and collegiate athletes, BNA scores spanned a wide range of values for all 7 BNA networks. This suggests that BNA scores close to 100, indicating a high degree of similarity to the reference pattern, are not required for an individual’s BNA score to be interpreted as “normal.” As such, the isolated assessment of an athlete’s BNA score at a single time point is likely of less clinical utility than serial reassessments over time. As for many other concussion assessment tools, the ability to compare an athlete’s BNA scores after a suspected concussion to their own baseline scores may improve their interpretation.
This underscores the importance of this study assessing the repeatability of BNA measurements. The range of test-retest reliability values identified between the 7 BNA networks suggests that a uniform interpretation of BNA change scores cannot be applied across networks, but rather network-specific cut-off values must be employed. In addition, some BNA networks demonstrated significant changes between the first and subsequent test sessions (Figure 1), and the magnitude of some age and sex sub-group ICC differences were large (Table 2). These findings suggest that electrophysiological changes occurring with task repetition, as well as age and sex may influence the stability of an athlete’s BNA scores. For example, the ICC values associated with the OB-F1, OB-F2, and OB-T1 BNA networks, which appear to demonstrate a first-visit effect, increase by 0.05–0.06 if re-calculated using only visit 2–4 results. A modified BNA algorithm accounting for test repetition, age, and gender is being developed by ElMindA (ElMindA, Ltd., personal communication), and has the potential to improve BNA network stability.
This study in non-collision sport athletes found lower test-retest reliabilities than were previously reported for 12 BNA networks associated with the auditory oddball task in a larger population of similarly aged healthy subjects.7 The Frequent-Relative Time BNA network reported by Reches et al. is identical to the OB-F2 BNA network from the present study, so direct comparison between the two studies is possible for this network. Reches et al. found ICC values for this network of 0.75 and 0.826 in “database” and “validation” groups, compared to the ICC value of 0.570 in this study. The longer one-year retest interval utilized in the present study, as well as inclusion of more individual time points, may potentially explain this difference. Additional blinded research in a larger athlete population will clarify the stability of each BNA network in athletes.
The BNA score test-retest reliability values reported in this study fall broadly within the wide range of test-retest reliabilities reported for other concussion assessment tools currently in use. The reader is referred to a recently published Institute of Medicine report for a concise summary of test-retest reliabilities from many symptom-, balance-, reaction time-, and cognitive-based concussion assessment tools.21 High reliability is desirable in a clinical test because it leads to greater sensitivity to detect meaningful change. This said, the magnitude of test-retest reliability that is deemed necessary for clinical use varies among authors. Suggested minimum cutoff values for ICC generally range from 0.6 to 0.9.22,23 Using a classification of test-retest reliability of ≥0.90 as very high, 0.80–0.89 as high, 0.70–0.79 as adequate, 0.60–0.69 as marginal, and < 0.60 as low,24,25 the overall reliability values for the OB-F1, OB-F2, OB-T1, OB-T2, and OB-N BNA networks are classified as low in this study, while those for the GNG-G and GNG-N BNA networks are classified as marginal. In addition to considering ICC values, it is also important to consider the reliable change values associated with each BNA network relative to the magnitude of change anticipated to occur following concussion.
There was a weak relationship between test-retest BNA score changes and the quality of the underlying ERP data from which the BNA scores were derived (Figure 4). While this effect was small, efforts to improve data quality may lead to more stable BNA score measurements. The quality of underlying ERP data can be improved by use of meticulous encephalographic recording technique, including accurate scalp electrode placement, minimization of electrical impedance, and maintenance of subject attention throughout the testing session.
It is important to note that, of the 7 BNA networks in this study, only the OB-F2 network is included in commercially-available BNA test offered by ElMindA and is referred to as the “Frequent network” (Figure 5). It is a relative time BNA network based on the latency difference between the N100 and P200 peaks of the ERP waveform associated with the auditory oddball frequent stimulus. It is derived from centrally-located scalp electrodes and predominantly occurs in the 3–8 Hz Theta frequency range. Given its singular inclusion in the current commercially-available test, this network is more clinically relevant than the other 6 BNA networks studied here. The commercially-available test includes two additional BNA networks, referred to as the “Novel” and “Target” networks, which were not available at the time of this study. When unblinded BNA scores are retrospectively generated and analyzed for these networks, ICC values of 0.72 and 0.50, respectively, are obtained.
Figure 5.
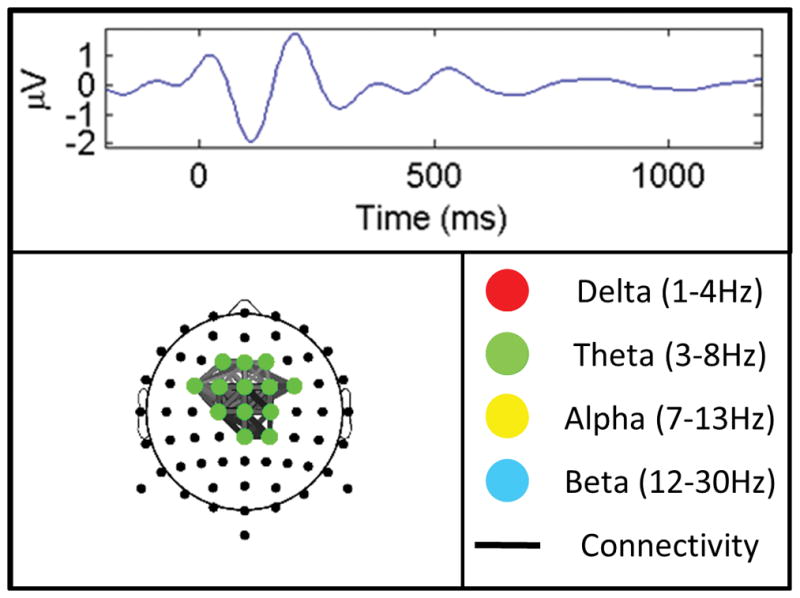
Sample averaged ERP waveform associated for the frequent stimulus of the auditory oddball task illustrating the P100 and N200 peaks from which the OB-F2 biomarker is derived (top). Pictorial illustration of the OB-F2 biomarker demonstrating its central theta predominance (bottom).
This study’s greatest strength is that all BNA analyses were performed with blinding both to subject identity and test session number. Another major strength is that the study population was independent from the reference population from which the BNA networks were derived. These strengths are tempered by the study’s limitations. The strict inclusion/exclusion criteria employed in this study limit its external validity. Additional research is necessary before these results can be generalized to broader athlete populations. Secondly, 10 participants did not complete the entire study protocol, reducing the sample size, especially at the 1-year follow-up time point. Thirdly, routine clinical testing in athletes may employ different equipment than the 264 channel EEG nets used in this study. A final limitation of this study is that only one of the three BNA networks included in the current FDA-approved, commercially available BNA test was available at the time of data collection.
CONCLUSION
BNA scores occur over a wide range of values in healthy athletes, so comparative test-retest BNA score changes are likely to inform clinical management more than isolated after-injury values. Interpretation of BNA score changes should use network-specific RC thresholds, and may also need to account for session effects, as well as an athlete’s age and sex. Additional research is necessary to determine the effect of concussion on an individual’s BNA score. The ultimate clinical value of BNA analysis will depend on the relative magnitude of BNA score changes associated with concussion and recovery with respect to the intrinsic test-retest variability of BNA measurements.
Acknowledgments
The authors would like to thank Dr. Jeffrey Kutcher for his contributions to this project. We would like to thank Mr. Max Zeiger and Ms. Samantha Zetlin for their assistance with data collection. We would also like to thank ElMindA, LTD., for its assistance with BNA score management and interpretation as well as its explanation of the BNA algorithm.
Footnotes
DECLARATION OF INTEREST STATEMENT: This research was funded by ElMindA, LTD. Dr. Eckner’s effort on this project was partially supported by career development awards from the Rehabilitation Medicine Scientist Training Program (5 K12 HD001097) and the National Institutes of Health (1 K23 HD078502).
Dr. Eckner has received research support from ElMindA, LTD. His active research funding includes the National Institutes of Health (1 K23 HD078502), the National Collegiate Athletics Association, the United States Department of Defense (14132004), the University of Michigan Injury Center, and the Foundation for Physical Medicine and Rehabilitation. Ms. Rettmann has received research support from ElMindA, LTD. Mr. Greer has received research support from ElMindA, LTD. Mr. Moore has received research support from ElMindA, LTD. Ms. Brimacombe has received research support from ElMindA, LTD. Dr. He has received research support from ElMindA, LTD. Dr. Broglio has received research support from ElMindA, LTD. His active research funding includes the National Institutes of Health (1R15NS081691-01, 3R15NS081691-01S1), the National Collegiate Athletic Association, the United States Department of Defense (14132004), and the University of Michigan Injury Center. Mr. Narisetty reports no declarations of interest.
References
- 1.McCrory P, Meeuwisse WH, Aubry M, Cantu B, Dvorak J, Echemendia RJ, Engebretsen L, Johnston K, Kutcher JS, Raftery M, et al. Consensus statement on concussion in sport: the 4th International Conference on Concussion in Sport held in Zurich, November 2012. British Journal of Sports Medicine. 2013;47(5):250–258. doi: 10.1136/bjsports-2013-092313. [DOI] [PubMed] [Google Scholar]
- 2.Gosselin N, Theriault M, Leclerc S, Montplaisir J, Lassonde M. Neurophysiological anomalies in symptomatic and asymptomatic concussed athletes. Neurosurgery. 2006;58(6):1151–61. doi: 10.1227/01.NEU.0000215953.44097.FA. discussion 1151–61. [DOI] [PubMed] [Google Scholar]
- 3.Dupuis F, Johnston K, Lavoie M, Lepore F, Lassonde M. Concussions in athletes produce brain dysfunction as revealed by event-related potentials. Neuroreport. 2000;11(18):4087–4092. doi: 10.1097/00001756-200012180-00035. [DOI] [PubMed] [Google Scholar]
- 4.Baillargeon A, Lassonde M, Leclerc S, Ellemberg D. Neuropsychological and neurophysiological assessment of sport concussion in children, adolescents and adults. Brain Inj. 2012;26(3):211–20. doi: 10.3109/02699052.2012.654590. [DOI] [PubMed] [Google Scholar]
- 5.Gosselin N, Saluja RS, Chen JK, Bottari C, Johnston K, Ptito A. Brain functions after sports-related concussion: insights from event-related potentials and functional MRI. Phys Sportsmed. 2010;38(3):27–37. doi: 10.3810/psm.2010.10.1805. [DOI] [PubMed] [Google Scholar]
- 6.Gaetz M, Bernstein DM. The current status of electrophysiologic procedures for the assessment of mild traumatic brain injury. J Head Trauma Rehabil. 2001;16(4):386–405. doi: 10.1097/00001199-200108000-00008. [DOI] [PubMed] [Google Scholar]
- 7.Reches A, Kaerem D, Gal N, Laufer I, Shani-Herskovitch R, Dickman D, Geva AB. A novel ERP pattern analysis method for revealing invariant reference brain network models. Funct Neurol Rehabil Ergon. 2013;3(2–3):295–317. [Google Scholar]
- 8.Shahaf G, Reches A, Pinchuk N, Fisher T, Ben Bashat G, Kanter A, Tauber I, Kerem D, Laufer I, Aharon-Peretz J, et al. Introducing a novel approach of network oriented analysis of ERPs, demonstrated on adult attention deficit hyperactivity disorder. Clin Neurophysiol. 2012;123(8):1568–80. doi: 10.1016/j.clinph.2011.12.010. [DOI] [PubMed] [Google Scholar]
- 9.Reches A, Laufer I, Ziv K, Cukierman G, McEvoy K, Ettinger M, Knight RT, Gazzaley A, Geva AB. Network dynamics predict improvement in working memory performance following donepezil administration in healthy young adults. Neuroimage. 2013;88C:228–241. doi: 10.1016/j.neuroimage.2013.11.020. [DOI] [PMC free article] [PubMed] [Google Scholar]
- 10.Reches A, Levy-Cooperman N, Laufer I, Shani-Hershkovitch R, Ziv K, Kerem D, Gal N, Stern Y, Cukierman G, Romach MK, et al. Brain Network Activation (BNA) reveals scopolamine-induced impairment of visual working memory. J Mol Neurosci. 2014;54(1):59–70. doi: 10.1007/s12031-014-0250-6. [DOI] [PubMed] [Google Scholar]
- 11.Kontos AP, Reches A, Elbin RJ, Dickman D, Laufer I, Geva AB, Shacham G, DeWolf R, Collins MW. Preliminary evidence of reduced brain network activation in patients with post-traumatic migraine following concussion. Brain Imaging Behav. 2015 doi: 10.1007/s11682-015-9412-6. [DOI] [PMC free article] [PubMed] [Google Scholar]
- 12.Bazarian JJ, Zhu T, Blyth B, Borrino A, Zhong J. Subject-specific changes in brain white matter on diffusion tensor imaging after sports-related concussion. Magn Reson Imaging. 2012;30(2):171–80. doi: 10.1016/j.mri.2011.10.001. [DOI] [PMC free article] [PubMed] [Google Scholar]
- 13.Bazarian JJ, Zhu T, Zhong J, Janigro D, Rozen E, Roberts A, Javien H, Merchant-Borna K, Abar B, Blackman EG. Persistent, long-term cerebral white matter changes after sports-related repetitive head impacts. PLoS One. 2014;9(4):e94734. doi: 10.1371/journal.pone.0094734. [DOI] [PMC free article] [PubMed] [Google Scholar]
- 14.Breedlove EL, Robinson M, Talavage TM, Morigaki KE, Yoruk U, O'Keefe K, King J, Leverenz LJ, Gilger JW, Nauman EA. Biomechanical correlates of symptomatic and asymptomatic neurophysiological impairment in high school football. J Biomech. 2012;45(7):1265–72. doi: 10.1016/j.jbiomech.2012.01.034. [DOI] [PubMed] [Google Scholar]
- 15.Davenport EM, Whitlow CT, Urban JE, Espeland MA, Jung Y, Rosenbaum DA, Gioia GA, Powers AK, Stitzel JD, Maldjian JA. Abnormal white matter integrity related to head impact exposure in a season of high school varsity football. J Neurotrauma. 2014;31(19):1617–24. doi: 10.1089/neu.2013.3233. [DOI] [PMC free article] [PubMed] [Google Scholar]
- 16.Koerte IK, Ertl-Wagner B, Reiser M, Zafonte R, Shenton ME. White matter integrity in the brains of professional soccer players without a symptomatic concussion. JAMA. 2012;308(18):1859–61. doi: 10.1001/jama.2012.13735. [DOI] [PMC free article] [PubMed] [Google Scholar]
- 17.McAllister TW, Ford JC, Flashman LA, Maerlender A, Greenwald RM, Beckwith JG, Bolander RP, Tosteson TD, Turco JH, Raman R, et al. Effect of head impacts on diffusivity measures in a cohort of collegiate contact sport athletes. Neurology. 2014;82(1):63–9. doi: 10.1212/01.wnl.0000438220.16190.42. [DOI] [PMC free article] [PubMed] [Google Scholar]
- 18.Talavage TM, Nauman E, Breedlove EL, Yoruk U, Dye AE, Morigaki K, Feuer H, Leverenz LJ. Functionally-Detected Cognitive Impairment in High School Football Players Without Clinically-Diagnosed Concussion. J Neurotrauma. 2010 doi: 10.1089/neu.2010.1512. [DOI] [PMC free article] [PubMed] [Google Scholar]
- 19.Bland JM, Altman DG. Statistical methods for assessing agreement between two methods of clinical measurement. Lancet. 1986;1(8476):307–10. [PubMed] [Google Scholar]
- 20.Jacobson NS, Truax P. Clinical significance: a statistical approach to defining meaningful change in psychotherapy research. J Consult Clin Psychol. 1991;59(1):12–9. doi: 10.1037//0022-006x.59.1.12. [DOI] [PubMed] [Google Scholar]
- 21.Institute_of_Medicine. Sports-related concussions in youth: Improving the science, changing the culture. Washington, D.C: The National Academies Press; 2014. [PubMed] [Google Scholar]
- 22.Anastasi A. Psychological Testing. 6. New York, NY: Macmillan; 1998. [Google Scholar]
- 23.Randolph C, McCrea M, Barr WB. Is neuropsychological testing useful in the management of sport-related concussion? J Athl Train. 2005;40(3):139–52. [PMC free article] [PubMed] [Google Scholar]
- 24.Lezak MD, Howleson DB, Bigler ED, Tranel D. Neuropsychological Assessment. New York, NY: Oxford University Press; 2012. [Google Scholar]
- 25.Cole WR, Arrieux JP, Schwab K, Ivins BJ, Qashu FM, Lewis SC. Test-retest reliability of four computerized neurocognitive assessment tools in an active duty military population. Arch Clin Neuropsychol. 2013;28(7):732–42. doi: 10.1093/arclin/act040. [DOI] [PubMed] [Google Scholar]