Summary
The mechanistic Target of Rapamycin Complex 1 (mTORC1) is a major regulator of eukaryotic growth that coordinates anabolic and catabolic cellular processes with inputs such as growth factors and nutrients, including amino acids1–3. In mammals, arginine is particularly important and promotes diverse physiological effects including immune cell activation, insulin secretion, and muscle growth, largely through activation of mTORC14–7. Arginine activates mTORC1 upstream of the Rag GTPases8, through either the lysosomal amino acid transporter SLC38A9 or the GATOR2-interacting CASTOR1 (Cellular Arginine Sensor for mTORC1)9–12. However, the mechanism by which the mTORC1 pathway detects and transmits the arginine signal has been elusive. Here, we present the 1.8 Å crystal structure of arginine-bound CASTOR1. Homodimeric CASTOR1 binds arginine at the interface of two ACT domains, enabling allosteric control of the adjacent GATOR2-binding site to trigger dissociation from GATOR2 and the downstream activation of mTORC1. Our data reveal that CASTOR1 shares substantial structural homology with the lysine-binding regulatory domain of prokaryotic aspartate kinases, suggesting that the mTORC1 pathway exploited an ancient amino-acid-dependent allosteric mechanism to acquire arginine sensitivity. Together, these results establish a structural basis for arginine sensing by the mTORC1 pathway and provide insights into the evolution of a mammalian nutrient sensor.
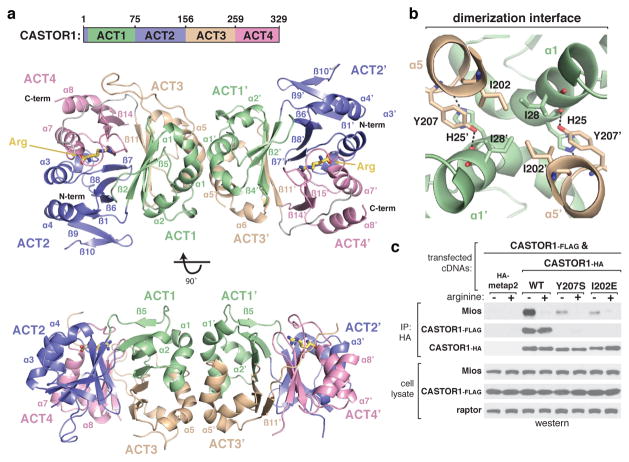
To understand the molecular mechanisms through which CASTOR1 detects arginine and signals its presence to mTORC1, we determined the crystal structure of arginine-bound CASTOR1 to 1.8 Å resolution (Extended Data Table 1). CASTOR1 forms a rod-shaped homodimer, with the monomers associated in a side-by-side manner and rotated 180° with respect to each other (Fig. 1a). While sequence analysis of CASTOR1 predicted the presence of two ACT (Aspartate Kinase, Chorismate mutase, TyrA) domains12,13, the structure reveals that each monomer actually contains four tandem ACT domains. ACT1 displays the canonical βαββαβ ACT domain topology14,15, whereas ACT3 and ACT4 each lack the final β-strand and ACT2 contains two additional β-strands (Fig. 1a, Extended Data Fig. 1a).
Figure 1. Architecture of human CASTOR1.
a, Two orthogonal views of the CASTOR1 homodimer (ribbon diagram), with ACT-domains 1–4 colored in green, purple, wheat, and pink, respectively. The bound arginine is shown in yellow. Disordered regions not observed in the crystal structure are omitted. b, View of the CASTOR1 dimerization interface, with side chains of key residues represented in stick form. c, Dimerization deficient CASTOR1 Y207S and I202E mutants display weaker interactions with endogenous GATOR2. HEK-293T cells transiently expressing FLAG-tagged CASTOR1 wild type (WT) and the indicated HA-tagged constructs were starved of arginine for 50 min and, where indicated, restimulated for 10 min. HA-immunoprecipitates were generated from cell lysates and analyzed by immunoblotting for the indicated proteins. Mios was used as a representative GATOR2 component.
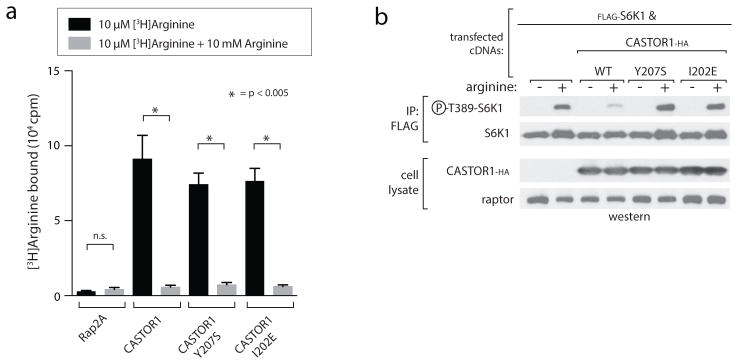
The dimerization interface buries ~950 Å2 of surface area at the intersection of α1 and α5, from ACT1 and ACT3, respectively (Fig. 1b). Four inward facing isoleucines (Ile28 and Ile202) form the hydrophobic core of the symmetrical interface, flanked on each side by tyrosine-histidine pairs (His25 and Tyr207) that form both pi-stacking and hydrogen-bond contacts with the opposing monomer (Fig. 1b). To understand the importance of dimerization for CASTOR1 function, we generated constitutively monomeric mutants of CASTOR1 (Y207S and I202E, Fig. 1c). Interestingly, although dimerization is dispensable for arginine binding (Extended Data Fig. 2a), these mutants interacted weakly with GATOR2 and failed to inhibit mTORC1 signalling in cells (Fig. 1c, Extended Data Fig. 2b), indicating that CASTOR1 must be dimeric to robustly inhibit GATOR2 upon arginine starvation.
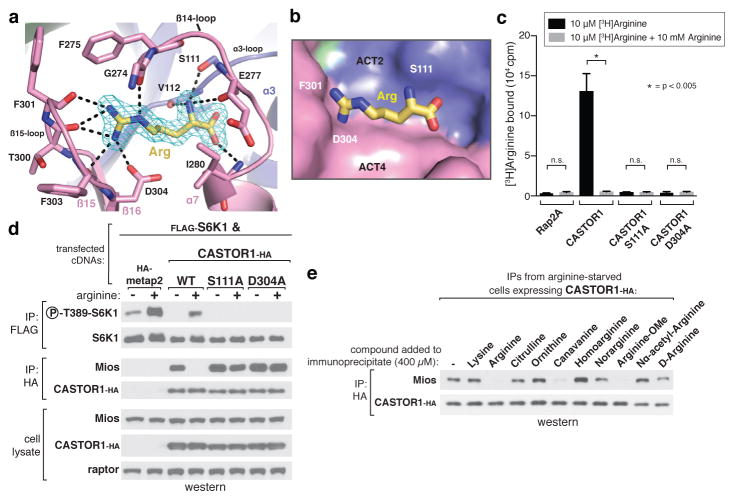
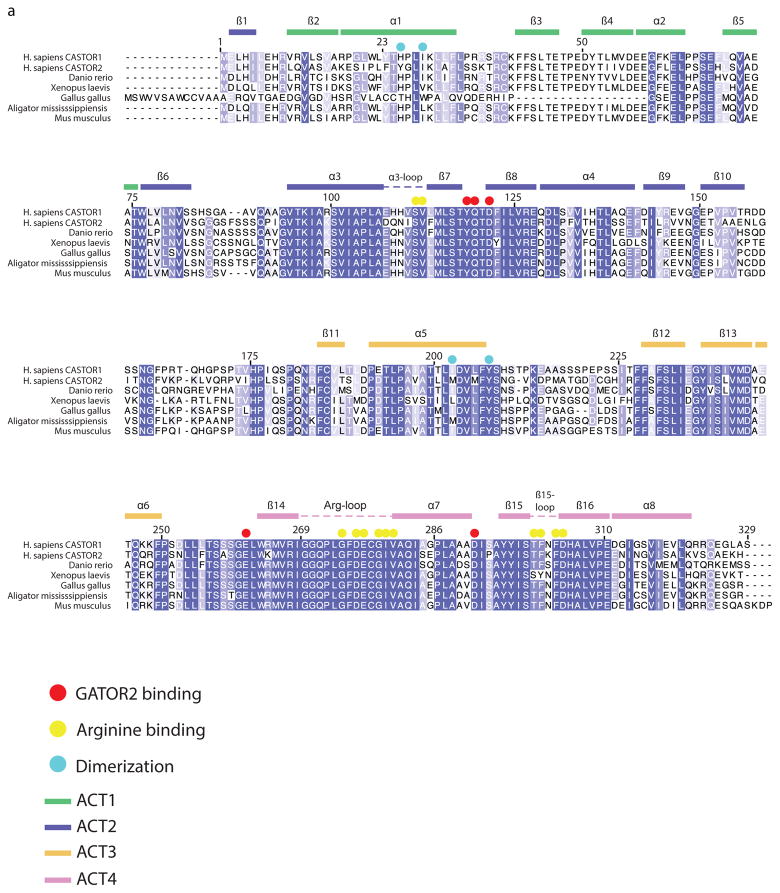
CASTOR1 binds arginine through a narrow pocket at the interface of ACT2 and ACT4, distal to the dimerization interface (Fig. 1a, 2a, b). The side-chain of arginine points towards a loop connecting β15 and β16 (β15-loop), where the backbone carbonyls of Thr300, Phe301, and Phe303 coordinate the guanidinium group of arginine (Fig. 2a). Immediately adjacent to the β15-loop, the anionic side-chain of Asp304 forms an additional stabilizing salt-bridge with the cationic arginine side-chain (Fig. 2a). On the opposite side of the pocket, the hydroxyl side-chain of Ser111 and backbone carbonyl of Val112 in the α3-loop anchor the free amine of arginine in place, while the free carboxyl points towards a water-filled cavity that separates it from ACT2 (Fig 2a, b). Consistent with a critical role for these contacts in arginine sensing by CASTOR1, mutation of either Ser111 or Asp304 (S111A, D304A) abolished the arginine binding capacity of CASTOR1 in vitro (Fig. 2c). Furthermore, when expressed in HEK-293T cells, these mutants bound constitutively to GATOR2 and strongly inhibited mTORC1 signalling even in the presence of arginine (Fig. 2D).
Figure 2. The arginine-binding pocket of CASTOR1.
a, View of the arginine-binding pocket in CASTOR1, together with its Fo-Fc electron density map calculated and contoured at 4σ from an omit map lacking arginine. The bound arginine is shown in yellow. Hydrogen bonds or salt-bridges are shown as black dashed lines. Residues 269–273 are omitted for clarity. b, Steric view of the arginine-binding pocket, depicting the surface representation of CASTOR1 and stick model of arginine (yellow). The β14-loop (residues 269–280) is omitted for clarity. c, CASTOR1 S111A and D304A mutants do not bind arginine in vitro. FLAG-immunoprecipitates prepared from HEK-293T cells transiently expressing indicated FLAG-tagged proteins were used in binding assays with [3H]Arginine as described in the methods. Values are Mean ± SD for 3 technical replicates from one representative experiment. d, The CASTOR1 S111A and D304A mutants constitutively bind GATOR2 and inhibit mTORC1 signaling in cells. HEK-293T cells transiently expressing FLAG-S6K1 and the indicated HA-tagged constructs were starved of arginine for 50 min and, where indicated, restimulated for 10 min. Both FLAG- and HA-immunoprecipitates were prepared from lysates and analyzed as in 1c. e, Effects of various arginine analogues on the CASTOR1-GATOR2 interaction in vitro. HEK-293T cells transiently expressing HA-CASTOR1 WT were starved of arginine for 50 min. HA-immunoprecipitates were prepared from cell lysates then incubated with 400 μM of the indicated compounds for 20 min and analyzed as in 1c.
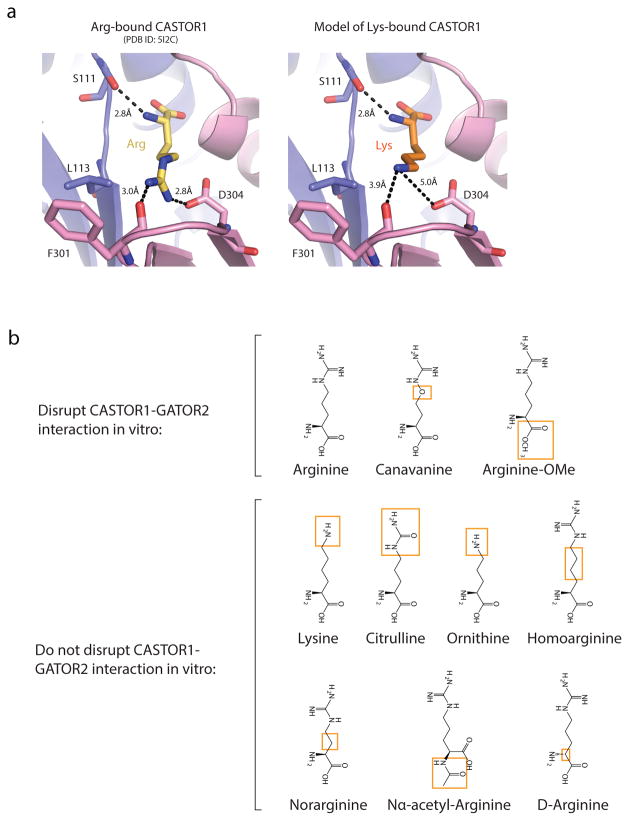
Together, these data explain the molecular determinants of specificity in the CASTOR1-arginine interaction. While Ser111 fixes the position of the free amine, the location of the β15-loop and Asp304 sets a strict length requirement for the bound ligand (Extended Data Fig. 3a). In addition, the positions of the three hydrogen-bond donating nitrogens in the guanidinium group facilitate contacts with both the carbonyl oxygens in the β15-loop and the side-chain of Asp304 (Fig. 2a). Finally, the gap behind the free carboxyl group of arginine suggests that CASTOR1 can tolerate ligands with modifications to that functional group (Fig. 2b). We tested these predictions by interrogating the ability of various arginine analogues to disrupt the CASTOR1-GATOR2 interaction in vitro (Fig. 2e, Extended Data Fig. 3b). Consistent with our structural analysis, while the carboxy-modified arginine-methyl ester triggered full dissociation of CASTOR1 from GATOR2, compounds with alterations to the guanidium group, α-amine, or side-chain length had no effect.
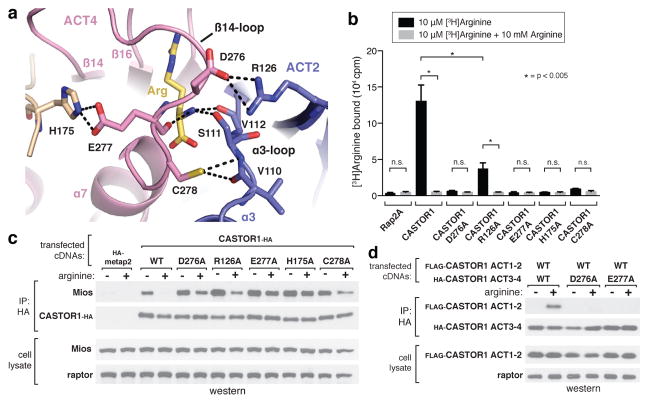
In addition to the main pocket contacts described above, a highly conserved, glycine-rich loop connecting β14 and α7 in ACT4 (“β14-loop”, residues 269–280) wraps over the arginine-pocket, fully burying the bound ligand (Fig. 2a, 3a, Extended Data Fig. 1a). The β14-loop forms several hydrogen-bonds with arginine through the backbone amides of Gly279 and Ile280, as well as the backbone oxygens of Gly274 and Glu277 (Fig. 2a, 3a). The ordered conformation of the β14-loop also places it just along the ACT2-ACT4 interface, enabling it to form several intramolecular contacts with residues in ACT2 (Fig. 3a). Cys278 hydrogen bonds with the backbones of Val110 and S111 in the α3-loop, while Asp276 forms a salt-bridge with Arg126. In addition, Glu277 extends in the opposite direction to form another salt-bridge with His175. (Fig. 3a). Thus, the β14-loop facilitates the formation of numerous inter-ACT-domain contacts in the presence of arginine. Indeed, the arginine and β14-loop contribute ~40% of the total buried surface area in the ACT2-ACT4 interface of the arginine-bound structure (390 Å2 out of 980 Å2).
Figure 3. Arginine facilitates the intramolecular association of the ACT2 and ACT4 domains of CASTOR1.
a, Top-down view of the arginine- and β14-loop-mediated contacts between ACT2 and ACT4. Hydrogen bonds and salt-bridges are shown as black dashed lines. b, CASTOR1 D276A, R126A, E277A, H175A, and C278A mutants display reduced arginine-binding capacity in vitro. Binding assays were performed and immunoprecipitates analyzed as in 2c. Values are Mean ± SD for 3 technical replicates from one representative experiment. c, The CASTOR1 D276A, R126A, E277A, H175A, and C278A mutants constitutively bind GATOR2 in cells. HEK-293T cells transiently expressing the indicated HA-tagged constructs were starved of arginine for 50 min and, where indicated, restimulated for 10 min. HA-immunoprecipitates prepared and analyzed as in 1c. d, CASTOR1 ACT1–2 (1–169) and CASTOR1 ACT3–4 (169–329) associate in an arginine- and β14-loop dependent manner. HEK-293T cells transiently expressing the indicated HA-tagged constructs were starved of arginine for 60 min and, where indicated, restimulated for 60 min. HA-immunoprecipitates were prepared and analyzed as in 1c.
The glycine-rich β14-loop is predicted to have a high propensity for disorder, and our structure suggests that these inter-ACT-domain contacts could stabilize it in an ordered conformation over the bound arginine. Indeed, mutation of key residues in both the β14-loop (D276A, E277A, C278A) and the adjacent ACT domains (R126A, H175A) significantly reduced the arginine binding capacity of CASTOR1 (Fig. 3b, c), indicating that the inter-ACT-domain contacts formed by the β14-loop are required for arginine sensing by CASTOR1. In addition, we found that the N-terminal (ACT1 and ACT2) and C-terminal (ACT3 and ACT4) halves of CASTOR1 associate in both an arginine- and β14-loop-dependent manner when expressed as separate polypeptides in HEK-293T cells12 (Fig. 3d), indicating that arginine likely induces a conformational change in CASTOR1 by stabilizing the ACT2-ACT4 interaction.
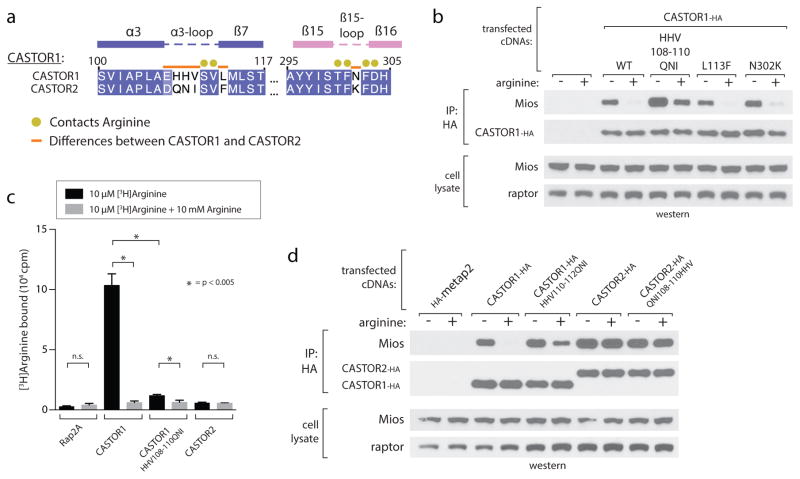
In addition to CASTOR1, human cells express a related protein, CASTOR2, which shares 63% sequence identity but does not bind arginine12. Although the regions of CASTOR1 directly involved in arginine binding are well conserved (Extended Data Fig. 1a), we identified residues along the ACT2-ACT4 interface (His108 to Val110) that differ between CASTOR1 and CASTOR2 (Extended Data Fig. 4a). Switching these residues of CASTOR1 with those in CASTOR2 abrogated arginine binding in vitro and converted CASTOR1 to a nearly constitutive GATOR2-interactor in cells, resembling CASTOR2 (Extended Data Fig. 4b–d). Interestingly, these residues immediately precede Ser111 and hydrogen bond with Cys278 in the β14-loop (Fig. 3a, Extended Data Fig. 4a), suggesting that their identity may be critical for the proper positioning of the α3-loop to enable arginine binding and/or the association of ACT2 and ACT4. The corresponding mutation in CASTOR2 (108QNI-110HHV) however was not sufficient to confer arginine binding, suggesting that additional differences also contribute (Extended Data Fig. 4d).
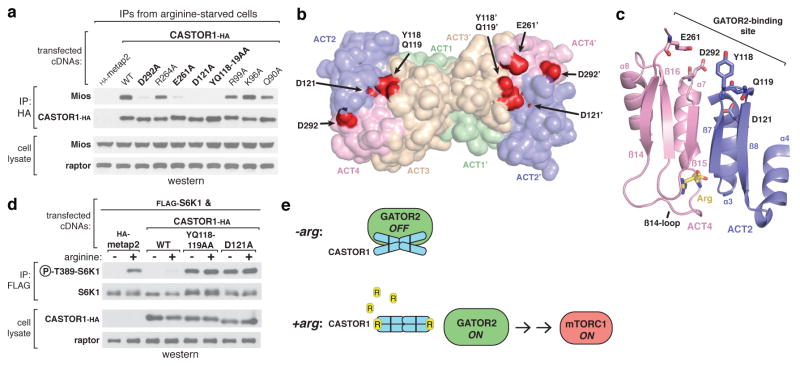
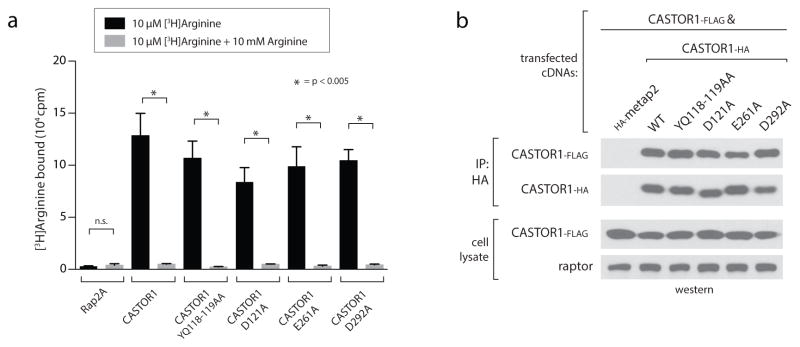
To understand how arginine induces dissociation of CASTOR1 from GATOR2, we identified five highly conserved sites in CASTOR1 required for the interaction with GATOR2 (Y118, Q119, D121, E261, D292, Fig. 4a, Extended Data Fig. 1a). Importantly, these mutants still bind arginine in vitro and homodimerize when expressed in cells (Extended Data Fig. 5a, b). Interestingly, these residues cluster along the surface of the ACT2-ACT4 interface, adjacent to but on the opposite face of the protein as the arginine-binding pocket (Fig. 4b, c). Glu261 and Asp292 are closely linked to the β14-loop, separated only by β14 and helix α7, respectively (Fig. 4c). Furthermore, the critically important residue Asp121 is buried in the ACT2-ACT4 interface, providing one explanation for why the arginine-bound conformation is incompatible with the CASTOR1-GATOR2 interaction (Fig. 4c).
Figure 4. The GATOR2 binding site of CASTOR1 is at the ACT2-ACT4 interface and is required for signalling arginine deprivation to mTORC1.
a, The CASTOR1 D292A, E261A, D121A, and YQ118–119AA mutants are deficient in GATOR2 binding. HA-immunoprecipitates prepared from HEK293T-cells transiently expressing the indicated HA-tagged constructs were analyzed as in 1c. b, Solvent-exposed surface view of the CASTOR1 homodimer highlighting the GATOR2-binding sites (red). Residue E261 is in a partially disordered loop and not visible in one monomer (left). c, Cross-sectional view of the ACT2-ACT4 interface showing the positions of the critical GATOR2-binding residues relative to the bound arginine (yellow) and the β14-loop. d, The GATOR2-binding-deficient YQ118–119AA and D121A mutants of CASTOR1 fail to inhibit the mTORC1 pathway and render cells insensitive to arginine starvation. HEK-293T cells were transiently transfected with FLAG-S6K1 and the indicated HA-tagged constructs. FLAG-immunoprecipitates were prepared and analyzed as in 1d. e, Model of how arginine releases CASTOR1 from GATOR2 to activate mTORC1.
Together, these results suggest a model where arginine binding orders the glycine-rich β14-loop to enable the intramolecular association of ACT2 and ACT4 (Fig. 3a–d). This association of these domains would alter the positions and exposure of the residues required for GATOR2 binding, which also lie along the ACT2-ACT4 interface (Fig. 4a–c), thereby triggering the dissociation of CASTOR1 from GATOR2 and the subsequent activation of mTORC1 (Fig. 4e).
The observation that CASTOR1 both inhibits mTORC1 signalling and interacts with GATOR2 in an arginine-sensitive manner suggests that CASTOR1 may regulate mTORC1 by inhibiting GATOR2, a mechanism analogous to that of the recently identified leucine sensor Sestrin216–19. Using our GATOR2 binding-deficient mutants, we were able to test this hypothesis directly. Indeed, in contrast to wild-type CASTOR1, the GATOR2-binding deficient YQ118–119AA and D121A mutants both failed to inhibit mTORC1 signalling in cells (Fig. 4d). Moreover, due to their ability to dimerize with endogenous CASTOR1, these mutants also functioned as dominant negatives, rendering mTORC1 fully resistant to arginine starvation (Fig. 4d). Thus, the CASTOR1-GATOR2 interaction is required to signal arginine deprivation to mTORC1.
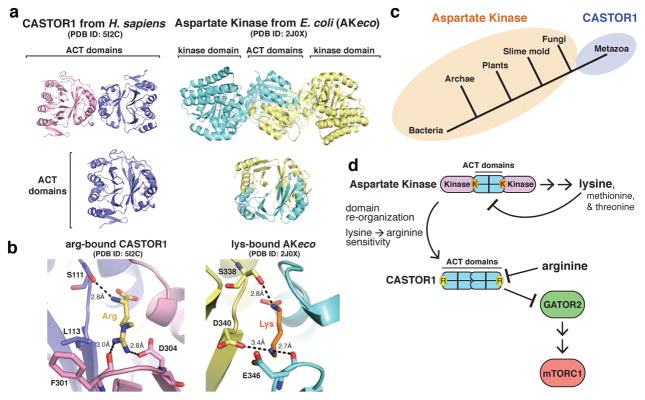
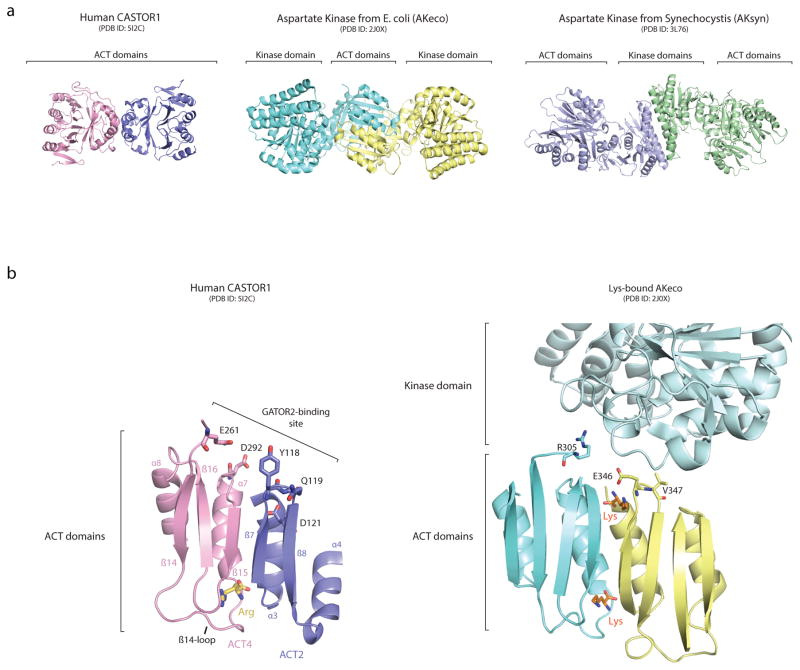
Although defined by their common topology, ACT domains are highly diverse in sequence and form a wide range of structural assemblies14,15. Comparison of our structure with other ACT domain-containing proteins in the Protein Data Bank (PDB) revealed that CASTOR1 shares substantial structural homology with the allosteric regulatory domains of bacterial Aspartate Kinases (AKs), including those found in E. coli (AKeco) and cyanobacteria (AKsyn)20,21 (Fig. 5a, Extended Data Fig. 6a). AKs catalyze the first step of a metabolic pathway that synthesizes several amino acids, including lysine, and display allosteric feedback inhibition when downstream products bind to the regulatory domains22. Interestingly, AKeco binds lysine through pockets that bear striking resemblance to the arginine-binding pocket of CASTOR120 (Fig. 5b). Furthermore, AKeco residues Arg305, Glu346, and Val347, which correspond to the positions of the critical GATOR2-binding residues Glu261, Tyr118, and Gln119, respectively, directly participate in the lysine-dependent inhibition of the kinase domain in AKeco20 (Fig. Extended Data Fig. 6b). Thus, the overall structure, mode of amino-acid binding, and likely allosteric mechanism of CASTOR1 all resemble those found in the regulatory domain of prokaryotic AKs.
Figure 5. Insights into the evolution of arginine sensing by CASTOR1.
a, (Top) Ribbon view of human CASTOR1 dimer (pink and purple) and AKeco dimer (blue and yellow, PDB ID 2J0X). (Bottom) Ribbon view of the human CASTOR1 monomer (left) and regulatory domain from AKeco (right). b, Comparison of the arginine-binding pocket in human CASTOR1 with the lysine-binding pocket in AKeco. Arginine and lysine are shown in yellow and orange, respectively. Hydrogen bonds and salt-bridges are shown as black dashed lines. c, Phylogenetic distribution of Aspartate Kinase (orange) and CASTOR1 homologues (purple). d, Model of the evolution of CASTOR1 from the regulatory domain of an ancestral Aspartate Kinase.
These similarities suggest that CASTOR1 shares an evolutionary origin with prokaryotic AKs. Interestingly, AKs are found throughout bacteria, archaea, and many eukaryotic lineages, but were lost prior to the emergence of metazoa, while CASTOR1 homologues are only present in metazoa (Fig. 5c). Thus, in order to acquire arginine sensitivity in early multicellular animals, the mTORC1 pathway may have taken advantage of this more ancient, lysine-sensitive regulatory mechanism (Fig. 5d). This exploitation of a pre-existing allosteric module is analogous to the models proposed for the evolution of hormone-receptor signalling23 and yeast MAP kinases24, and may enable the more rapid incorporation of novel signalling responses into existing pathways25.
Together, our results provide a structural basis for arginine sensing by the mTORC1 pathway. Furthermore, our data using arginine analogues suggests that our structure may be useful for predicting compounds that can modulate arginine sensing by CASTOR1 in vivo. As deregulation of mTORC1 is common in human diseases, including cancer26,27, the identification of novel pharmacological regulators of mTORC1 activity is of particular interest.
Methods
Materials
Reagents were obtained from the following sources: HRP-labeled anti-rabbit secondary antibody from Santa Cruz Biotechnology; antibodies to phospho-T389 S6K1, S6K1, Mios and the FLAG epitope from Cell Signaling Technology; antibodies to the HA epitope from Bethyl laboratories; antibody to raptor from Millipore. All antibodies used have been published previously12,19. FLAG-M2 affinity gel and amino acids from Sigma Aldrich; RPMI without leucine, arginine, or lysine from Pierce; DMEM from SAFC Biosciences; XtremeGene9 and Complete Protease Cocktail from Roche; Inactivated Fetal Calf Serum (IFS) from Invitrogen; [3H]-labeled arginine from American Radiolabeled Chemicals.
Protein production and purification
Full-length, codon-optimized human CASTOR1 was N-terminally fused with a human rhinovirus 3C protease–cleavable His10-Arg8-ScSUMO tag and cloned into a PET-Duet-1 bacterial expression vector. This vector was transformed into Escherichia coli LOBSTR (DE3) cells (Kerafast)28. Cells were grown at 37 °C to 0.6 OD, then protein production was induced with 0.2 mM IPTG at 18 °C for 12–14 h. Cells were collected by centrifugation at 6,000g, resuspended in lysis buffer (50 mM potassium phosphate, pH 8.0, 500 mM NaCl, 30 mM imidazole, 3 mM β-mercaptoethanol (βME) and 1 mM PMSF) and lysed with a cell disruptor (Constant Systems). The lysate was cleared by centrifugation at 10,000g for 20 min. The soluble fraction was incubated with Ni-Sepharose 6 Fast Flow beads (GE Healthcare) for 30 min on ice. After washing of the beads with lysis buffer, the protein was eluted in 250 mM imidazole, pH 8.0, 150 mM NaCl and 3 mM βME. The Ni eluate was diluted 1:1 with 10 mM potassium phosphate, pH 8.0, 0.1 mM EDTA and 1 mM dithiothreitol (DTT), and was subjected to cation-exchange chromatography on a 5 ml SP sepharose fast flow column (GE Healthcare) with a linear NaCl gradient. The eluted CASTOR1 was then incubated with 3C protease and dialyzed overnight at 4 °C into 10 mM potassium phosphate, pH 8.0, 150 mM NaCl, 0.1 mM EDTA and 1 mM DTT, followed by a second cation-exchange chromatography run on an SP sepharose fast flow column (GE Healthcare) with a linear NaCl gradient. The protein was further purified via size-exclusion chromatography on a Superdex S200 16/60 column (GE Healthcare) equilibrated in running buffer (10 mM Tris-HCl, pH 8.0, 150 mM NaCl, 0.1 mM EDTA and 1 mM DTT). Selenomethionine (SeMet)-derivatized CASTOR1 was prepared as described previously29 and purified as the native version, except that the reducing-agent concentration (βME and DTT) was 5 mM in all buffers.
Crystallization
Purified CASTOR1 was concentrated to 6 mg/ml and incubated in 2 mM arginine for >1 hour prior to setting crystal trays. Crystals were grown at 18 °C by hanging-drop vapor diffusion with 1 μl of protein at 6 mg/ml mixed with an equal volume of reservoir solution containing 0.1 M sodium acetate pH 5.0, 0.25 M ammonium acetate, and 22.5% PEG 3350. Selenomethionine-derivatized CASTOR1 crystallized in 0.1 M BIS-TRIS pH 5.6, 0.25 M ammonium acetate, and 22.5% PEG3350. Crystals were cryoprotected in mother liquor supplemented with 20% (v/v) ethylene glycol.
Data collection and structure determination
Data collection was performed at the Advanced Photon Source end station 24-IDC at Argonne National Lab, at 100 K. All data-processing steps were carried out with programs provided through SBgrid30. Data reduction was performed with HKL200031. A complete native dataset was collected to 1.8 Å (at wavelength 0.9792 Å) and a complete SeMet dataset, at the selenium peak wavelength (0.9792 Å), was collected to 2.2 Å. The phase problem was solved using single-wavelength anomalous dispersion (SAD) and selenium positions were determined in HYSS, run as part of the PHENIX AutoSol program32, for the SeMet dataset (space group P21, 4 molecules per asymmetric unit). An interpretable 2.2 Å experimental electron density map was obtained, and manual model building was carried out in Coot33. Subsequent refinement was carried out with the superior 1.8 Å native data set using phenix.refine to a final Rwork/Rfree of 17.2%/20.4%. Ramachandran statistics in the final model are 99% favored, 1% allowed, and 0% outlier.
Structural analysis
Protein-protein and protein-ligand interfaces were analyzed using PDBePISA34. NCBI’s Vector Alignment Search Tool (VAST)35 was used to identify structurally related proteins in the PDB. The multiple sequence alignment (MSA) was generated in Jalview36 with the T-Coffee alignment algorithm37. Sequences of CASTOR1 homologues were obtained via NCBI BLAST searches38. All structure figures were made in PyMol39.
Cell lysis and immunoprecipitation
Cells were rinsed one time with ice-cold PBS and immediately lysed with Triton lysis buffer (1% Triton, 10 mM β-glycerol phosphate, 10 mM pyrophosphate, 40 mM Hepes pH 7.4, 2.5 mM MgCl2 and 1 tablet of EDTA-free protease inhibitor [Roche] (per 25 ml buffer). The cell lysates were cleared by centrifugation at 13,000 rpm at 4°C in a microcentrifuge for 10 minutes. For anti-HA-immunoprecipitations, the magnetic anti-HA beads (Pierce) were washed 3 times with lysis buffer. 30 μl of a 50/50 slurry of the affinity gel was then added to clarified cell lysates and incubated with rotation for 1 hour at 4°C. Following immunoprecipitation, the beads were washed 4 times with lysis buffer containing 500 mM NaCl. Immunoprecipitated proteins were denatured by the addition of 50 μl of sample buffer and boiling for 5 minutes as described40, resolved by 8%–16% SDS-PAGE, and analyzed by immunoblotting.
For co-transfection experiments in HEK-293T cells, 2.5 million cells were plated in 10 cm culture dishes. Twenty-four hours later, cells were transfected using the polyethylenimine method41 with the pRK5-based cDNA expression plasmids indicated in the following amounts: 50 ng CASTOR1-HA (wild-type or mutant), 50 ng CASTOR1-FLAG, 1 μg HA-metap2, or 2 ng S6K. For in vitro dissociation experiments, 50 ng of wild-type CASTOR1-HA was transfected into HEK-293T cells. The total amount of plasmid DNA in each transfection was normalized to 5 μg with empty pRK5. 36–48 hours after transfection, cells were lysed as described above.
For experiments that required amino acid starvation or restimulation, cells were treated as previously described42. Briefly, cells were incubated in arginine free RPMI for 50 minutes and then restimulated with 500 μM arginine for 10 minutes.
Arginine binding assay
5 million HEK-293T cells were plated in a 15 cm plate four days prior to the experiment. Twenty-four hours after plating, the cells were transfected via the polyethylenimine method with the pRK5-based cDNA expression plasmids indicated in the figures in the following amounts: 15 μg FLAG-Rap2A, 500 ng FLAG-CASTOR1 (wild-type or mutant). The total amount of plasmid DNA in each transfection was normalized to 15 μg total DNA with empty-PRK5. Forty-eight hours after transfection cells were lysed as previously described. If multiple samples of the same type were represented in the experiment, the cell lysates were combined, mixed, and evenly distributed amongst the relevant tubes.
Anti-FLAG beads were blocked by rotating in 1 μg/μl bovine serum albumin (BSA) for 20 minutes at 4 °C, then washed twice in lysis buffer and resuspended in an equal volume of lysis buffer. 30 μl of bead slurry was added to each of the clarified cell lysates and incubated as previously described. Post-IP, the beads were washed as previously and incubated for one hour on ice in cytosolic buffer (0.1% Triton, 40 mM HEPES pH 7.4, 10 mM NaCl, 150 mM KCl, 2.5 mM MgCl2) with the appropriate amount of [3H]-labeled arginine and cold argine. At the end of one hour, the beads were aspirated dry and rapidly washed three times with cytosolic buffer. The beads were aspirated dry again and resuspended in 85 μl of cytosolic buffer. Each sample was mixed well and three 10 μl aliquots were separately quantified using a TriCarb scintillation counter (PerkinElmer). This process was repeated in pairs for each sample, to ensure similar incubation and wash times for all samples analyzed across different experiments.
In vitro CASTOR1-GATOR2 dissociation assay with arginine analogues
HEK-293T were transfected with HA-CASTOR1 constructs as described above. 48 hours after transfection, cells were starved for all amino acids for 50 minutes, lysed and subjected to anti-FLAG immunoprecipitation as described previously. The CASTOR1-GATOR2 complexes immobilized on the HA beads were washed twice in lysis buffer with 500 mM NaCl, then incubated for 20 minutes in 1 mL of cytosolic buffer with 400 μM of the indicated compound. The amount of GATOR2 and CASTOR1 that remained bound was assayed by SDS-PAGE and immunoblotting as described previously.
Cell lines and tissue culture
HEK-293T cells were maintained at 37°C and 5% CO2 and cultured in DMEM 10% IFS supplemented with 2 mM glutamine, penicillin (100 IU/ml) and streptomycin (100 μg/ml). HEK-293T cells were obtained from the American Type Culture Collection (ATCC) and were free of mycoplasma contamination.
Statistical analysis
For the arginine-binding assays, two-tailed t tests were used for comparison between two groups. All comparisons were two-sided, and P values of less than 0.005 were considered to indicate statistical significance. The data meet the assumptions of the test and the variance is similar between groups that are being statistically compared.
Extended Data
Extended Data Figure 1. Multiple sequence alignment of CASTOR1 homologues.
a) Expanded Multiple Sequence Alignment of CASTOR1 homologues from various organisms. Positions are colored white to blue according to increasing sequence identity. Secondary structure features are labeled and colored by ACT domain as in 1A.
Extended Data Figure 2. Dimerization deficient CASTOR1 mutants bind arginine but fail to inhibit mTORC1 in cells.
a) The dimerization deficient CASTOR1 Y207S and I202E mutants bind arginine in vitro. FLAG-immunoprecipitates prepared from HEK-293T cells transiently expressing indicated FLAG-tagged proteins were used in binding assays with [3H]Arginine as described in the methods. Unlabeled arginine was included as a competitor where indicated. Values are Mean ± SD for 3 technical replicates from one representative experiment.
b) Dimerization deficient CASTOR1 Y207S and I202E mutants fail to inhibit mTORC1. HEK-293T cells transiently expressing FLAG-S6K1 and HA-tagged CASTOR1 WT, Y207S, or I202E were starved of arginine for 50 min and, where indicated, restimulated for 10 min. FLAG- immunoprecipitates were prepared from lysates and analyzed as in 1C. Phospho-S6K1 was used as an indicator of mTORC1 activity.
Extended Data Figure 3. Model of lysine-binding in CASTOR1.
a) Comparison of the arginine-bound pocket of human CASTOR1 with a model of the pocket with lysine in place of arginine. Arginine and lysine stick representations are shown in yellow and orange, respectively. The distances in the lysine-bound model, 3.8 Å and 5.0 Å, are beyond the range of standard hydrogen-bonds and salt-bridges, respectively. ACT domains are labeled as in 1A.
b) Chemical structures of arginine analogues used in Fig. 2E. Differences relative to L-Arginine are highlighted in oranges boxes.
Extended Data Figure 4. Differences in the arginine-binding capacities of CASTOR1 and CASTOR2.
a) Multiple sequence alignment of human CASTOR1 and CASTOR2, highlighting differences in amino acid sequence that are in close proximity to arginine binding residues in CASTOR1.
b) The CASTOR1 HHV108–110QNI mutant constitutively binds GATOR2 in cells. HEK-293T cells transiently expressing HA-metap2 or the indicated HA-tagged CASTOR1 constructs were starved of arginine for 50 min and, where indicated, restimulated for 10 min. HA-immunoprecipitates prepared and analyzed as in 1C.
c) The CASTOR1 HHV108–110QNI mutant displays reduced arginine-binding capacity in vitro. Binding assays were performed with the indicated CASTOR1 or CASTOR2 constructs and immunoprecipitates analyzed as in 2C. Values are Mean ± SD for 3 technical replicates from one representative experiment.
d) Comparison of the CASTOR1 HHV108–110QNI mutant and WT CASTOR2. HEK-293T cells transiently expressing HA-metap2 or the indicated HA-tagged CASTOR1 or CASTOR2 constructs were starved of arginine for 50 min and, where indicated, restimulated for 10 min. HA-immunoprecipitates prepared and analyzed as in 1C.
Extended Data Figure 5. GATOR2-binding deficient CASTOR1 mutants still bind arginine and homodimerize.
a) The CASTOR1 YQ118–119AA, D121A, E261A and D292A mutants bind arginine in vitro. FLAG-immunoprecipitates prepared from HEK-293T cells transiently expressing indicated FLAG-tagged proteins were used in binding assays with [3H]Arginine as described in the methods. Unlabeled arginine was included as a competitor where indicated. Values are Mean ± SD for 3 technical replicates from one representative experiment.
b) The CASTOR1 YQ118–119AA, D121A, E261A and D292A mutants dimerize in cells. HA-immunoprecipitates prepared from HEK293T-cells transiently expressing CASTOR1-FLAG and HA-metap2 or the indicated HA-tagged CASTOR1 constructs were analyzed as in 1C.
Extended Data Figure 6. Similarities between human CASTOR1 and prokaryotic Aspartate Kinases.
a) Ribbon diagram views of human CASTOR1 (this paper), AKeco (PDB ID: 2J0x) and AKsyn (PDB ID: 3L76), highlighting the different modes of dimerization. AKs can dimerize through an interlocked-ACT domain conformation (as in AKeco) or through their kinase domains (AKsyn), both of which are distinct from the side-by-side ACT-domain dimerization in CASTOR1.
b) View of AKeco depicting positions of residues R305, E346, and V347, which correspond to the positions of GATOR2-interacting residues of CASTOR1.
Extended Data Table 1.
Data collection and refinement statistics (SAD)
| CASTOR1 + Arg Native | CASTOR1 + Arg SeMet | |
|---|---|---|
| Organism | H. sapiens | H. sapiens |
| PDB ID | 5I2C | |
| Data collection | ||
| Space group | P21 | P21 |
| Cell dimensions | ||
| a, b, c (Å) | 91.39, 82.60, 96.67 | 91.76, 82.35, 96.71 |
| α, β, γ (°) | 90, 116.23, 90 | 90, 116.04, 90 |
| Peak | ||
| Wavelength (Å) | 0.9792 | 0.9792 |
| Resolution (Å) | 86.7 – 1.80 | 86.89 – 2.20 |
| Rsym (%) | 7.2 (62.8) | 10.4 (>100) |
| I/σI | 25.9 (1.2) | 22.6 (1.4) |
| Completeness (%) | 97.85 (87.1) | 98.2 (98.1) |
| Redundancy | 3 (2.5) | 6.4 (5.9) |
| Anomolous Completeness (%) | 96.8 | |
| Refinement | ||
| Resolution (Å) | 86.71 – 1.80 | |
| No. reflections | 116,883 | |
| Rwork/Rfree | 17.2%/20.4% | |
| No. atoms | 9,872 | |
| Protein | 9,012 | |
| Arg | 48 | |
| Water | 796 | |
| Average B-factors (Å) | 40.2 | |
| Protein | 40.0 | |
| Arg | 26.8 | |
| Water | 46.4 | |
| R.m.s. deviations | ||
| Bond lengths (Å) | 0.007 | |
| Bond angles (°) | 0.85 | |
Values in parentheses are for highest-resolution shell.
Supplementary Material
Acknowledgments
We thank all members of the Sabatini and Schwartz laboratories for helpful insights. This work is based on research conducted at the Northeastern Collaborative Access Team beamlines, which are funded by the National Institute of General Medical Sciences from the National Institutes of Health (P41 GM103403). The Pilatus 6M detector on 24-ID-C beam line is funded by a NIH-ORIP HEI grant (S10 RR029205). This research used resources of the Advanced Photon Source, a U.S. Department of Energy (DOE) Office of Science User Facility operated for the DOE Office of Science by Argonne National Laboratory under contract no. DE-AC02-06CH11357. This work has been supported by grants from NIH (R01CA103866 and AI47389) and the U.S. Department of Defense (W81XWH-07- 0448) to D.M.S. Fellowship support was provided by NIH to L.C. (F31 CA180271). D.M.S. is an investigator of the Howard Hughes Medical Institute.
Footnotes
Author Contributions
R.A.S, T.U.S, and D.M.S designed the research plan. R.A.S performed the experiments with assistance from L.C and K.E.K on experimental design and interpretation. R.A.S, T.U.S, and D.M.S wrote and all authors edited the manuscript.
Author Information
Coordinates and structure factors for the x-ray crystal structure of CASTOR1 have been deposited in the Protein Data Bank (PDB) with accession code 5I2C. D.M.S. is a founder, a member of the Scientific Advisory Board, a paid consultant, and a shareholder of Navitor Pharmaceuticals, which is targeting for therapeutic benefit the amino acid sensing pathway upstream of mTORC1.
References
- 1.Laplante M, Sabatini DM. mTOR signaling in growth control and disease. Cell. 2012;149:274. doi: 10.1016/j.cell.2012.03.017. [DOI] [PMC free article] [PubMed] [Google Scholar]
- 2.Dibble CC, Manning BD. Signal integration by mTORC1 coordinates nutrient input with biosynthetic output. Nature Cell Biology. 2013;15:555–564. doi: 10.1038/ncb2763. [DOI] [PMC free article] [PubMed] [Google Scholar]
- 3.Jewell JL, Russell RC, Guan KL. Amino acid signaling upstream of mTOR. Nature Reviews Molecular Cell Biology. 2013;14:133. doi: 10.1038/nrm3522. [DOI] [PMC free article] [PubMed] [Google Scholar]
- 4.Ban H, et al. Arginine and Leucine regulate p70 S6 kinase and 4E-BP1 in intestinal epithelial cells. International journal of molecular medicine. 2004;13:537–543. [PubMed] [Google Scholar]
- 5.Bronte V, Zanovello P. Regulation of immune responses by L-arginine metabolism. Nat Rev Immunol. 2005;5:641–654. doi: 10.1038/nri1668. [DOI] [PubMed] [Google Scholar]
- 6.Floyd JC, et al. Stimulation of insulin secretion by amino acids. Journal of Clinical Investigation. 1966;45:1487. doi: 10.1172/JCI105456. [DOI] [PMC free article] [PubMed] [Google Scholar]
- 7.Yao K, et al. Dietary arginine supplementation increases mTOR signaling activity in skeletal muscle of neonatal pigs. J Nutr. 2008;138:867–872. doi: 10.1093/jn/138.5.867. [DOI] [PubMed] [Google Scholar]
- 8.Sancak Y, et al. The Rag GTPases bind raptor and mediate amino acid signaling to mTORC1. Science. 2008;320:1496. doi: 10.1126/science.1157535. [DOI] [PMC free article] [PubMed] [Google Scholar]
- 9.Bar-Peled, et al. A Tumor Suppressor Complex with GAP Activity for the Rag GTPases That Signal Amino Acid Sufficiency to mTORC1. Science. 2013;340:1100–1106. doi: 10.1126/science.1232044. [DOI] [PMC free article] [PubMed] [Google Scholar]
- 10.Wang S, et al. Lysosomal amino acid transporter SLC38A9 signals arginine sufficiency to mTORC1. Science. 2015;347:188–194. doi: 10.1126/science.1257132. [DOI] [PMC free article] [PubMed] [Google Scholar]
- 11.Rebsamen M, et al. SLC38A9 is a component of the lysosomal amino acid sensing machinery that controls mTORC1. Nature. 2015;519:477–481. doi: 10.1038/nature14107. [DOI] [PMC free article] [PubMed] [Google Scholar]
- 12.Chantranupong L, et al. The CASTOR proteins are arginine sensors for the mTORC1 pathway. Cell. 2016;165:153–164. doi: 10.1016/j.cell.2016.02.035. [DOI] [PMC free article] [PubMed] [Google Scholar]
- 13.Aravind L, Koonin EV. Gleaning non-trivial structural, functional and evolutionary information about proteins by iterative database searches. Journal of Molecular Biology. 1999;287:1023–1040. doi: 10.1006/jmbi.1999.2653. [DOI] [PubMed] [Google Scholar]
- 14.Grant GA. The ACT Domain: A Small Molecule Binding Domain and Its Role as a Common Regulatory Element. Journal of Biological Chemistry. 2006;281:33825–33829. doi: 10.1074/jbc.R600024200. [DOI] [PubMed] [Google Scholar]
- 15.Chipman D. The ACT domain family. Current opinion in structural biology. 2001;11:694–700. doi: 10.1016/s0959-440x(01)00272-x. [DOI] [PubMed] [Google Scholar]
- 16.Chantranupong L, et al. The Sestrins Interact with GATOR2 to Negatively Regulate the Amino-Acid-Sensing Pathway Upstream of mTORC1. Cell Reports. 2014;9:1–8. doi: 10.1016/j.celrep.2014.09.014. [DOI] [PMC free article] [PubMed] [Google Scholar]
- 17.Parmigiani A, et al. Sestrins Inhibit mTORC1 Kinase Activation through the GATOR Complex. Cell Reports. 2014;9:1281–1291. doi: 10.1016/j.celrep.2014.10.019. [DOI] [PMC free article] [PubMed] [Google Scholar]
- 18.Wolfson RL, et al. Sestrin2 is a leucine sensor for the mTORC1 pathway. Science. 2016;351:43. doi: 10.1126/science.aab2674. [DOI] [PMC free article] [PubMed] [Google Scholar]
- 19.Saxton RA, et al. Structural basis for leucine sensing by the Sestrin2-mTORC1 pathway. Science. 2016;351:53. doi: 10.1126/science.aad2087. [DOI] [PMC free article] [PubMed] [Google Scholar]
- 20.Kotaka M, Ren J, Lockyer M, Hawkins AR, Stammers DK. Structures of R- and T-State Escherichia Coli Aspartokinase III: Mechanisms of the Allosteric Transition and Inhibition by Lysine. Journal of Biological Chemistry. 2006;281:31544. doi: 10.1074/jbc.M605886200. [DOI] [PubMed] [Google Scholar]
- 21.Robin AY, et al. New mode of dimerization of allosteric enzymes with ACT domains revealed by the crystal structure of the aspartate kinase from Cyanobacteria. J Mol Biol. 2010;399:283–293. doi: 10.1016/j.jmb.2010.04.014. [DOI] [PubMed] [Google Scholar]
- 22.Dumas R, Cobessi D, Robin AY, Ferrer JL, Curien G. The many faces of aspartate kinases. Archives of biochemistry and biophysics. 2012;519:186–193. doi: 10.1016/j.abb.2011.10.016. [DOI] [PubMed] [Google Scholar]
- 23.Bridgham JT, Carroll SM, Thornton JW. Evolution of hormone-receptor complexity by molecular exploitation. Science. 2006;312:97–101. doi: 10.1681/01.asn.0000926836.46869.e5. [DOI] [PubMed] [Google Scholar]
- 24.Coyle SM, Flores J, Lim WA. Exploitation of latent allostery enables the evolution of new modes of MAP kinase regulation. Cell. 2013;154:875–887. doi: 10.1016/j.cell.2013.07.019. [DOI] [PMC free article] [PubMed] [Google Scholar]
- 25.Peisajovich SG, Garbarino JE, Wei P, Lim WA. Rapid diversification of cell signaling phenotypes by modular domain recombination. Science. 2010;328:368–372. doi: 10.1126/science.1182376. [DOI] [PMC free article] [PubMed] [Google Scholar]
- 26.Zoncu R, Efeyan A, Sabatini DM. mTOR: from growth signal integration to cancer, diabetes and ageing. Nature Reviews Molecular cell biology. 2011;12:21. doi: 10.1038/nrm3025. [DOI] [PMC free article] [PubMed] [Google Scholar]
- 27.Shaw RJ, Cantley LC. Ras, PI(3)K, and mTOR signaling controls tumour cell growth. Nature. 2006;441:424–430. doi: 10.1038/nature04869. [DOI] [PubMed] [Google Scholar]
- 28.Andersen KR, Leksa NC, Schwartz TU. Optimized E. coli expression strain LOBSTR eliminates common contaminants from His-tag purification. Proteins. 2013;81:1857–61. doi: 10.1002/prot.24364. [DOI] [PMC free article] [PubMed] [Google Scholar]
- 29.Brohawn SG, Leksa NC, Spear ED, Rajashankar KR, Schwartz TU. Structural evidence for common ancestry of the nuclear pore complex and vesicle coats. Science. 2008;322:1369–1373. doi: 10.1126/science.1165886. [DOI] [PMC free article] [PubMed] [Google Scholar]
- 30.Morin A, et al. Collaboration gets the most out of software. eLife. 2013;2:e01456. doi: 10.7554/eLife.01456. [DOI] [PMC free article] [PubMed] [Google Scholar]
- 31.Otwinowski Z, Minor W. Processing of X-ray diffraction data collected in oscillation mode. Methods Enzymol. 1997;276:307–326. doi: 10.1016/S0076-6879(97)76066-X. [DOI] [PubMed] [Google Scholar]
- 32.Adams PD, et al. PHENIX: a comprehensive Python-based system for macromolecular structure solution. Acta Crystallogr D Biol Crystallogr. 2010;66:213–221. doi: 10.1107/S0907444909052925. [DOI] [PMC free article] [PubMed] [Google Scholar]
- 33.Emsley P, Lohkamp B, Scott WG, Cowtan K. Features and development of Coot. Acta Crystallogr D Biol Crystallogr. 2010;66:486–501. doi: 10.1107/S0907444910007493. [DOI] [PMC free article] [PubMed] [Google Scholar]
- 34.Krissinel E, Henrick K. Inference of Macromolecular Assemblies from Crystalline State. Journal of Molecular Biology. 2007;372:774–797. doi: 10.1016/j.jmb.2007.05.022. [DOI] [PubMed] [Google Scholar]
- 35.Gibrat JF, et al. Surprising similiarities in structure comparison. Current Opinion Structural Biology. 1996;6(3):377–85. doi: 10.1016/s0959-440x(96)80058-3. [DOI] [PubMed] [Google Scholar]
- 36.Waterhouse AM, Procter JB, Martin DMA, Clamp M, Barton GJ. Jalview Version 2 - a multiple sequence alignment editor and analysis workbench. Bioinformatics. 2009;25:1189–1191. doi: 10.1093/bioinformatics/btp033. [DOI] [PMC free article] [PubMed] [Google Scholar]
- 37.Notredame, et al. T-Coffee: A novel method for multiple sequence alignments. Journal of Molecular Biology. 2000;302:205–217. doi: 10.1006/jmbi.2000.4042. [DOI] [PubMed] [Google Scholar]
- 38.Altschul SF, Gish W, Miller W, Myers EW, Lipman DJ. Basic local alignment search tool. Journal of Molecular Biology. 1990;215:403–410. doi: 10.1016/S0022-2836(05)80360-2. [DOI] [PubMed] [Google Scholar]
- 39.Schrodinger, LLC. The PyMOL Molecular Graphics System, Version 1.3r1. 2010. [Google Scholar]
- 40.Kim DH, et al. mTOR Interacts with Raptor to Form a Nutrient-Sensitive Complex that Signals to the Cell Growth Machinery. Cell. 2002;110:163–175. doi: 10.1016/s0092-8674(02)00808-5. [DOI] [PubMed] [Google Scholar]
- 41.Boussif O, et al. A versatile vector for gene and oligonucleotide transfer into cells in culture and in vivo: polyethylenimine. PNAS. 1995;92:7297–7301. doi: 10.1073/pnas.92.16.7297. [DOI] [PMC free article] [PubMed] [Google Scholar]
- 42.Tsun ZY, et al. The Folliculin Tumor Suppressor Is a GAP for the RagC/D GTPases That Signal Amino Acid Levels to mTORC1. Molecular Cell. 2013;52:495–505. doi: 10.1016/j.molcel.2013.09.016. [DOI] [PMC free article] [PubMed] [Google Scholar]
Associated Data
This section collects any data citations, data availability statements, or supplementary materials included in this article.


