

Abstract
The development of patient profiles to subgroup individuals on a variety of variables has gained attention as a potential means to better inform clinical decision-making. Patterns of pain sensitivity response specific to quantitative sensory testing (QST) modality have been demonstrated in healthy subjects. It has not been determined if these patterns persist in a knee osteoarthritis population. In a sample of 218 participants, 19 QST measures along with pain, psychological factors, self-reported function, and quality of life were assessed prior to total knee arthroplasty. Component analysis was used to identify commonalities across the 19 QST assessments to produce standardized pain sensitivity factors. Cluster analysis then grouped individuals that exhibited similar patterns of standardized pain sensitivity component scores. The QST resulted in four pain sensitivity components: heat, punctate, temporal summation, and pressure. Cluster analysis resulted in five pain sensitivity profiles: a “low pressure pain” group, an “average pain” group, and three “high pain” sensitivity groups who were sensitive to different modalities (punctate, heat, and temporal summation). Pain and function differed between pain sensitivity profiles, along with sex distribution; however no differences in OA grade, medication use, or psychological traits were found. Residualizing QST data by age and sex resulted in similar components and pain sensitivity profiles. Further, these profiles are surprisingly similar to those reported in healthy populations suggesting that individual differences in pain sensitivity are a robust finding even in an older population with significant disease.
Keywords: Cluster analysis, Factor analysis, Osteoarthritis, Knee pain, Quantitative sensory testing, pain phenotypes, pain sensitivity profiles
1. Introduction
Osteoarthritis (OA) is a chronic pain condition, affecting an estimated 27 million Americans [34], associated with both peripheral and central sensitivity [1,39,43]. Pain presentations can vary widely across this population and do not always correlate with disease severity [4,14]. This variation in pain experience may be related, in part, to differences in pain sensitivity and understanding these differences may have significant clinical implications.
In healthy individuals, pain sensitivity profiles demonstrate a wide degree of inter-individual variability, in that individuals can be sensitive to one noxious stimuli yet relatively insensitive to another [22]. Using quantitative sensory testing (QST), clusters of individuals exhibited pain sensitivity profiles characterized as: high heat pain sensitivity, high temporal summation (TS), high pressure pain sensitivity, and/or low sensitivity to ischemic, pressure, or cold pain [9,22]. Thus, in healthy, pain-free cohorts, a range of normal pain sensitivity profiles, specific to different QST modalities, has been described. Recently, the development of pain sensitivity patient profiles or phenotypes to subgroup individuals on a variety of variables has gained attention as a potential means to better understand the underlying mechanisms of pain conditions and inform clinical decision-making [11,31,37]. However, only a limited number of studies to date have attempted to characterize pain sensitivity phenotypes in patient populations [11].
It is becoming clear that increased pain sensitivity is predictive of greater clinical symptomatology and poorer treatment response among several chronic pain populations [53,54], including those with knee and hip osteoarthritis [59]. Further, the influence of central sensitivity in chronic pain conditions has been increasingly recognized [57,60], which may diminish or amplify pain sensitivity profiles observed in healthy populations. Although QST has been increasingly used in chronic pain populations to better characterize pain states, the question of whether different pain sensitivity profiles occur in these patient populations has not been well investigated. Arguably, the identification of specific pain sensitivity profiles based on QST may assist in improving diagnosis, individualized treatment and/or the discovery of optimal treatment strategies for patients with knee OA [11,15]. A recent study suggests pain sensitivity profiles may be relevant in patients with knee osteoarthritis when clusters based on QST, clinical pain and inflammatory biomarkers were considered [11]. However, due to the large number of variables included, these profiles describe more than pain sensitivity profiles, which may or may not be as informative when interpreting QST findings in patient populations.
Accordingly, the purpose of this study was to examine QST pain sensitivity profiles in a clinical population with advanced knee OA. Using baseline visit data collected as part of a larger randomized control trial, the TANK (TENS After New Knee) study [44], we sought to determine the factor structure of baseline pain sensitivity measures in this clinical population, identify specific clusters of individuals with similar pain sensitivity (QST) profiles, and ultimately compare clinical characteristics and quality of life across profiles. We hypothesized that patients with advanced knee OA would continue to differentiate into pain sensitivity clusters but with less heterogeneity than those observed in a healthy population [22].
2. Materials and Methods
2.1 Study Design
This was a cross-sectional study based on a secondary data analysis from the TANK study, a prospective, randomized, placebo-controlled study evaluating the effect of Transcutaneous Electrical Nerve Stimulation (TENS) on pain during rehabilitation exercises following Total Knee Arthroplasty, (ClinicalTrials.gov Identifier: NCT01364870). The primary aim results have been reported elsewhere [44]. Data from the preoperative (baseline) clinic visit only were used for this study.
2.2 Participants
With approval of the local Institutional Review Board and written informed consent, English-speaking patients, aged 30 years or older, with advanced knee OA who were scheduled for a primary, unilateral total knee arthroplasty were recruited from The University of Iowa Hospitals and Clinics (UIHC) and the Iowa City Veteran’s Affairs Medical Center (VAMC). Of the 714 approached to participate, 142 declined to participate (20%) and 226 patients were excluded for: 1) stroke/central nervous system (CNS) disease or had mental impairment affecting their ability to understand tests/measures (12%); 2) chronic pain other than knee OA that was being treated (18%); 3) sensory impairment, defined as lack of sharp or dull sensations over any of five dermatomes in their surgical leg (5%); 6) were permanently or indefinitely wheelchair bound (2%); 7) due to use of conditions that precluded use of the intervention being tested in the parent trial: use of TENS by subject in the last 5 years, being used by anyone in their household; or had a condition that precluded TENS use, such as pacemaker or allergy to nickel (60%); or 8) a prisoner (3%).
2.3 Patient Assessments
2.3.1. Demographics/Medical Information
A 5-page demographic and medical information questionnaire was used that assessed age, sex, marital status, race, ethnicity, educational level, body mass index (BMI), OA grade, number of co-morbidities, and presence of pain in other joints. Data were retrieved from the medical record, followed by self-report with questions asked in a standardized manner.
2.3.2 Pain Sensitivity (Quantitative Sensory Testing)
Quantitative sensory tests were used to assess pain sensitivity at 4 sites on the lower extremities: 1) the affected knee (primary hyperalgesia); 2) the anterior tibialis muscle on the affected leg (secondary hyperalgesia); 3) the contralateral knee; and 4) the anterior tibialis muscle on the contralateral leg. Three test points were marked 4 cm apart at each site, 4 cm medial to the knees and 2 cm lateral to the tibial crests (i.e. over the belly of the anterior tibialis muscles). A laminated template was used to guide standard placement of the testing sites.
1) Pressure Pain Threshold (PPT)
Deep mechanical pain sensitivity was determined using pressure pain thresholds. A hand-held pressure algometer (Somedic AB, Farsta, Sweden) with a 1 cm2 digital probe was used. Prior to PPT testing, a VersaForm pillow (Patterson Medical, Warrenville IL) was placed under the participant’s knees for support. Then a familiarization test with the algometer was performed on the participant’s arm. This was repeated, if needed, to reinforce understanding of the test. To measure PPT, the algometer probe was pressed over the marked test sites perpendicularly to the skin at a rate of 40 kPa/second. The participant was instructed to press a button when the pressure was first perceived as painful. Participants were instructed that if they felt they pressed the button too early or too late, they could let the assessment Research Assistant know and the test could be repeated. With this method, mean PPT of the knee averages approximately 250 kPa [38]. PPT has strong inter-rater reliability across multiple raters (ICC=0.91) [22].
2) Heat pain threshold and tolerance
Cutaneous thermal pain sensitivities were measured using heat pain thresholds (HPTh) and tolerances (HPTol). A computer-controlled TSA-II Neurosensory Analyzer (Medoc, Israel) and a Peltier thermode, size 16 × 16 mm were used. Minimum temperature was set at 34 °C and maximum at 52 °C. The rate of increase in temperature was 1 °C/s. Participants were informed that the thermode would not reach a temperature that would cause skin damage. A familiarization test was performed on the arm prior to testing. For threshold measures, participants were instructed to concentrate on the stimulus and to press a mouse button when the heat sensation was first perceived as painful. For tolerance measures, participants were instructed to press the mouse button when the heat sensation was no longer tolerable. Once the mouse button was pressed, the probe stopped heating and a temperature registered on the computer screen.
3) Punctate Pain Intensity
Participants were asked to rate the pain intensity on a 0–20 numeric rating scale (NRS) caused by the bending force from a standard von Frey filament (5.88, 60 g of force). The filament was pressed at a right angle to the skin’s surface until a slight bend occurred in the filament. This force was found in preliminary work to produce pain around the knee in asymptomatic older adults. Similar methodologies to assess punctate pain sensitivity have been reported [21,39].
4) Temporal Summation
Pain intensities to tonic heat stimuli were used to determine temporal summation. A tonic heat stimulus was applied with the TSA II. The intensity of this stimulus was determined first for each individual using a short series of ascending and descending thermal stimuli, culminating in identification of the temperature that induced a pain experience score of 12 on a 0–20 NRS (i.e. Pain-12). This method was adapted from the identification of a “pain-60” individualized stimulus previously described [19]. After reaching the “pain-12” temperature, participants rated pain on the 0–20 NRS at 0, 10, and 20 seconds. If the participant response rate was slow, only the time intervals rated were included. This method has been used by other investigators to successfully measure temporal summation [19,50]. Temporal summation was calculated by subtracting the rating at 0 seconds from the rating at 20 seconds. Individuals who rated the time 0 pain at a maximum intensity (intensity = 20) were excluded due to potential ceiling effects.
The 3 test points were averaged to determine a representative value for each site. Before determining these averages, outlier values were identified and removed. An outlier was identified using a 2-step process: step one determined if the difference between a value and the middle value was greater than the average variance; step two determined if the difference between the other 2 values was less than 50% of this difference. The remaining readings were averaged and this average was used to provide a representative value for each site.
2.3.3 Knee OA Clinical Pain-Related Characteristics
Several assessments were made to quantify the clinical pain experience of the participants, including pain intensity, duration of pain symptoms, and self-report usage of analgesic medications.
1) Pain intensity (rest and movement)
A 21-point numeric rating scale (0–20 NRS) was used to measure pain intensity in the affected knee. Participants were asked to rate their pain intensity on this scale where 0 represents “no pain” and 20 represents “the most intense pain imaginable”. Previous studies have shown that the use of the numeric rating scale has established validity and reliability [6,17,25]. It is associated with higher compliance and lower failure rates when compared to the Visual Analog Scale (VAS) [23]. A 21-point scale was used (vs. an 11-point scale) based on evidence that 21 points provide a sufficient and needed level of discrimination [26]. This assessment was conducted both at rest and with movement (range of motion pain & gait pain). Resting pain intensity was measured prior to any study procedures while the participant was resting comfortably without movement of the knee. Movement pain was measured during active flexion and extension of the surgical knee (ROM pain) as well as during a gait speed test (gait pain). The gait speed test was performed by instructing participants to walk as fast as they were safely able for 15 seconds down a straight hallway. The distance walked was then assessed with a measuring tape. Further details on this and the ROM procedures can be found in a prior publication [44].
3) Pain duration
Participants were asked how long they had experienced pain in their affected knee in years and months. These data were recorded on the medical information form described above.
4) Analgesic medications
All analgesic medications taken by participants were recorded. All opioid medications (oral and intravenous) were converted to an equianalgesic dosage of oral morphine and all non-opioid analgesic medications were converted to acetaminophen equivalents using a conversion table as previously described [18,32].
2.3.4. Psychological Assessments
Three psychological constructs were assessed using validated questionnaires:
1) Anxiety
The Trait subscale of the State-Trait Anxiety Inventory (STAI) was used to measure trait anxiety. The T-Anxiety scale (STAI Form Y-1) assesses how people generally feel. High scores mean more anxiety and low scores mean less. This tool has been used successfully in older adults [12].
2) Depression
The Geriatric Depression Scale (GDS) was used to screen participants for depression. The five-item version was chosen over the 15-item GDS because it has better sensitivities, specificities, predictive values and accuracies for outpatients [24,46]. Individuals who had ≥ 2 positive answers were considered to have a positive depression screen [24,52].
3) Pain catastrophizing
The Pain Catastrophizing Scale (PCS) was used to measure pain catastrophizing. This 13–item survey measures the extent that individuals ruminate, magnify, or feel helpless about their pain. Pain catastrophizing has been shown to correlate positively with many aspects of the pain experience, including pain intensity, emotional distress, pain-related disability, heath services use, pain behavior and reliance on medication [49,51,56].
2.3.5. Function and Quality of Life Assessments
Function and quality of life were assessed using well-validated and commonly used tools:
1) Function
A knee-specific questionnaire was used to assess self-reported function, the Knee injury and Osteoarthritis Outcome Score (KOOS). The KOOS provides 5 separately scored subscales: 1) Pain; 2) Other Symptoms; 3) Activities of Daily Living (ADL); 4) Function in Sport and Recreation; and 5) Knee-Related Quality of Life. Scores are on a scale from 0–100 (0 = extreme knee problems to 100 = no knee problems). The KOOS is an extension of the Western Ontario and McMaster Universities Osteoarthritis Index (WOMAC) and has demonstrated adequate validity and reliability (test-retest correlation coefficient = 0.6 – 0.94; internal consistency Cronbach’s a = 0.56 – 0.98) in patients with knee OA [7]. Only the 3 subscales consistent with the WOMAC (Pain, Other Symptoms, and Activities of Daily Living) were included in this study.
2) Quality of Life
A general quality of life tool, the Medical Outcomes Short Form 36 (SF-36) was used to assess quality of life. This questionnaire is commonly used in clinical trials to assess general physical and mental health and has demonstrated construct validity and good reliability (Cronbach a = 0.73 – 0.96) [5].
2.3.6. Data Collection Procedures
At the preoperative clinic visit approximately 1 week prior to surgery, participants were given the surveys to fill out (i.e. the demographic/medical information form, STAI, PCS, GDS, KOOS, and SF-36). They were familiarized with the 0–20 NRS and, while seated comfortably on an exam table, were asked to rate the intensity of pain (at rest) in their surgical knee. Then participants were asked to lie supine on the exam table. A VersaForm pillow was placed under their knees for support and comfort. Then testing spots were marked and QSTs were performed in the following order: punctate pain intensity, pressure pain threshold, heat pain threshold, heat pain tolerance, temporal summation. The 3 test points at each site were used in random order and averaged to obtain a representative value for each site (i.e. surgical and contralateral knee and surgical and contralateral anterior tibialis muscle). Active extension and flexion ROM of the affected knee was performed and the participant rated the pain during each of these movements. Then the participant walked to a straight hallway immediately outside the exam room and the gait speed test was performed. At the end of this test, the participant rated the maximum pain experienced during this test in their surgical knee.
2.4. Data Analyses
Prior to determining average QST values at each site, outlier values were identified and removed (see [44] for more details). Inter-rater reliability estimates were also conducted for each QST measure with Intraclass Correlation Coefficients ranging from 0.82 – 0.97.
To identify the commonalities across multiple baseline pain sensitivity assessments, and reduce the total number of QST assessments to a minimum set of components or factors, both Principal Components Analysis (PCA) and Principal Axis Factoring (PAF) approaches were examined with an oblique rotation (Oblimin, SPSS v 22.0, IBM, Armonk NY). The original pain sensitivity assessments included in the component or factor analysis included: heat thresholds and tolerances, von Frey cutaneous pain intensities, pressure pain thresholds, and noxious heat temporal summation. The mean of the repeated QST assessments at each of the test locations was used. Thus a total of 19 variables, based on a combination of test modality and test location, were used in the factor analysis. The optimal solution was determined based on the Scree plot, eigenvalues, and the interpretability of multiple solutions ranging from 3 to 5 components. Using the optimal solution, scores for each standardized pain response variable (mean 0, SD 1.0) were calculated for use in the subsequent cluster analyses.
To ensure positive factor scores represented greater pain sensitivity, reverse scoring was performed when necessary (positive standardized scores represented greater pain sensitivity). Large differences in pain sensitivity were operationally defined as standardized factor scores more than 0.75 SD higher or lower than the population mean. Moderate differences in pain sensitivity were defined as scores between 0.5 and 0.75 SD of the mean and average pain sensitivity within 0.5 SD of the mean.
Cluster analysis was performed to group the individuals that exhibited similar patterns of standardized pain sensitivity based on the pain sensitivity components (and again using the residualized components). Hierarchical cluster analysis, using Ward’s clustering method with squared Euclidean distances (SPSS v 22.0) was used to replicate methods used previously to identify pain sensitivity subgroups in a healthy cohort [22]. The optimal number of clusters was chosen based on the percent change between clusters and visual inspection of the cluster dendrogram. Because there is no single statistical evaluation of optimal cluster allocation, cluster group differences were confirmed using analysis of variance (ANOVA) of the pain sensitivity variables and cross-validated using discriminant (one left out) analysis. Between-group differences in clinical pain characteristics, demographic and psychological factors were also examined using ANCOVA, with covariate adjustment for age and sex, and/or Chi-square analyses as appropriate. To examine for equality of variances, Levene’s test was run prior to all ANCOVA; a square root transformation was used as needed to correct for unequal variances and the resulting transformed data re-analyzed.
In addition to adjusting for age- and sex- as covariates after determining cluster assignments using absolute QST values, we repeated the component analysis and clustering using age- and sex-residualized QST measures to control for the potential influence of these demographic variables on factors and/or clusters [3,13,33,45]. Thus, each individual’s QST results relative to the age- and sex- matched values of the cohort were calculated. This approach provides a secondary method to investigate whether absolute QST versus relative QST data, after adjusting for age and sex, provides pain sensitivity profiles that differ in regards to clinical pain characteristics.
Descriptive statistics are reported as means ± SD in text and tables, and graphically shown as means ± SE. Significance was set at p ≤ 0.01 for all analyses to minimize the likelihood of a type I error, without overly increasing the likelihood of a type II error due to the number of a priori comparisons planned.
3. Results
3.1 Participant Demographics
The sample of 346 participants were on average 62.3 (SD 9.6) years of age, had an average BMI of 34.3 (SD 6.8), and were primarily female (54%), white (94.8%), non-Hispanic (98%), married (61.3%), had not earned a college degree (64%), had experienced pain in the affected knee for 5 years or more (52.3%), had an OA grade of 4 (72.5%), and were taking non-opioids (76%) but not opioids (69.9%) for pain.
Of the 346 study participants, 98 were excluded from these analyses for having missing data (primarily thermal thresholds, tolerances, and temporal summation) and 30 were excluded for having an initial maximal pain rating of 20/20 during the temporal summation test. Thus, a total of 218 patients were included in the factor and cluster analyses. The overall demographic characteristics of the included and excluded patients are provided in Table 1. Those included were significantly more likely to be female and more highly educated (at the p≤ 0.01 level).
Table 1.
Patient characteristics of included and excluded participants in the current study.
| Preoperative Characteristics | Total (n=346) | Included (n=218) | Excluded (n=128) | Statistic | P value |
|---|---|---|---|---|---|
|
| |||||
| Age (years) | 62.3 ± 9.6 | 61.7 ± 10.0 | 63.4 ± 8.78 | t344=1.67 | .096 |
|
| |||||
| Sex | X2(1,346)=23.2 | <.0001* | |||
| Female | 158 (46%) | 140 (64%) | 48 (38%) | ||
| Male | 188 (54%) | 78 (36%) | 80 (62%) | ||
|
| |||||
| Marital Status | n=315 | n=201 | n=114 | X2(1,315)=4.6 | .033 |
| Married/SO | 201 (64%) | 137 (68%) | 64 (56%) | ||
| Never/Divorce/Wid | 114 (36%) | 64 (32%) | 50 (44%) | ||
|
| |||||
| Race/Ethnicity (Non-Hispanic/Caucasian) | 328 (95%) | 211 (97%) | 117 (91%) | X2(1,346)=4.7 | .030 |
|
| |||||
| Education | n=314 | n=201 | n=113 | X2(2,314)=13.0 | .002* |
| ≤High School | 107 (34%) | 60 (30%) | 47 (42%) | ||
| Some College | 94 (30%) | 54 (27%) | 40 (35%) | ||
| ≥College Degree | 113 (36%) | 87 (43%) | 26 (23%) | ||
|
| |||||
| BMI (kg/m2) | 33.9 ± 7.7 | 33.9 ± 7.0 | 33.9 ± 8.8 | t344=0.09 | .928 |
|
| |||||
| Severe OA, KL grade = 4 | 251 (73%) | 148 (68%) | 103 (80%) | X2(1,346)=6.4 | .011 |
|
| |||||
| Pain in Other Joints = Yes | 222 (64%) | 139 (64%) | 83 (65%) | X2(1,346)=0.04 | .839 |
|
| |||||
| Pain Medication Use | |||||
| Non-Opioids - Yes | 263 (76%) | 174 (80%) | 89 (70%) | X2(1,346)=4.7 | .037 |
| Opioids - Yes | 104 (30%) | 57 (26%) | 47 (37%) | X2(1,346)=4.3 | .040 |
|
| |||||
| Pain Duration | n=337 | n=215 | n=122 | X2(2,337)=1.4 | .508 |
| < 1 year | 20 (6%) | 14 (7%) | 6 (5%) | ||
| Couple or Few years | 136 (40%) | 82 (38%) | 54 (44%) | ||
| Several or Many yrs | 181 (54%) | 119 (55%) | 62 (51%) | ||
|
| |||||
| Co-morbidities | n=345 | n=217 | n=128 | X2(2,345)=4.4 | .109 |
| None | 71 (21%) | 48 (22%) | 23 (18%) | ||
| 1 – 2 | 145 (42%) | 97 (48%) | 48 (38%) | ||
| ≥ 3 | 129 (37.4%) | 72 (33%) | 57 (45%) | ||
Categorical data described as number (percent). Continuous data described as mean ± SD.
Significance set at p ≤ 0.01.
Abbreviations: SO=Significant Other; Wid=Widow; OA=Osteoarthritis; KL= Kellgren-Lawrence grade; BMI=Body Mass Index.
3.2 Component Analysis
The PCA and PAF analyses resulted in nearly identical factors, thus the PCA results are reported here to be consistent with prior work in healthy individuals [22]. The optimal solution of the 19 QST measures resulted in four components based on examination of the eigenvalues (greater than 1.0), the scree plot (see Figure 1), and interpretability of the components. The rotated factor loadings for each of the QST variables are provided in Table 2. Factor loadings for the residualized data were extremely similar (see supplemental materials, Table S1). The QSTs factored primarily by modality, rather than test site: heat (threshold and tolerance); punctate (von Frey pain ratings); temporal summation (of noxious heat); and pressure (PPTs), explaining 75.5% of the variance observed (74.1% for the residualized data). However, heat temporal summation factored independently of heat threshold and tolerance. All QST assessments loaded strongly on only one component, with no significant co-loadings, indicating a clear and readily interpretable structure. The heat and pressure components were most strongly correlated, and there was a weak, but significant correlation between punctate and pressure components for the original (Table 3) and residualized data (see supplemental materials, Table S2).
Figure 1.

Scree plot showing eigenvalues for each component number. The horizontal gray dashed line represents an eigenvalue of 1.0. Four factors have eigenvalues over 1.0, are above the “elbow” and explain approximately 75% of the variance observed using the original (blue circles) and residualized (red diamonds) data.
Table 2.
Rotated factor loadings of the original QST data using Principal Components Analysis with Oblimin Rotation; four components explain 75.5% of the variance in the QST data.
| QST | Heat Sensitivity | Punctate Sensitivity | Temporal Summation | Pressure Sensitivity |
|---|---|---|---|---|
| Heat Pain Threshold – Surg Knee | .775 | .092 | −.006 | .074 |
| Heat Pain Threshold – Surg Tibia | .847 | −.011 | .042 | −.101 |
| Heat Pain Threshold – Cont Knee | .764 | .034 | .071 | .148 |
| Heat Pain Threshold – Cont Tibia | .812 | −0.58 | .020 | −.031 |
| Heat Pain Tolerance – Surg Knee | .804 | .062 | −.024 | .070 |
| Heat Pain Tolerance – Surg Tibia | .848 | −.073 | −.042 | −.034 |
| Heat Pain Tolerance – Cont Knee | .797 | .011 | −.052 | .080 |
| Heat Pain Tolerance – Cont Tibia | .884 | −.015 | −.049 | −.046 |
| Von Frey pain – Surg Knee | .000 | .878 | .062 | −.078 |
| Von Frey pain – Surg Tibia | .021 | .924 | .063 | −.027 |
| Von Frey pain – Cont Knee | .059 | .878 | −.001 | −.043 |
| Von Frey pain – Cont Tibia | −.067 | .812 | −.128 | .091 |
| Heat Temporal Summation – Surg Knee | .098 | −.085 | −.900 | −.021 |
| Heat Temporal Summation – Surg Tibia | .041 | .023 | −.922 | .021 |
| Heat Temporal Summation – Cont Knee | −.103 | .066 | −.879 | −.030 |
| Pressure Pain Threshold – Surg Knee | .089 | −.014 | .054 | .780 |
| Pressure Pain Threshold – Surg Tibia | −.043 | −.024 | .025 | .945 |
| Pressure Pain Threshold – Cont Knee | .017 | −.015 | −.020 | .883 |
| Pressure Pain Threshold – Cont Tibia | −.002 | .000 | −.023 | .927 |
Note: Original factor loadings are provided, prior to reverse scoring factors 1, 3, and 4 to make higher values represent greater sensitivity. Absolute factor loadings ≥ 0.30 are in bold.
Abbreviations: QST=Quantitative Sensory Testing; Surg=surgical; Contr=contralateral.
Table 3.
Pearson’s correlation coefficients between Pain Sensitivity Components (N=218) using original QST data.
| Components | 1. Heat | 2. Punctate | 3. Temporal Summation | 4. Pressure |
|---|---|---|---|---|
| 1. Heat | 1.0 | |||
| 2. Punctate | 0.058 | 1.0 | ||
| 3. Temp Summation | −0.128 | 0.121 | 1.0 | |
| 4. Pressure | 0.453** | 0.192* | 0.101 | 1.0 |
Significant correlations in bold.
P < 0.01;
p < 0.001
3.3. Cluster Analysis
The clustering algorithm resulted in five sensitivity profiles, using components based on either original (Figure 2A) or residualized (Figure 2B) data. Patients with advanced knee OA grouped largely into either average (within 0.5 SD of the mean), low (more than 0.75 SD below the mean) or high (more than 0.75 SD above the mean) pain sensitivity clusters.
Figure 2.

Five pain sensitivity profiles (clusters) emerged based on standardized pain sensitivity scores (mean, SE) using A) original data and B) data residualized by age and sex. One low pain sensitivity, one average pain sensitivity, and three high pain sensitivity profiles resulted using either methodology, with minor differences between them.
Cluster differences were confirmed using analysis of variance to compare the pain sensitivity components used to generate the clusters (see Figure 2), as well as the between-group differences in the original QST assessments (see Figure 3; mean (SD) QST values for each cluster are provided in Table S5). Knee hyperalgesia (increased QST pain sensitivity) was observed for most QST variables (see Figure 3) relative to the ipsilateral or contralateral tibia, but not equally across the pain sensitivity phenotypes. Between-cluster differences in the residualized QST variables are also provided in the supplementary materials (see Figure S1). Using discriminant analysis, the five-cluster result was cross-validated using a one-left out analysis resulting in an average of 83.0% and 87.2% of cases being correctly classified for the original and residualized data cluster solutions, respectively, supporting the five-cluster solutions.
Figure 3.
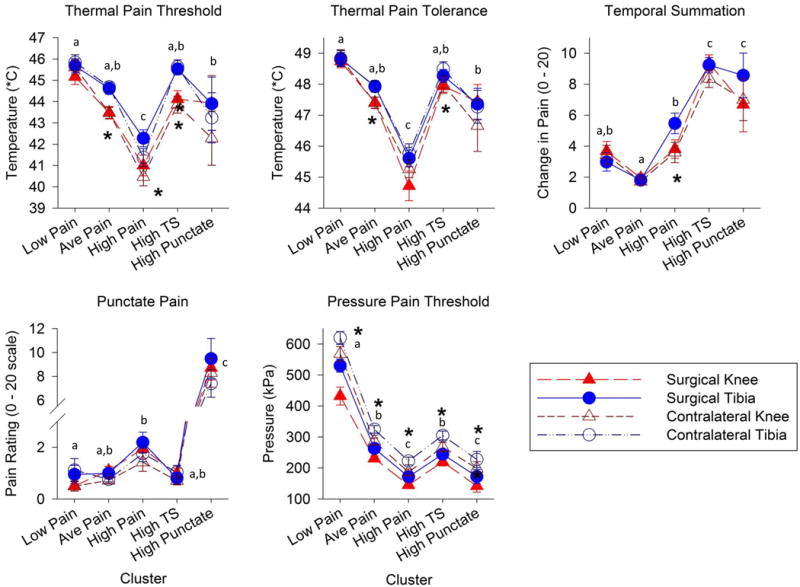
Quantitative sensory testing (QST) data (mean, SE) shown by pain sensitivity profiles, where Low Pain = low pain sensitivity, Ave Pain = average pain sensitivity, High Pain = high heat and pressure pain sensitivity, High TS = high temporal summation sensitivity, and High Punctate = high punctate sensitivity. * indicate significant (p≤0.01) between-test site differences (surgical or contralateral, knee or tibia) and letter superscripts (a, b, c) indicate Tukey’s post-hoc findings, where profiles with the same letters are not significantly different.
3.3.1. Low Pain Sensitivity Profile
Only one cluster of individuals was identified as exhibiting “low pain” sensitivity (n = 40, 18.3%). This group of individuals had notably low pressure pain sensitivity, with a z-score of −1.71 (1.71 SD below the population mean) but also moderately low heat pain sensitivity (z-score −0.68). Temporal summation (z = −0.22) and punctate (z = −0.27) sensitivity were average in this otherwise low-pain sensitivity profile. Pressure pain hyperalgesia of the surgical knee relative to the contralateral knee was most notable for the low pain sensitivity profile (see Figure 3).
3.3.2 Average Pain Sensitivity Profile
The largest cluster was identified as having “average pain” sensitivity across all four QST factors (n=84, 38.5% of the cohort). This cluster of individuals exhibited average pain sensitivity to heat, pressure, and punctate stimuli. This group was also least likely to temporally summate, having a moderately low z-score of −0.62 for the temporal summation factor.
3.3.3 High Pain Sensitivity Profiles
Three clusters were identified that exhibited high pain sensitivity, but to different modalities. A “high temporal summation” profile (n=45, 20.6%) showed the greatest temporal summation of any group, with a z-score of 1.18. However, this profile demonstrated average pain sensitivity for the remaining three QST factors (within 0.37 SD of the mean). A “high heat and pressure pain” profile (n= 39, 17.9%) was the most sensitive group to heat pain (z-score 1.22) and exhibited moderately elevated pressure pain sensitivity (z-score 0.83). Yet, the temporal summation and punctate sensitivities in this high heat and pressure pain cluster were average (z-score < 0.21 SD). Lastly, a “high punctate pain” profile was the third but smallest high pain sensitivity cluster (n=10, 4.6%). This cluster of individuals was 3.4 SD above the mean on pain ratings in response to the punctate (von Frey) stimulus and was also moderately sensitive to pressure pain (z-score = 0.78) and temporal summation (z-score = 0.79), yet average for heat pain sensitivity (z-score 0.25). For the three high sensitivity pain profiles, both knees exhibited similar QST values, but were more sensitive than tibia responses (Figure 3).
3.3.4 Residualized Cluster Profiles
The residualized data also resulted in five clusters consisting of a low pain sensitivity profile, an average pain sensitivity profile and three high pain sensitivity profiles, but a few differences are apparent (see Figure 2). The primary difference was that the residualized cluster solution had two profiles exhibiting high temporal summation, whereas the original cluster solution had only one. The high heat and pressure pain sensitivity profile also demonstrated high temporal summation after residualization, whereas in the original solution, this profile did not exhibit high temporal summation.
3.3.5 Demographic and Clinical Differences between Profiles
There were no significant differences in demographic variables between pain sensitivity profiles except sex for the original data (Table 4) or race for the residualized data (see supplementary materials, Table S3). Men made up only 36% of the total included cohort, but comprised 77% of the low pain sensitivity phenotype prior to data residualization. QST components relative to age- and sex- averages (residualized data) equalized sex across clusters: men comprised from 27% to 41% of each cluster. However, after residualization, non-white and/or hispanic individuals were more likely to be in two of the high pain profiles (16% to 20% versus 0 – 2% observed in the other three profiles).
Table 4.
Patient Demographic Characteristics (mean, SD or frequency, %) by cluster profile.
| Preoperative Characteristics | Low Pressure Pain Profile (n=40) | Average Pain Profile (n=84) | High Heat & Pressure Pain Profile (n=39) | High Temp Summation Profile (n=45) | High Punctate Pain Profile (n=10) | Statistic | P value |
|---|---|---|---|---|---|---|---|
| Age (years) | 60.3 ± 7.7 | 61.4 ± 11.2 | 59.8 ± 8.8 | 64.8 ± 9.7 | 62.3 ± 11.2 | F4,217=1.10 | 0.359 |
| Sex | |||||||
| Female | 9 (23%)a | 58 (69%)b | 31 (79%)b | 33 (73%)b | 9 (90%)b | X2(4,218)=39.6 | <0.0001* |
| Male | 31 (77%) | 26 (31%) | 8 (21%) | 12 (27%) | 1 (10%) | ||
| Marital Status | n=36 | n=79 | n=35 | n=41 | |||
| Married/SO | 31 (86%) | 52 (66%) | 20 (57%) | 29 (70%) | 5 (50%) | X2(4,201)=9.1 | 0.058 |
| Never/Divorce/Wid | 5 (14%) | 27 (34%) | 15 (43%) | 12 (30%) | 5 (50%) | ||
| Race/Ethnicity (Non-Hispanic/Caucasian) | 39 (98%) | 83 (99%) | 36 (92%) | 44 (98%) | 9 (90%) | X2(4,218)=5.3 | 0.257 |
| Education | n=36 | n=79 | n=35 | n=41 | X2(8,201)=19.5 | 0.012 | |
| ≤ High School | 10 (28%) | 22 (28%) | 8 (23%) | 18 (44%) | 2 (20%) | ||
| Some College | 9 (25%) | 21 (26%) | 13 (37%) | 4 (10%) | 7 (70%) | ||
| ≥ College Degree | 17 (47%) | 36 (46%) | 14 (40%) | 19 (46%) | 1 (10%) | ||
| BMI (kg/m2) | 33.0 ± 5.4 | 33.5 ± 6.9 | 35.2 ± 7.0 | 33.8 ± 8.1 | 36.9 ± 9.0 | F4,217=1.05 | 0.384 |
| Co-Morbidities | n=83 | X2(8,217)=7.1 | 0.525 | ||||
| None | 13 (33%) | 19 (23%) | 8 (21%) | 6 (13%) | 2 (20%) | ||
| 1 – 2 | 19 (48%) | 36 (43%) | 17 (44%) | 20 (44%) | 5 (50%) | ||
| ≥ 3 | 8 (20%) | 28 (34%) | 14 (36%) | 19 (42%) | 3 (30%) |
Abbreviations: SO=Significant Other; Wid=Widowed; BMI=Body Mass Index;
Significance set at p ≤ 0.01. Proportions with the same superscript letter do not significantly differ between clusters, using Ward’s method.
Pain and function differed significantly between original pain sensitivity profiles, even after adjusting for age and sex as covariates (see Table 5). These results were blunted in the residualized data with pain differences no longer reaching significance at p<0.01 (p’s = 0.02 and 0.03, see supplemental materials, Table S4), while function remained significantly different. Pain ratings at rest and with movement (during ROM and gait) were highest in individuals exhibiting the high punctate pain sensitivity profile compared to the low, average, or high temporal summation sensitivity profiles, but were not significantly different than the high heat and pressure pain profile. Further, individuals in the high heat & pressure pain sensitivity profile exhibited significantly higher ROM pain than the low pain sensitivity profile only. Interestingly, those in the high temporal summation profile did not report greater pain than the average or low pain sensitivity profiles. Similarly, perceived pain and dysfunction was highest in the high punctate pain sensitivity profile (Table 5).
Table 5.
Patient Clinical Characteristics (mean, SD or frequency, %) by cluster profile, statistical differences adjusted for age and sex.
| Preoperative Characteristics | Low Pressure Pain Profile (n=40) | Average Pain Profile (n=84) | High Heat & Pressure Pain Profile (n=39) | High Temp Summation Profile (n=45) | High Punctate Pain Profile (n=10) | Statistic | P-value |
|---|---|---|---|---|---|---|---|
| GDS Depression Screen Positive (> 16) | 7/38 (18%) | 16/81 (20%) | 11/37 (30%) | 10/42 (24%) | 3/9 (33%) | X2(4,207)=2.45 | 0.65 |
| Trait Anxiety (20 - 80) | 31.8 ± 7.9 | 33.0 ± 8.4 | 36.9 ± 11.9 | 33.7 ± 7.9 | 38.0 ± 13.2 | F4,199 = 2.27 | 0.06 |
| Pain Catastrophizing (0 – 52) | 10.7 ± 9.5 | 10.0 ± 7.6 | 13.6 ± 11.3 | 11.0 ± 9.9 | 11.8 ± 11.0 | F4,205 = 0.92 | 0.45 |
| Severe OA, KL grade = 4 | 30 (75%) | 56 (67%) | 27 (69%) | 30 (67%) | 5 (50%) | X2(4,218)=2.52 | 0.64 |
| Pain Other Joints = Yes | 26 (65%) | 52 (62%) | 27 (69%) | 27 (60%) | 7 (70%) | X2(4,218)=1.10 | 0.89 |
| Pain Medication Use | |||||||
| Non-Opioids - Yes | 32 (80%) | 72 (86%) | 31 (80%) | 33 (73%) | 6 (60%) | X2(4,218)=5.43 | 0.25 |
| Opioids - Yes | 7 (18%) | 21 (25%) | 13 (33%) | 13 (29%) | 3 (30%) | X2(4,218)=2.90 | 0.58 |
| Pain Duration | n=38 | n=44 | X2(8,215)=3.77 | 0.88 | |||
| < 1 year | 2 (5%) | 7 (8%) | 2 (5%) | 3 (7%) | 0 (0%) | ||
| Couple or Few years | 14 (37%) | 27 (32%) | 17 (44%) | 19 (43%) | 5 (50%) | ||
| Several or Many yrs | 22 (58%) | 50 (60%) | 20 (51%) | 22 (50%) | 5 (50%) | ||
| Pain Ratings (0 – 20) | |||||||
| Resting pain | 2.3 ± 3.5a | 2.5 ± 3.5a | 4.2 ± 4.7a | 3.0 ± 3.5a | 8.3 ± 5.5b | F4,217 = 6.03 | 0.0001* |
| ROM Pain | 5.4 ± 4.4a | 7.4 ± 5.5a,b | 10.0 ± 5.9b,c | 6.5 ± 4.7a,b | 12.5 ± 4.6c | F4,217 = 5.17 | 0.001* |
| Gait Pain | 4.5 ± 5.0a | 5.6 ± 5.1a | 8.1 ± 6.2a,b | 5.3 ± 4.7a | 11.7 ± 6.0b | F4,215 = 4.00 | 0.004* |
| KOOS (0 – 100) | |||||||
| Symptoms | 49.9 ± 23.6 | 45.2 ± 16.3 | 42.2 ± 18.8 | 48.7 ± 17.5 | 34.3 ± 13.4 | F4,203 = 1.24 | 0.30 |
| Pain | 51.4 ± 20.4a | 47.5 ± 15.5a | 43.5 ± 17.1a | 46.6 ± 16.7a | 27.5 ± 13.7b | F4,203 = 3.44 | 0.01* |
| Function | 60.2 ± 17.2a | 57.5 ± 16.7a | 51.9 ± 17.9a | 52.0 ± 17.9a | 34.6 ± 16.7b | F4,199 = 4.66 | 0.001* |
| SF-36 (0 – 100) | |||||||
| Physical Health | 49.3 ± 18.6 | 42.8 ± 17.6 | 40.4 ± 18.6 | 41.8 ± 17.0 | 29.7 ± 14.9 | F4,205 = 1.70 | 0.15 |
| Mental Health | 70.3 ± 20.7 | 65.2 ± 18.8 | 56.8 ± 23.5 | 64.2 ± 21.4 | 53.7 ± 23.8 | F4,203 = 2.14 | 0.08 |
Abbreviations: OA=Osteoarthritis; ROM=Range of Motion; GDS=Geriatric Depression Scale; KOOS=Knee Injury and Osteoarthritis Outcomes Score; SF-36=Short Form 36 Health Survey
Significance set at p ≤ 0.01; ANCOVA analyses adjusted for age and sex, but unadjusted means (SD) shown for each group. Means with the same superscript letter do not significantly differ from each other, using Tukey’s post-hoc tests.
We did not see any significant between-group differences in radiographic knee OA severity (KL grade), presence of pain in other joints, pain medication use, self-reported pain duration, physical or mental health quality of life (SF-36), depression, anxiety, or pain catastrophizing.
4. Discussion
This study demonstrates individuals with advanced knee OA cluster into pain sensitivity profiles as hypothesized, with surprisingly similar clusters to those seen in healthy populations [9,22]. Thus, pain sensitivity heterogeneity is a robust finding even in a population with significant disease that exhibits both peripheral and central sensitivities. Further, pain intensity and function differed between these profiles, after adjusting for age- and sex, suggesting patients with advanced knee OA may benefit from individualized diagnosis and treatment.
Pain sensitivity components were differentiated by modality over location consistent with previous observations in healthy adults [9,22,40] and clinical populations with knee OA [10], back pain [8], and neuropathic pain [16,36]. Pressure and heat pain were the most strongly correlated components, which may be due to common activation of C-polymodal nociceptors that respond to both mechanical and heat stimuli [47]. This suggests their underlying neurophysiology is more closely related than punctate pain or temporal summation of heat pain. The independence of heat pain sensitivity from heat pain temporal summation seen here and elsewhere [9,22] and the enhanced pain response to repeated stimuli, supports the hypothesis that temporal summation indicates centrally-mediated sensitivity [42].
The low pressure pain sensitivity profile observed in patients with advanced knee OA was largely consistent with that seen in healthy adults, also overrepresented by males with few health or pain complaints and/or low Kohn’s Reactivity scores [9] and in a subgroup of knee OA patients that were also predominantly male [14]. Using pain sensitivity measures, pain intensity, and biochemical biomarkers to cluster knee OA patients, a previous study found a low pain profile and suggested that conservative treatment options may suffice for individuals in this profile [11]. However, here those with low pain sensitivity were scheduled for surgical intervention and had KL grades and medication use similar to those in more pain sensitive profiles. Interestingly, when the data were residualized by sex and age, a low pain profile continued to be distinguished even though pressure pain insensitivity was less prominent. These findings suggest that certain individuals with advanced knee OA experience lower pain sensitivity regardless of sex and age. Future studies are needed to determine optimal treatments for these individuals.
Individuals with a high pain sensitivity profile were not equally likely to experience greater pain or reduced function. Previously, in patients with knee OA, individuals with elevated temporal summation with or without high pressure pain sensitivity reported higher clinical pain [11], suggesting central sensitization may be involved. However, in the current cohort, the high temporal summation pain sensitivity profile was not associated with greater pain, whereas those with high punctate or high heat and pressure pain sensitivity were more likely to report greater knee pain. Differences in temporal summation methodology, i.e., sustained noxious heat versus intermittent pressure, or differences in the patient population, may partially explain this disparity. Further, enhanced punctate pain sensitivity may be an important, albeit rare, profile to screen for in patient populations as it was associated with the highest pain and poorest function. Although it was a small group and it is unknown whether this is predictive for later outcomes, this pain sensitivity assessment is quick and simple and could be easily adapted to clinical environments.
These pain sensitivity profiles may provide insight into the underlying neurophysiology and somatosensory processes involved in the transmission and modulation of afferent input that may contribute to heterogeneity in clinical characteristics, such as pain perception. For example, the high temporal summation phenotype may be indicative of central processes that are less dependent on peripheral input while the other two high pain sensitivity profiles may involve central processes that are more dependent on peripheral input and, therefore, associated with higher knee pain. The consistency of these pain sensitivity profiles with those in healthy adults further support their use as indicators of nociceptive processing, where individual differences occur regardless of the presence or absence of a pain condition, suggesting that some individuals may be at an increased or decreased risk of developing more severe symptoms, depending on how they transmit and/or modulate nociceptive input.
Somewhat surprising and contrary to prior cluster analyses with healthy adults [7,18] was the lack of relationship observed between pain sensitivity clusters and psychological traits. Significant correlations between pain and catastrophizing [28], anxiety [14,48], and depression [14,29] have been reported in patients with knee OA. However, our findings suggest that the pain sensitivity phenotypic differences in patients with advanced knee OA are not mediated by psychological traits.
QST is increasingly being used to examine differences in pain sensitivity in clinical pain populations compared to healthy controls. We know that patients with knee OA exhibit altered responses to most QST modalities compared to age-and sex-matched healthy controls, including reduced PPTs [20,27,30,35,58] and increased pressure [1] and heat [30] temporal summation. Even individuals with mild knee OA pain experience enhanced mechanical pain sensitivity compared to age- and sex-match controls [43]. However, heat pain thresholds are less consistent, with no differences [30,43,58] or a trend towards lower HPTs [35] previously observed in individuals with knee OA compared to controls. Greater pain sensitivity occurred at the knee than the tibia in one or more pain sensitivity profiles for all but the punctate modality, with the most notable difference in PPTs. The lack of difference between pain sensitivity between knees for the other assessments may suggest bilateral hypersensitivity or simply be a result of contralateral knee OA.
While men predominated in the low pressure pain profile, pain and function were significantly different between profiles after adjusting for age and sex covariates. The residualized QST values, i.e., relative to age and sex average QST, resulted in similar, albeit not identical, clusters, including a low pain sensitivity phenotype. While the between-cluster clinical characteristics were blunted after residualization, the fact that individuals with a relatively homogeneous advanced-stage pain condition continue to demonstrate low, average and high pain sensitivity profiles is a stable finding.
Recently, a single pain sensitivity index based on QST z-scores was proposed [2] to characterize the degree of hypersensitivity in this population. However, the varied pain sensitivity profiles observed in this patient cohort support the conclusion by Neziri et al. [40] that multimodal pain assessment is necessary for optimal patient characterization. Consequently, any one pain sensitivity measure in isolation may inadequately reflect the complexity of the underlying neurophysiology and heterogeneity observed in both healthy and clinical pain populations. Overall, these findings suggest there is clinical relevance to pain sensitivity profiles, consistent with other studies [41,55,59]. It is possible that individuals with advanced knee OA may benefit from different pharmacologic treatments, depending on their pain sensitivity phenotype. For example, those in the high temporal summation cluster may respond better to central pain treatments, such as antidepressants or anticonvulsants, than to NSAIDS. This study provides only the first steps in identifying pain phenotypes in a clinical population. Future studies are necessary to identify how these phenotypes improve patient care.
Several factors may limit the generalizability of these findings. First, missing data were not equally distributed across modalities; most missing data were in one or more of the heat pain sensitivity assessments due time constraints. Others were excluded for maximum initial pain ratings during the temporal summation test. Of note, a similar proportion were excluded for this reason previously in healthy young adults [22]. Further, no inhibitory pain sensitivity assessments were included. Although we attempted to assess conditioned pain modulation using a cold water conditioning stimulus, a large proportion of subjects (n=155) either did not tolerate or did not complete this assessment, thus we were unable to include it. The sample also lacked racial/ethnic variation. However, even with these small numbers, differences in race/ethnicity were found after residualizing by sex and age with a significantly higher percentage of minorities in two of the three high pain clusters. This result is consistent with prior studies showing African Americans to have high pain sensitivities [10,13,22].
In conclusion, this study extends pain sensitivity clusters first observed in healthy populations [9,22] to an older, clinical population experiencing pain and dysfunction associated with advanced knee OA. This translation of pain sensitivity profiles in a patient population suggests the unique individual differences described in healthy adults may be meaningful in a patient population. Despite the similarities between studies, it is unknown whether these pain sensitivities act as traits/enduring characteristics, or whether unique sensitivities develop subsequent to the onset of knee OA. Regardless, this study, coupled with the findings of Egsgaard et al. [11], suggests pain sensitivity profiles are a robust finding that may prove to be clinically important. Future longitudinal studies are needed to determine the predictive value of pain sensitivity profiles, with the goal of optimizing patient care through individualized pain management.
Supplementary Material
Supplemental Figure 1. Quantitative sensory testing (QST) data (mean, SE) shown by residualized pain sensitivity profiles, where Low Pain = low pain sensitivity, Ave Pain = average pain sensitivity, High Pain = high pain sensitivity, High TS = high temporal summation sensitivity, and High Punctate = high punctate sensitivity. * indicate significant (p≤0.01) between-test site differences (surgical or contralateral, knee or tibia) and letter superscripts (a, b, c) indicate Tukey’s post-hoc findings, where profiles with the same letters are not significantly different.
Acknowledgments
This study was supported in part by the National Institutes of Health (R01 NR009844), the University of Iowa and DJO, Inc.
Footnotes
The authors declare no competing financial interests.
References
- 1.Arendt-Nielsen L, Nie H, Laursen MB, Laursen BS, Madeleine P, Simonsen OH, Graven-Nielsen T. Sensitization in patients with painful knee osteoarthritis. Pain. 2010;149(3):573–581. doi: 10.1016/j.pain.2010.04.003. [DOI] [PubMed] [Google Scholar]
- 2.Arendt-Nielsen L, Egsgaard LL, Petersen KK, Eskehave TN, Graven-Nielsen T, Hoeck HC, Simonsen O. A mechanism-based pain sensitivity index to characterize knee osteoarthritis patients with different disease stages and pain levels. Eur J Pain. 2014 doi: 10.1002/ejp.651. [DOI] [PubMed] [Google Scholar]
- 3.Bartley EJ, King CD, Sibille KT, Cruz-Almeida Y, Riley JL, 3rd, Glover TL, Goodin BR, Sotolongo AS, Herbert MS, Bulls HW, Staud R, Fessler BJ, Redden DT, Bradley LA, Fillingim RB. Enhanced pain sensitivity among individuals with symptomatic knee osteoarthritis: Potential sex differences in central sensitization. Arthritis Care Res (Hoboken) 2015 doi: 10.1002/acr.22712. [DOI] [PMC free article] [PubMed] [Google Scholar]
- 4.Bedson J, Croft PR. The discordance between clinical and radiographic knee osteoarthritis: a systematic search and summary of the literature. BMC Musculoskelet Disord. 2008;9:116. doi: 10.1186/1471-2474-9-116. [DOI] [PMC free article] [PubMed] [Google Scholar]
- 5.Brazier JE, Harper R, Jones NM, O’Cathain A, Thomas KJ, Usherwood T, Westlake L. Validating the SF-36 health survey questionnaire: new outcome measure for primary care. BMJ. 1992;305(6846):160–164. doi: 10.1136/bmj.305.6846.160. [DOI] [PMC free article] [PubMed] [Google Scholar]
- 6.Chibnall JT, Tait RC. Pain assessment in cognitively impaired and unimpaired older adults: a comparison of four scales. Pain. 2001;92(1–2):173–186. doi: 10.1016/s0304-3959(00)00485-1. [DOI] [PubMed] [Google Scholar]
- 7.Collins NJ, Misra D, Felson DT, Crossley KM, Roos EM. Measures of knee function: International Knee Documentation Committee (IKDC) Subjective Knee Evaluation Form, Knee Injury and Osteoarthritis Outcome Score (KOOS), Knee Injury and Osteoarthritis Outcome Score Physical Function Short Form (KOOS-PS), Knee Outcome Survey Activities of Daily Living Scale (KOS-ADL), Lysholm Knee Scoring Scale, Oxford Knee Score (OKS), Western Ontario and McMaster Universities Osteoarthritis Index (WOMAC), Activity Rating Scale (ARS), and Tegner Activity Score (TAS) Arthritis Care Res (Hoboken) 2011;63(Suppl 11):S208–228. doi: 10.1002/acr.20632. [DOI] [PMC free article] [PubMed] [Google Scholar]
- 8.Coronado RA, Bialosky JE, Robinson ME, George SZ. Pain sensitivity subgroups in individuals with spine pain: potential relevance to short-term clinical outcome. Phys Ther. 2014;94(8):1111–1122. doi: 10.2522/ptj.20130372. [DOI] [PMC free article] [PubMed] [Google Scholar]
- 9.Cruz-Almeida Y, Riley JL, 3rd, Fillingim RB. Experimental pain phenotype profiles in a racially and ethnically diverse sample of healthy adults. Pain Med. 2013;14(11):1708–1718. doi: 10.1111/pme.12203. [DOI] [PMC free article] [PubMed] [Google Scholar]
- 10.Cruz-Almeida Y, Sibille KT, Goodin BR, Petrov ME, Bartley EJ, Riley JL, 3rd, King CD, Glover TL, Sotolongo A, Herbert MS, Schmidt JK, Fessler BJ, Staud R, Redden D, Bradley LA, Fillingim RB. Racial and ethnic differences in older adults with knee osteoarthritis. Arthritis Rheumatol. 2014;66(7):1800–1810. doi: 10.1002/art.38620. [DOI] [PMC free article] [PubMed] [Google Scholar]
- 11.Egsgaard LL, Eskehave TN, Bay-Jensen AC, Hoeck HC, Arendt-Nielsen L. Identifying specific profiles in patients with different degrees of painful knee osteoarthritis based on serological biochemical and mechanistic pain biomarkers: a diagnostic approach based on cluster analysis. Pain. 2015;156(1):96–107. doi: 10.1016/j.pain.0000000000000011. [DOI] [PubMed] [Google Scholar]
- 12.Feeney SL. The relationship between pain and negative affect in older adults: anxiety as a predictor of pain. J Anxiety Disord. 2004;18(6):733–744. doi: 10.1016/j.janxdis.2001.04.001. [DOI] [PubMed] [Google Scholar]
- 13.Fillingim RB. Individual differences in pain responses. Curr Rheumatol Rep. 2005;7(5):342–347. doi: 10.1007/s11926-005-0018-7. [DOI] [PubMed] [Google Scholar]
- 14.Finan PH, Buenaver LF, Bounds SC, Hussain S, Park RJ, Haque UJ, Campbell CM, Haythornthwaite JA, Edwards RR, Smith MT. Discordance between pain and radiographic severity in knee osteoarthritis: findings from quantitative sensory testing of central sensitization. Arthritis Rheum. 2013;65(2):363–372. doi: 10.1002/art.34646. [DOI] [PMC free article] [PubMed] [Google Scholar]
- 15.Fingleton C, Smart K, Moloney N, Fullen BM, Doody C. Pain sensitization in people with knee osteoarthritis: a systematic review and meta-analysis. Osteoarthritis Cartilage. 2015;23(7):1043–1056. doi: 10.1016/j.joca.2015.02.163. [DOI] [PubMed] [Google Scholar]
- 16.Freeman R, Baron R, Bouhassira D, Cabrera J, Emir B. Sensory profiles of patients with neuropathic pain based on the neuropathic pain symptoms and signs. Pain. 2014;155(2):367–376. doi: 10.1016/j.pain.2013.10.023. [DOI] [PubMed] [Google Scholar]
- 17.Gagliese L, Weizblit N, Ellis W, Chan VW. The measurement of postoperative pain: a comparison of intensity scales in younger and older surgical patients. Pain. 2005;117(3):412–420. doi: 10.1016/j.pain.2005.07.004. [DOI] [PubMed] [Google Scholar]
- 18.Gordon DB, Stevenson KK, Griffie J, Muchka S, Rapp C, Ford-Roberts K. Opioid equianalgesic calculations. J Palliat Med. 1999;2(2):209–218. doi: 10.1089/jpm.1999.2.209. [DOI] [PubMed] [Google Scholar]
- 19.Granot M, Granovsky Y, Sprecher E, Nir RR, Yarnitsky D. Contact heat-evoked temporal summation: tonic versus repetitive-phasic stimulation. Pain. 2006;122(3):295–305. doi: 10.1016/j.pain.2006.02.003. [DOI] [PubMed] [Google Scholar]
- 20.Graven-Nielsen T, Wodehouse T, Langford RM, Arendt-Nielsen L, Kidd BL. Normalization of widespread hyperesthesia and facilitated spatial summation of deep-tissue pain in knee osteoarthritis patients after knee replacement. Arthritis Rheum. 2012;64(9):2907–2916. doi: 10.1002/art.34466. [DOI] [PubMed] [Google Scholar]
- 21.Greenspan JD, Slade GD, Bair E, Dubner R, Fillingim RB, Ohrbach R, Knott C, Mulkey F, Rothwell R, Maixner W. Pain sensitivity risk factors for chronic TMD: descriptive data and empirically identified domains from the OPPERA case control study. J Pain. 2011;12(11 Suppl):T61–74. doi: 10.1016/j.jpain.2011.08.006. [DOI] [PMC free article] [PubMed] [Google Scholar]
- 22.Hastie BA, Riley JL, 3rd, Robinson ME, Glover T, Campbell CM, Staud R, Fillingim RB. Cluster analysis of multiple experimental pain modalities. Pain. 2005;116(3):227–237. doi: 10.1016/j.pain.2005.04.016. [DOI] [PubMed] [Google Scholar]
- 23.Herr KA, Spratt K, Mobily PR, Richardson G. Pain intensity assessment in older adults: use of experimental pain to compare psychometric properties and usability of selected pain scales with younger adults. Clin J Pain. 2004;20(4):207–219. doi: 10.1097/00002508-200407000-00002. [DOI] [PubMed] [Google Scholar]
- 24.Hoyl MT, Alessi CA, Harker JO, Josephson KR, Pietruszka FM, Koelfgen M, Mervis JR, Fitten LJ, Rubenstein LZ. Development and testing of a five-item version of the Geriatric Depression Scale. J Am Geriatr Soc. 1999;47(7):873–878. doi: 10.1111/j.1532-5415.1999.tb03848.x. [DOI] [PubMed] [Google Scholar]
- 25.Jensen MP, Turner JA, Romano JM. What is the maximum number of levels needed in pain intensity measurement? Pain. 1994;58(3):387–392. doi: 10.1016/0304-3959(94)90133-3. [DOI] [PubMed] [Google Scholar]
- 26.Jensen MP. The validity and reliability of pain measures in adults with cancer. J Pain. 2003;4(1):2–21. doi: 10.1054/jpai.2003.1. [DOI] [PubMed] [Google Scholar]
- 27.Kavchak AJ, Fernandez-de-Las-Penas C, Rubin LH, Arendt-Nielsen L, Chmell SJ, Durr RK, Courtney CA. Association between altered somatosensation, pain, and knee stability in patients with severe knee osteoarthrosis. Clin J Pain. 2012;28(7):589–594. doi: 10.1097/AJP.0b013e31823ae18f. [DOI] [PubMed] [Google Scholar]
- 28.Keefe FJ, Lefebvre JC, Egert JR, Affleck G, Sullivan MJ, Caldwell DS. The relationship of gender to pain, pain behavior, and disability in osteoarthritis patients: the role of catastrophizing. Pain. 2000;87(3):325–334. doi: 10.1016/S0304-3959(00)00296-7. [DOI] [PubMed] [Google Scholar]
- 29.Kim KW, Han JW, Cho HJ, Chang CB, Park JH, Lee JJ, Lee SB, Seong SC, Kim TK. Association between comorbid depression and osteoarthritis symptom severity in patients with knee osteoarthritis. J Bone Joint Surg Am. 2011;93(6):556–563. doi: 10.2106/JBJS.I.01344. [DOI] [PubMed] [Google Scholar]
- 30.King CD, Sibille KT, Goodin BR, Cruz-Almeida Y, Glover TL, Bartley E, Riley JL, Herbert MS, Sotolongo A, Schmidt J, Fessler BJ, Redden DT, Staud R, Bradley LA, Fillingim RB. Experimental pain sensitivity differs as a function of clinical pain severity in symptomatic knee osteoarthritis. Osteoarthritis Cartilage. 2013;21(9):1243–1252. doi: 10.1016/j.joca.2013.05.015. [DOI] [PMC free article] [PubMed] [Google Scholar]
- 31.Kittelson AJ, George SZ, Maluf KS, Stevens-Lapsley JE. Future directions in painful knee osteoarthritis: harnessing complexity in a heterogeneous population. Phys Ther. 2014;94(3):422–432. doi: 10.2522/ptj.20130256. [DOI] [PMC free article] [PubMed] [Google Scholar]
- 32.Knotkova H, Fine PG, Portenoy RK. Opioid rotation: the science and the limitations of the equianalgesic dose table. J Pain Symptom Manage. 2009;38(3):426–439. doi: 10.1016/j.jpainsymman.2009.06.001. [DOI] [PubMed] [Google Scholar]
- 33.Lautenbacher S, Kunz M, Strate P, Nielsen J, Arendt-Nielsen L. Age effects on pain thresholds, temporal summation and spatial summation of heat and pressure pain. Pain. 2005;115(3):410–418. doi: 10.1016/j.pain.2005.03.025. [DOI] [PubMed] [Google Scholar]
- 34.Lawrence RC, Felson DT, Helmick CG, Arnold LM, Choi H, Deyo RA, Gabriel S, Hirsch R, Hochberg MC, Hunder GG, Jordan JM, Katz JN, Kremers HM, Wolfe F. Estimates of the prevalence of arthritis and other rheumatic conditions in the United States. Part II. Arthritis Rheum. 2008;58(1):26–35. doi: 10.1002/art.23176. [DOI] [PMC free article] [PubMed] [Google Scholar]
- 35.Lee YC, Lu B, Bathon JM, Haythornthwaite JA, Smith MT, Page GG, Edwards RR. Pain sensitivity and pain reactivity in osteoarthritis. Arthritis Care Res (Hoboken) 2011;63(3):320–327. doi: 10.1002/acr.20373. [DOI] [PMC free article] [PubMed] [Google Scholar]
- 36.Maier C, Baron R, Tolle TR, Binder A, Birbaumer N, Birklein F, Gierthmuhlen J, Flor H, Geber C, Huge V, Krumova EK, Landwehrmeyer GB, Magerl W, Maihofner C, Richter H, Rolke R, Scherens A, Schwarz A, Sommer C, Tronnier V, Uceyler N, Valet M, Wasner G, Treede RD. Quantitative sensory testing in the German Research Network on Neuropathic Pain (DFNS): somatosensory abnormalities in 1236 patients with different neuropathic pain syndromes. Pain. 2010;150(3):439–450. doi: 10.1016/j.pain.2010.05.002. [DOI] [PubMed] [Google Scholar]
- 37.Miaskowski C, Cooper BA, Paul SM, Dodd M, Lee K, Aouizerat BE, West C, Cho M, Bank A. Subgroups of patients with cancer with different symptom experiences and quality-of-life outcomes: a cluster analysis. Oncol Nurs Forum. 2006;33(5):E79–89. doi: 10.1188/06.ONF.E79-E89. [DOI] [PubMed] [Google Scholar]
- 38.Moss P, Sluka K, Wright A. The initial effects of knee joint mobilization on osteoarthritic hyperalgesia. Man Ther. 2007;12(2):109–118. doi: 10.1016/j.math.2006.02.009. [DOI] [PubMed] [Google Scholar]
- 39.Neogi T, Frey-Law L, Scholz J, Niu J, Arendt-Nielsen L, Woolf C, Nevitt M, Bradley L, Felson DT. Sensitivity and sensitisation in relation to pain severity in knee osteoarthritis: trait or state? Ann Rheum Dis. 2015;74(4):682–688. doi: 10.1136/annrheumdis-2013-204191. [DOI] [PMC free article] [PubMed] [Google Scholar]
- 40.Neziri AY, Curatolo M, Nuesch E, Scaramozzino P, Andersen OK, Arendt-Nielsen L, Juni P. Factor analysis of responses to thermal, electrical, and mechanical painful stimuli supports the importance of multi-modal pain assessment. Pain. 2011;152(5):1146–1155. doi: 10.1016/j.pain.2011.01.047. [DOI] [PubMed] [Google Scholar]
- 41.Petersen KK, Arendt-Nielsen L, Simonsen O, Wilder-Smith O, Laursen MB. Presurgical assessment of temporal summation of pain predicts the development of chronic postoperative pain 12 months after total knee replacement. Pain. 2015;156(1):55–61. doi: 10.1016/j.pain.0000000000000022. [DOI] [PubMed] [Google Scholar]
- 42.Price DD, Staud R, Robinson ME, Mauderli AP, Cannon R, Vierck CJ. Enhanced temporal summation of second pain and its central modulation in fibromyalgia patients. Pain. 2002;99(1–2):49–59. doi: 10.1016/s0304-3959(02)00053-2. [DOI] [PubMed] [Google Scholar]
- 43.Rakel B, Vance C, Zimmerman MB, Petsas-Blodgett N, Amendola A, Sluka KA. Mechanical hyperalgesia and reduced quality of life occur in people with mild knee osteoarthritis pain. Clin J Pain. 2015;31(4):315–322. doi: 10.1097/AJP.0000000000000116. [DOI] [PubMed] [Google Scholar]
- 44.Rakel BA, Zimmerman MB, Geasland K, Embree J, Clark CR, Noiseux NO, Callaghan JJ, Herr K, Walsh D, Sluka KA. Transcutaneous electrical nerve stimulation for the control of pain during rehabilitation after total knee arthroplasty: A randomized, blinded, placebo-controlled trial. Pain. 2014;155(12):2599–2611. doi: 10.1016/j.pain.2014.09.025. [DOI] [PMC free article] [PubMed] [Google Scholar]
- 45.Riley JL, 3rd, Cruz-Almeida Y, Glover TL, King CD, Goodin BR, Sibille KT, Bartley EJ, Herbert MS, Sotolongo A, Fessler BJ, Redden DT, Staud R, Bradley LA, Fillingim RB. Age and race effects on pain sensitivity and modulation among middle-aged and older adults. J Pain. 2014;15(3):272–282. doi: 10.1016/j.jpain.2013.10.015. [DOI] [PMC free article] [PubMed] [Google Scholar]
- 46.Rinaldi P, Mecocci P, Benedetti C, Ercolani S, Bregnocchi M, Menculini G, Catani M, Senin U, Cherubini A. Validation of the five-item geriatric depression scale in elderly subjects in three different settings. J Am Geriatr Soc. 2003;51(5):694–698. doi: 10.1034/j.1600-0579.2003.00216.x. [DOI] [PubMed] [Google Scholar]
- 47.Schmidt R, Schmelz M, Torebjork HE, Handwerker HO. Mechano-insensitive nociceptors encode pain evoked by tonic pressure to human skin. Neuroscience. 2000;98(4):793–800. doi: 10.1016/s0306-4522(00)00189-5. [DOI] [PubMed] [Google Scholar]
- 48.Scopaz KA, Piva SR, Wisniewski S, Fitzgerald GK. Relationships of fear, anxiety, and depression with physical function in patients with knee osteoarthritis. Arch Phys Med Rehabil. 2009;90(11):1866–1873. doi: 10.1016/j.apmr.2009.06.012. [DOI] [PMC free article] [PubMed] [Google Scholar]
- 49.Sullivan MJ, Lariviere C, Simmonds M. Activity-related summation of pain and functional disability in patients with whiplash injuries. Pain. 2010;151(2):440–446. doi: 10.1016/j.pain.2010.08.005. [DOI] [PubMed] [Google Scholar]
- 50.Tousignant-Laflamme Y, Page S, Goffaux P, Marchand S. An experimental model to measure excitatory and inhibitory pain mechanisms in humans. Brain Res. 2008;1230:73–79. doi: 10.1016/j.brainres.2008.06.120. [DOI] [PubMed] [Google Scholar]
- 51.Vervoort T, Goubert L, Eccleston C, Bijttebier P, Crombez G. Catastrophic thinking about pain is independently associated with pain severity, disability, and somatic complaints in school children and children with chronic pain. J Pediatr Psychol. 2006;31(7):674–683. doi: 10.1093/jpepsy/jsj059. [DOI] [PubMed] [Google Scholar]
- 52.Weeks SK, McGann PE, Michaels TK, Penninx BW. Comparing various short-form Geriatric Depression Scales leads to the GDS-5/15. J Nurs Scholarsh. 2003;35(2):133–137. doi: 10.1111/j.1547-5069.2003.00133.x. [DOI] [PubMed] [Google Scholar]
- 53.Weissman-Fogel I, Granovsky Y, Crispel Y, Ben-Nun A, Best LA, Yarnitsky D, Granot M. Enhanced presurgical pain temporal summation response predicts post-thoracotomy pain intensity during the acute postoperative phase. J Pain. 2009;10(6):628–636. doi: 10.1016/j.jpain.2008.12.009. [DOI] [PubMed] [Google Scholar]
- 54.Werner MU, Duun P, Kehlet H. Prediction of postoperative pain by preoperative nociceptive responses to heat stimulation. Anesthesiology. 2004;100(1):115–119. doi: 10.1097/00000542-200401000-00020. discussion 115A. [DOI] [PubMed] [Google Scholar]
- 55.Wideman TH, Finan PH, Edwards RR, Quartana PJ, Buenaver LF, Haythornthwaite JA, Smith MT. Increased sensitivity to physical activity among individuals with knee osteoarthritis: relation to pain outcomes, psychological factors, and responses to quantitative sensory testing. Pain. 2014;155(4):703–711. doi: 10.1016/j.pain.2013.12.028. [DOI] [PubMed] [Google Scholar]
- 56.Witvrouw E, Pattyn E, Almqvist KF, Crombez G, Accoe C, Cambier D, Verdonk R. Catastrophic thinking about pain as a predictor of length of hospital stay after total knee arthroplasty: a prospective study. Knee Surg Sports Traumatol Arthrosc. 2009;17(10):1189–1194. doi: 10.1007/s00167-009-0817-x. [DOI] [PubMed] [Google Scholar]
- 57.Woolf CJ. Central sensitization: implications for the diagnosis and treatment of pain. Pain. 2011;152(3 Suppl):S2–15. doi: 10.1016/j.pain.2010.09.030. [DOI] [PMC free article] [PubMed] [Google Scholar]
- 58.Wylde V, Palmer S, Learmonth ID, Dieppe P. The association between pre-operative pain sensitisation and chronic pain after knee replacement: an exploratory study. Osteoarthritis Cartilage. 2013;21(9):1253–1256. doi: 10.1016/j.joca.2013.05.008. [DOI] [PubMed] [Google Scholar]
- 59.Wylde V, Sayers A, Lenguerrand E, Gooberman-Hill R, Pyke M, Beswick AD, Dieppe P, Blom AW. Preoperative widespread pain sensitization and chronic pain after hip and knee replacement: a cohort analysis. Pain. 2015;156(1):47–54. doi: 10.1016/j.pain.0000000000000002. [DOI] [PMC free article] [PubMed] [Google Scholar]
- 60.Yunus MB. Fibromyalgia and overlapping disorders: the unifying concept of central sensitivity syndromes. Semin Arthritis Rheum. 2007;36(6):339–356. doi: 10.1016/j.semarthrit.2006.12.009. [DOI] [PubMed] [Google Scholar]
Associated Data
This section collects any data citations, data availability statements, or supplementary materials included in this article.
Supplementary Materials
Supplemental Figure 1. Quantitative sensory testing (QST) data (mean, SE) shown by residualized pain sensitivity profiles, where Low Pain = low pain sensitivity, Ave Pain = average pain sensitivity, High Pain = high pain sensitivity, High TS = high temporal summation sensitivity, and High Punctate = high punctate sensitivity. * indicate significant (p≤0.01) between-test site differences (surgical or contralateral, knee or tibia) and letter superscripts (a, b, c) indicate Tukey’s post-hoc findings, where profiles with the same letters are not significantly different.