Abstract
Non-alcoholic fatty liver disease (NAFLD) is a major epidemics of the modern societies and has an inflammatory component in the pathogenesis. However, approved anti-inflammatory therapies are not currently available for the prevention of the transition from simple steatosis to non-alcoholic steatohepatitis (NASH). We aimed to test if a Chinese herb-derived compound, emodin could halt the simple steatosis to NASH transition. LDLR−/− mice were fed a western-type diet for 10 weeks; and during the last four weeks, the mice were intra-peritoneally injected daily with LPS with or without emodin. Systemic inflammation was evaluated by measurement of serum levels of cytokines and chemokines and flow cytometric analysis of spleen leukocytes. Liver inflammation was determined by histology, immunocytochemistry and flow cytometry. Quantitative real-time PCR and Western blot were performed to examine the effects of emodin on LPS-induced inflammatory responses in macrophages. Our data showed that emodin ameliorated systemic inflammation, reduced inflammatory cell infiltration in the liver, and attenuated liver function impairment. In vitro experiments showed emodin inhibited LPS-induced expression of proinflammatory cytokines in macrophages through suppressing Erk1/2 and p38 signaling. In conclusion, emodin inhibited the transition from simple steatosis to NASH in hyperlipidemic mice challenged with LPS through suppressing systemic and macrophage inflammation. Emodin may be developed as a therapy for NAFLD by the virtue of its anti-inflammatory effects.
Keywords: Emodin, inflammation, macrophage, NAFLD, cytokine
Introduction
Metabolic syndrome, mainly due to overnutrition and physical inactivity, results in many human diseases including non-alcoholic fatty liver disease (NAFLD) and atherosclerosis.1 NAFLD has become the most common form of chronic liver disease and one of the leading causes of death worldwide2–4 and it is considered as a key component of metabolic syndrome.5,6 NAFLD comprises a spectrum of disorders ranging from simple steatosis to non-alcoholic steatohepatitis (NASH), fibrosis, and cirrhosis, and eventually hepatocellular carcinoma (HCC).2 While simple steatosis has a benign clinical course, cirrhosis and HCC are among the most devastating human diseases. The transition from simple steatosis to NASH is the crucial step in the evolution from the benign to malignant end of the spectrum. A “two-hit” model suggests that after a first hit by hepatic steatosis and insulin resistance, a second hit is needed to develop NASH.7 The second hit is mostly derived from gut8–11 and adipose tissue,12–14 including lipopolysaccharide (LPS), proinflammatory adipokines, and toxic lipids, leading to liver inflammation. Blocking the inflammatory responses of liver to the second hit is critical to preventing the transition from simple steatosis to NASH and further to cirrhosis and HCC. However, the underlying cellular and molecular mechanisms of the transition have just begun to be understood, and currently there are no proven therapeutic strategies to effectively block the transition.
Emodin [1,3,8-trihydroxyl-6-methylanthraquinone], an active compound isolated from several Chinese herbs including Rheum emodi, which is traditionally used as a laxative agent, has been demonstrated to exert multiple biological benefits in vitro and in animal models.15–17 Its effects include body weight reduction, lipid lowering, blood glucose control, and anti-inflammation.18,19 Due to these multiple biological activities, it is expected that emodin may yield beneficial effects on metabolic syndrome-related diseases, including NAFLD and atherosclerosis, in which obesity, hyperlipidemia, insulin resistance, and inflammation collectively contribute to the pathogenesis. Indeed, a limited number of animal studies have initially shown promise of emodin in the treatment of these diseases.18–21 To further investigate the potential benefits of emodin, in this study we used a mouse model to examine if emodin administrated through an intra-peritoneal administration route can ameliorate NAFLD, focusing on examining the contribution of the anti-inflammatory component of emodin’s multiple biological activities.
Materials and methods
Animals
LDLR−/− mice were obtained from Jackson Laboratories (Bar Harbor, Maine). Animal care and experiments were approved by the Institutional Animal Care and Use Committee (IACUC) at University of South Carolina. Female six-week-old LDLR−/− mice were placed on a high fat western type diet (HFD, 21% anhydrous milkfat, 34% sucrose, and a total of 0.2% cholesterol) (Harlan Laboratories, Indianapolis, IN, USA) for 10 weeks. During the last four weeks of HFD feeding, LPS (10 µg per mouse) with or without emodin (40 mg kg−1) was intra-peritoneally (i.p.) administered once daily. The mice were sacrificed at the end point and the blood, liver, and spleen were collected and analyzed.
Measurement of emodin quality
Emodin was purchased from Zelang Pharmaceutical Co., Ltd. (Nanjing, China) and was further characterized by NMR spectroscopy and mass spectrometry. NMR spectra were recorded on Varian Mercury 300 spectrometers using DMSO as the solvent (10 mM). Mass spectrometry was measured on an hp 5986 spectrometer in positive mode.
Plasma emodin concentration measurement
Mice were injected with emodin (40 mg kg−1) i.p. The mice were sacrificed after a specified amount of time and their plasma was collected. Plasma was divided into three aliquots. For emodin glucuronide quantification, the plasma was mixed with equal volume of glucuronidase (1000 units mL−1 in pH 5 acetate buffer), half volume of ascorbic acid (100 mg mL−1), and incubated at 37°C for 4 h. For emodin sulfate quantification, plasma was mixed with equal volume of sulfatase (containing 1000 units mL−1 of sulfatase and 300 units mL−1 of β-glucuronidase in pH 5.0 acetate buffer), half volume of ascorbic acid (100 mg mL−1), and incubated at 37°C for 4 h. After incubation, the mixture was added with 50 µL of 0.1 N HCl and extracted with 600 µL of ethyl acetate (three times). The ethyl acetate layer was evaporated under N2 gas to dryness and reconstituted with 100 µL acetonitrile, which was subjected to HPLC-MS analysis. For free form emodin quantification, the plasma was mixed with equal volume of acetate buffer (pH5.0) without incubation, and processed as the procedure described above.
For HPLC-MS, the mobile phase comprised 90% acetonitrile and 10% water. The flow rate was 0.2 mL min−1, and the negative mode was used for the MS (ESI) detection. According to the standard curve of emodin in acetonitrile, the concentration of emodin was calculated. To estimate the total emodin concentration, the sum of free emodin, emodin glucuronide, and emodin sulfate was subtracted by two times of free emodin concentration.
ALT measurement
Liver function was evaluated by measuring plasma alanine amino transferase (ALT) levels. Blood was collected at day 56, then again at the experimental end point (day 70). ALT levels were measured using a Liquid ALT (SGPT) Reagent Set (Pointe Scientific, Inc. Canton, MI, USA) according to the manufacturer’s instructions.
Tissue cholesterol content measurement
The liver cholesterol content was detected by an Intracellular Cholesterol Quantitation Kit (Sigma-Aldrich, St-Louis, MO) according to the manufacturer’s instruction. Briefly, liver tissue was weighed and then homogenized followed by being pretreated in the mix of chloroform:isoporpanol:IGEPAL CA-630 (7:11:0.1) at room temperature for 10 min. The samples were centrifuged at 13,000 g for 10 min to remove insoluble material. Then the organic phase was transferred to new tubes and air dried at 50°C for 30 min to remove chloroform, followed by blowing the samples with nitrogen to remove any residue organic solvent. After dried, the lipid was dissolved with 200 µL of the Cholesterol Assay Buffer and then diluted into 30× by this buffer for each sample. Then, 50 µL of the reaction mix was added to each 50 µL standard and sample well in a 96-well plate, and incubated for 60 min at 37°C in dark. The absorbance was detected with a Spectra Max M5 Microplate Reader (Molecular Devices, Sunnyvale, CA, USA) at OD 570 nm. Concentration of cholesterol in sample was calculated by dividing the amount of cholesterol by the sample weight.
Serum lipid and glucose measurement
Serum cholesterol and triglyceride levels were measured using enzymatic colorimetric assays with Cholesterol Reagent and Triglycerides GPO reagent kits (Raichem, San Diego, CA, USA). Plasma cholesterol lipoprotein profiles were determined by a fast-performance liquid chromatography (FPLC) system, an AKTA purifier (GE Healthcare Biosciences, Pittsburgh, PA, USA) equipped with a Superose 6 10/300 GL column (GE Healthcare). Pooled mouse serum (100 µL) was loaded onto the column, and eluted at a constant flow rate of 0.5 mL min−1 with 1 mM sodium EDTA and 0.15 M NaCl. Fractions of 0.5 mL were collected and cholesterol concentration from each fraction was measured using enzymatic colorimetric assays. Blood glucose concentration was measured using OneTouch Ultra Blood Glucose Monitoring System (LifeScan, Inc., Milpitas, CA) following the manufacturer’s instructions.
Cell isolation from liver and spleen
The liver and spleen from each mouse were collected and weighed. Half of each organ was used for flow cytometry analysis. Liver infiltrating cells were isolated using a percoll gradient (Sigma). First, the liver was homogenized using mechanical disruption. Then the cells were re-suspended in 33% percoll diluted with 2% FBS/PBS staining buffer. Following centrifugation (2000 rpm for 15 min), the supernatant was removed and the pellet was washed and resuspended in staining buffer. Splenocytes were isolated by mechanical disruption of the spleen. The splenocytes were then washed and re-suspended in staining buffer.
Flow cytometry
The splenocytes and isolated liver infiltrating cells were stained with anti-ly6C FITC mAb, anti-CD11b PE mAb, anti-ly6G FITC mAb, anti-CD4 FITC mAb, anti-CD8a FITC mAB, anti-CD3 PE mAb, and anti F4/80 FITC mAB (all from eBioscience) in staining buffer. The cells were stained for 30 min on ice in the dark. The samples were washed with staining buffer two times and analyzed by flow cytometry using a Cytomics FC 500 flow cytometer and CXP software version 2.2 (Beckman coulter, Brea, CA, USA). Data were collected for 10,000 live events per sample.
Histology
The organs were flushed with PBS then harvested from the mice. Part of the liver was fixed in 4% paraformaldhyde for 24 h. The tissues were then embedded in paraffin and cut into 5 -µm sections used for H&E staining (hematoxylin, GeneTex, Inc.; eosin, Sigma-Aldrich). Part of the liver tissue was fixed in OCT at −20°C. Using a cryostat, 5 or 10 µm thick liver tissue sections were collected for immunofluorescence analysis or Oil Red-O staining. The Oil Red-O staining positive area was quantified using software MetaMorph (Molecular Devices, Sunnyvale, CA, USA).
Immunofluorescence
The OCT fixed frozen tissues were cut into 5 µm thick sections; and the sections were mounted onto glass slides. The slices were first fixed in 4% paraformaldehyde for 2 min; then incubated in 0.01 M glycine three times for 30 min and in PBS with 5% BSA for 30 min. The sections were then stained with anti-F4/80 (1:200, eBioscicence, San Diego, CA, USA) or anti-Gr1 (1:200, eBioscicence) overnight at 4°C. The sections were washed with PBS then stained with DAPI (1:1000 in PBS) for 2 min. The stained sections were imaged using a Nikon E600 fluorescent microscope. We counted the number of positively stained cells in 6–12 random fields of indicated magnification per section.
TUNEL staining
TdT-mediated dUTP-biotin nick end labeling (TUNEL) staining was used to determine programmed cell death, or apoptosis. The tissue sections were deparaffinized and rehydrated. TUNEL staining was accomplished by using an In Situ Cell Death Detection Kit (Roche, Mannheim, Germany) according to the manufacturer’s instruction. From each section, 10 randomly selected fields (100×) were photographed with a Laser Scanning Fluorescence Microscope (Eclipse E600, Nikon, Japan). The number of TUNEL-positive cells in each field were counted using the software Image-Pro Plus 6.0 (Media Cybernetics, Rockville, MD, USA) and divided by the field area. The average apoptotic cell density of the 10 fields was then obtained for each mouse.
Bioplex analysis of serum cytokines/chemokines
Mouse serum levels of 23 cytokines/chemokines were measured using a Bio-Plex Pro™ Mouse Cytokine 23-plex Assay (Bio-Rad) on a Bio-Plex system following the manufacturer’s instructions.
Macrophage culture and treatment
Mice were injected with 3 mL of 3% thioglycollate in sterile PBS intra-peritoneally. After three days, the mice were euthanized and the peritoneal cavity was washed with 10 mL PBS twice. The cells were suspended in DMEM with 10% FBS and plated in 12 well plates. After 2 h, all non-adherent cells were removed by washing with PBS and the adherent macrophages were cultured overnight in serum-free DMEM. Cells were then treated with LPS with or without emodin for 6 or 24 h in serum-free DMEM.
Quantitative real-time PCR
Peritoneal macrophages were incubated with serum-free DMEM containing LPS (50 ng mL−1) with or without emodin (25 µM) for 6 h. Trizol was used to extract total RNA according to the standard protocol. RNA was reverse transcribed into cDNA using first strand cDNA Synthesis System (OriGene Technologies, Inc., Rockville, MD, USA). Quantitative real-time PCR (qPCR) measurements of target mRNA levels was performed on an Eppendorf Realplex2 Mastercycler (Eppendorf, Hamburg, Germany) according to the manufacturer’s instructions. The following primers were used for qPCR: Mouse 18 s: 5′ CGCGGTTCTATTTTGTTGGT 3′ (forward) and 5′ AGTCGGCATCGTTTATGGTC 3′ (reverse); mouse TNFα: 5′CGTCAGCCGATTTGCTATCT 3′ (forward) and 5′ CGGACTCCGCAAAGTCTAAG 3′ (reverse); mouse IL-6: 5′ AGTTGCCTTCTTGGGACTGA 3′ (forward) and 5′ TCCACGATTTCCCA GAGAAC 3′ (reverse); mouse IL-1β: 5′ GCCCATCCTCTGTGACTCAT 3′ (forward) and 5′AGGCCACAGGTATTTTGTCG 3′ (reverse); mouse iNOS: 5′ CACCTTGGAGTTCACCCAGT 3′ (forward) and 5′ACCACTCGTACTTGGGATGC 3′ (reverse).
Western blotting analysis
Peritoneal macrophages were incubated with serum-free DMEM containing LPS (50 ng mL−1) with or without emodin (25 µM), or a vehicle control for 24 h. Protein was collected from the cells using cell lysis buffer (Cell signaling, Danvers, MA, USA) with a protease inhibitor cocktail (Sigma) added. After quantitation of protein concentration by Lowry assay, 30 µg of protein was loaded onto 4–20% SDS-PAGE gels for electrophoresis. The size separated proteins were then transferred to nitrocellulose membranes. The membranes were blocked for 1 h at room temperature with 5% non-fat dry milk, and then the proteins were blotted with primary antibodies against p-Erk1/2, total Erk1/2, p-P38, total P38, or β-actin, and then with corresponding HRP-conjugated secondary antibodies (all antibodies were purchased from Millipore, Billerica, MA or Cell signaling, Danvers, MA, USA).
Statistical analysis
The data are presented as the mean ± standard error of the mean (SEM). Statistical significance was calculated by use of Student’s t test (two-group comparison) or one-way analysis of variance (one-way ANOVA, for multiple group comparison) using the GraphPad Prism statistical program (GraphPad Prism, GraphPad Software, Inc., San Diego, CA, USA). P < 0.05 was considered significant.
Results
Emodin quality confirmation and serum emodin concentration determination
We confirmed the purity and structure of emodin used in this study by mass spectrometry (MS) and 1H NMR, respectively. The results of the MS showed that the compound was highly pure with correct molecular weight. Likewise, the results of the 1H NMR agreed with the structure of emodin (data not shown).
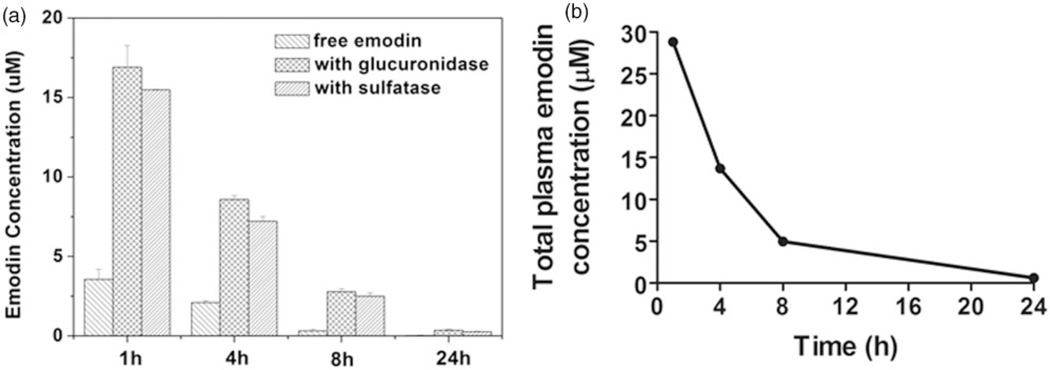
To measure serum emodin concentration, a single dose i.p. injection of emodin with 40 mg kg−1 was given to mice and the plasma was collected after 1 h, 4 h, 8 h, and 24 h. The results showed that emodin was cleared from the mice fairly rapidly (Figure 1). At 1 h post-injection, the concentration of emodin in plasma is ~30 µM (including both free and bioactive conjugated forms); the concentration dropped to below 1 µM after 24 h.
Figure 1.
Serum Emodin concentration measurement. (a) Serum concentrations of free emodin and conjugated forms were determined as described in the Materials and Methods section. (b) Total bioactive emodin concentration was calculated as described in Materials and Methods section
Emodin did not affect food uptake, body weight, and serum lipids and glucose levels
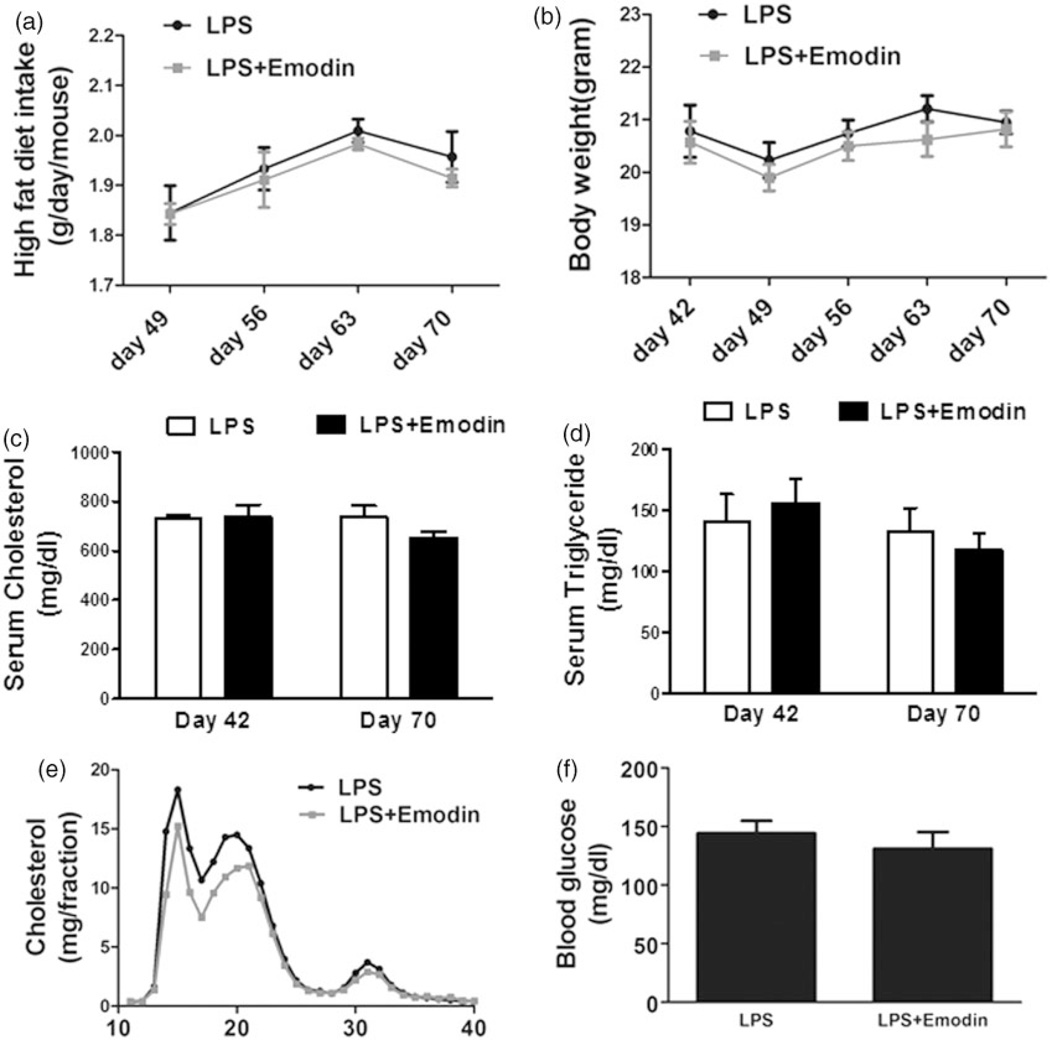
To promote development of NAFLD and atherosclerosis, LDLR−/− mice were placed on a high fat diet to cause hyperlipidemia for 10 weeks. During the last four weeks, the mice were divided into two groups. In the control group, mice were i.p. injected with LPS (10 µg/mouse) once daily, while in the emodin group, along with LPS, emodin (40 mg kg−1) was also injected once daily. The food uptake and body weight of the mice were monitored weekly and we found no significant differences between the two groups over the course of the experiment (Figure 2(a) and (b)). Serum total cholesterol and triglyceride levels were measured at the six-week and end time points, while serum lipoprotein FPLC profile and serum glucose levels were measured at the end time point. No significant differences in these parameters were detected between the control and emodin groups (Figure 2(c) to (f)).
Figure 2.
Emodin did not alter mouse food intake, body weight, serum lipids and blood glucose levels. Six-week-old female LDLR−/− mice were fed a high fat diet for 10 weeks. During the last four weeks, the mice were injected LPS with or without emodin once daily. (a) At the end of each indicated week, mouse food intake was monitored. The average daily intake of high fat diet per mouse during the week was calculated. (b) At the indicated days of high fat diet feeding, mouse body weights were measured. (c and d) At indicated days, mouse serum cholesterol (c) and triglyceride (d) levels were measured. (e) Pooled serum samples from mice at the experimental end point were analyzed for the lipoprotein profile using FPLC. Cholesterol content in each faction was determined. (f) Fasting blood glucose levels of mice at the experimental end point were measured. n=10 for each group
Emodin suppressed systemic inflammation in mice
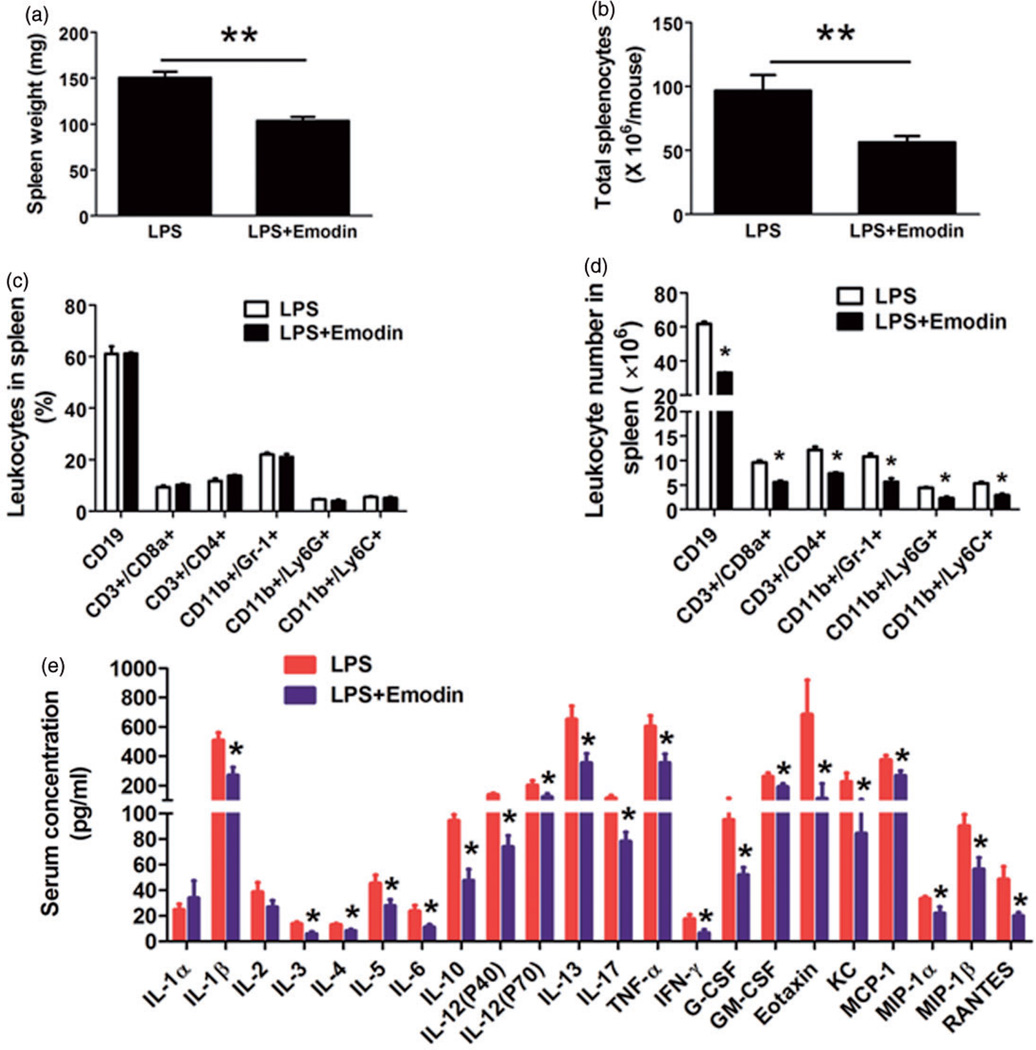
In order to examine if emodin suppresses systemic inflammation in mice, we use flow cytometry to analysis splenocyte population. We found emodin was able to reduce the both the size of the spleen (from 150.4±6.7 mg to 103.5±4.2 mg, Figure 3(a)) and the total number of splenocytes (Figure 3(b)). Several different leukocyte populations were investigated and the results showed that emodin significantly but proportionally decreased the absolute number of each of the cell subset but did not change their percentages (Figure 3(c) and (d)).
Figure 3.
Emodin reduced systemic inflammation in mice. (a) The spleen weight of mice. **P < 0.01. (b) The total splenocytes of mice. **P < 0.01. (c and d) Flow cytometry analysis of splenocytes. Percentage (c) or absolute numbers (d) of each subset of cells were shown. Data are represented as the mean ± SEM (n = 10 per group). *P < 0.05 vs. LPS. (e) Serum levels of 23 cytokines/chemokines were measured by Bio-Plex Pro™ Mouse Cytokine 23-plex Assay. Data are represented as the mean ± SEM (n = 10 per group). *P < 0.05 vs. LPS. (A color version of this figure is available in the online journal.)
We next measured the serum levels of cytokines/chemokines to further assess the influence of emodin on systemic inflammation. We found that emodin significantly decreased the plasma levels of 20 different cytokines/chemokines (Figure 3e). Notably, among the cytokines/chemokines that emodin decreased were pro-inflammatory cytokines IL1β, TNFα, IL-6, and IFNγ, growth factors G-CSF and GM-CSF, and leukocyte chemoattractants MCP-1 and RANTES; most of these cytokines/chemokines have been demonstrated to play roles in the pathogenesis of NASH.
Emodin reduced liver weight and leukocyte infiltration in the liver
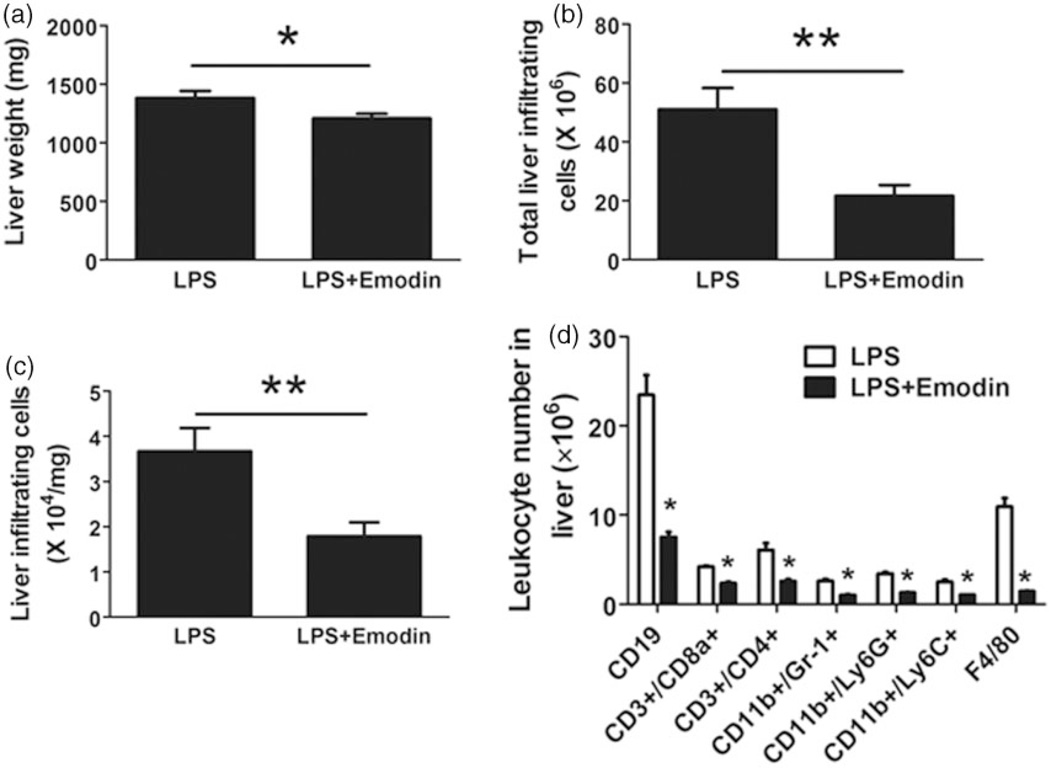
Even though emodin did not affect food intake, body weight, and serum glucose and lipid levels, it was able to decrease the size of the liver from 1380±60 mg to 1208±38.6 mg (Figure 4a). Further, we isolated the infiltrating leukocytes from thoroughly perfused mouse liver, and found the number of liver infiltrating leukocytes was significantly reduced by emodin from over 50 × 106 to less than 25 × 106 cells (Figure 4b). The reduction in infiltrating cells was not simply a result of the reduction in liver size since the number of infiltrating cells/mg of liver was also significantly reduced (Figure 4c). We then looked at individual leukocyte populations in the liver using flow cytometry. Emodin decreased the absolute number of every leukocyte population examined (Figure 4d).
Figure 4.
Emodin reduced liver weight and liver infiltrating leukocytes. After sacrificing, mouse liver was thoroughly perfused to remove blood and then weighed; infiltrating leukocytes were isolated as described in Materials and Methods section. Leukocytes were counted and analyzed by flow cytometry. (a) Liver weight was reduced in emodin treated group (*P < 0.05). (b and c) Total liver infiltrating leukocyte number or cells per milligram liver tissue were reduced in emodin treated group (**P < 0.01). (d) Numbers of each subset of liver infiltrating leukocytes were analyzed by flow cytometry (*P < 0.05 vs. LPS group)
Emodin attenuated liver inflammation and functional impairment
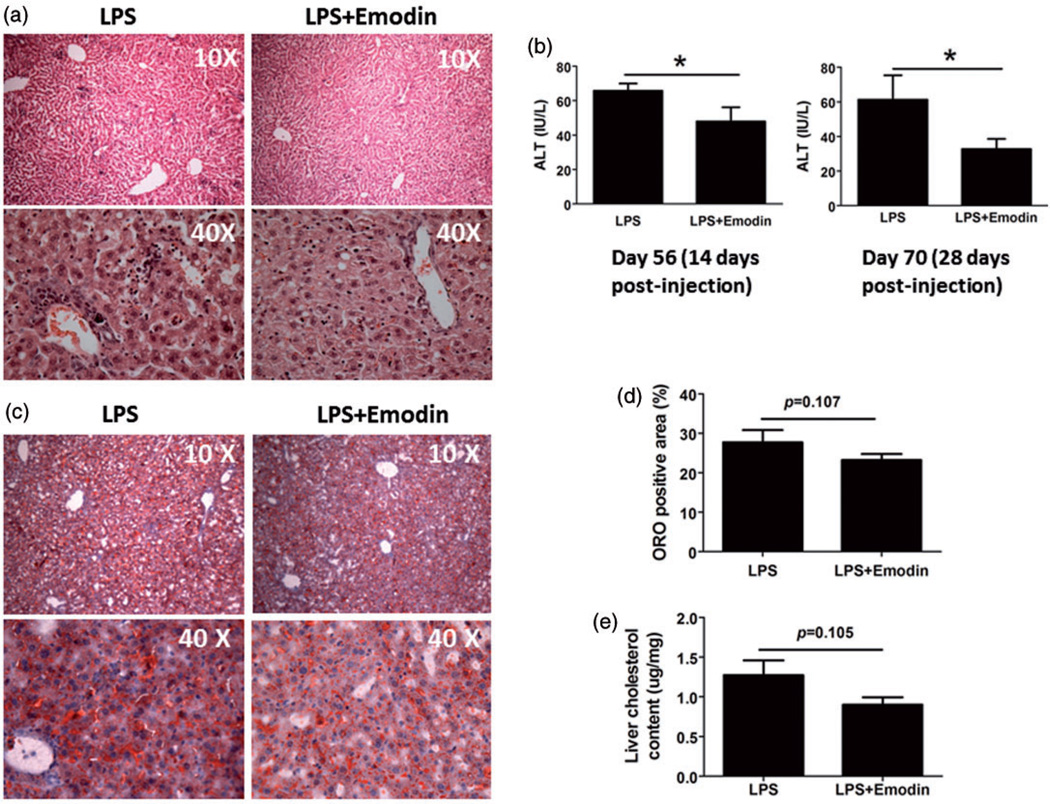
To confirm the results of flow cytometry and visualize leukocyte infiltration, we stained liver tissue slides using hematoxylin and eosin. H&E staining showed that in the liver of LPS only control mice, there were a large number of inflammatory cell accumulating in clusters, especially in the portal areas and surrounding the central vein, while the emodin group displayed significantly fewer infiltrating cell clusters (Figure 5a). Further, emodin improved liver function as measured by an ALT assay. Mice that received LPS and emodin had lower ALT levels at both 14 and 28 days after the initiation of treatment than mice that received LPS only (Figure 5b). However, although emodin treatment slightly decreased the oil Red-O staining positive area percentage in the liver (Figure 5(c) and (d)) and the liver cholesterol content (Figure 5e), the decrease was not statistically significant, suggesting emodin did not significantly decrease the extent of steatosis in the liver.
Figure 5.
Emodin attenuated liver inflammation and functional impairment. (a) Representative liver tissue H&E staining. (b) Serum ALT levels were determined at the indicated days. *P < 0.05. (c) Representative Oil Red-O stained liver sections. (d) Quantification of Oil Red-O staining using software MetaMorph. (e) Cholesterol content in the livers of mice
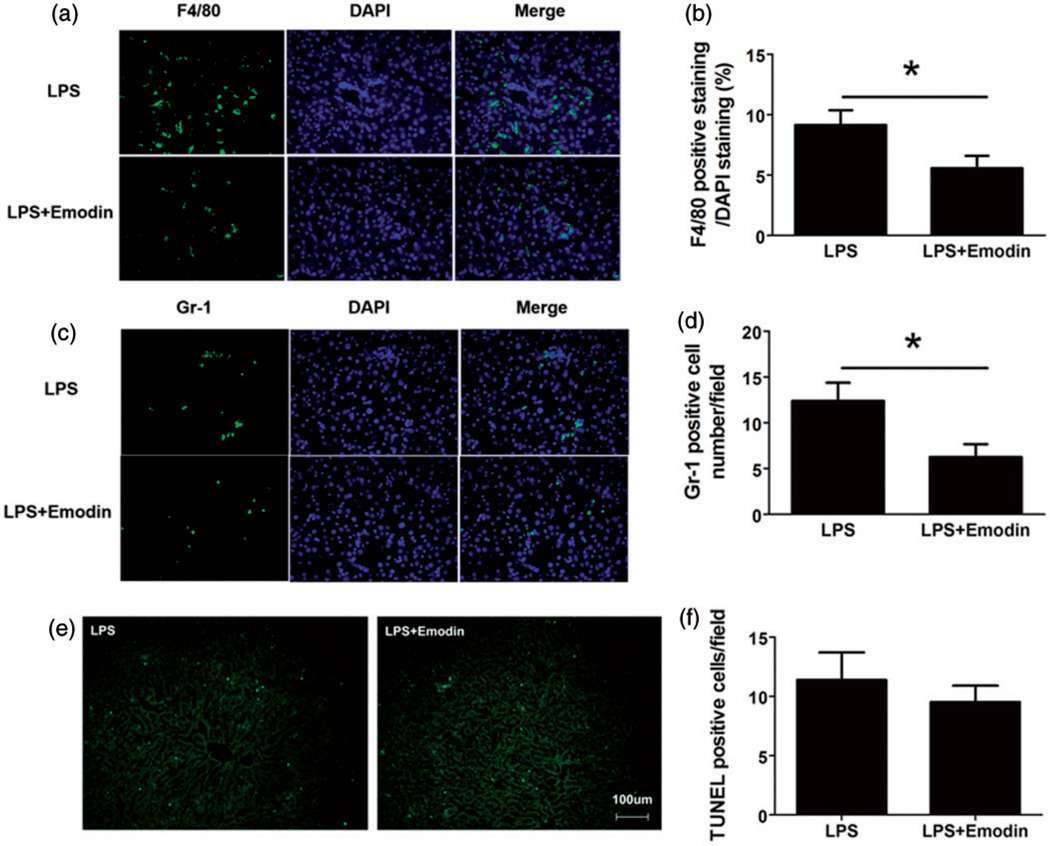
Macrophages and neutrophils are most important leukocyte types that are involved in NAFLD progression. In order to visualize macrophages and neutrophils, we used an antibody against F4/80 to stain macrophages and an antibody against Gr1 to stain granulocytes (mainly neutrophils in the liver), and found that emodin significantly decreased the number of both macrophages (Figure 6(a) and (b)) and granulocytes (Figure 6(c) and (d)), consistent with the flow cytometry data. We further performed TUNEL staining to measure the cell apoptosis in the liver, and we found there was no significant difference in apoptosis in the two groups of mice (Figure 6(e) and (f)), suggesting that the reduced inflammatory cells in the Emodin-treated mouse liver was unlikely due to the increased inflammatory cell apoptosis.
Figure 6.
Emodin decreased macrophage and granulocyte infiltration in the liver. Liver sections were stained using FITC-labeled antibodies against F4/80 (a macrophage marker) or Gr-1 (a granulocyte marker). Sections were counterstained with DAPI nuclear dye. (a and b) Macrophages were reduced in emodin-treated group. F4/80 positive cell percentage was calculated as a ratio of number of F4/80 positive (Green) cells to DAPI-stained (Blue) cells. Each of the 10 40× fields was averaged per mouse (n = 10 mice per group). Data are represented as the mean ± SEM. (c and d) Granulocytes were decreased in emodin treated group. Gr-1 positive cells were counted in each 40× magnification field. Numbers in 10 fields were averaged for each mouse (n = 10 mice per group). (e and f) Apoptotic cell death was determined by TUNEL staining. Positive cell numbers in 10 fields were averaged for each mouse (n = 10 mice per group). Data are represented as the mean ± SEM. *P < 0.05
Emodin inhibited macrophage inflammation in vitro
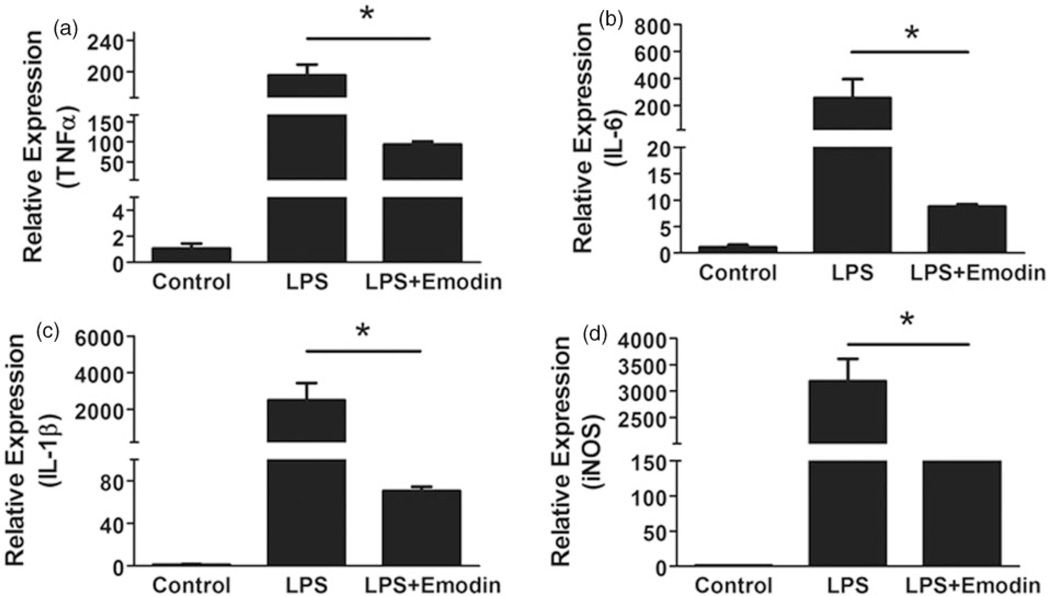
Since macrophages, including liver residential kupffer cells and circulation-derived monocytes/macrophages, play a critical role in the transition from simple steatosis to NASH, we next performed in vitro experiments to examine if emodin could directly inhibit LPS-induced macrophage inflammatory responses. We collected primary macrophage from mice and treated them with LPS (50 ng mL−1) with or without emodin (25 µM). After 6 h incubation, quantitative real-time PCR was used to measure the expression levels of several pro-inflammatory genes and matrix metalloproteinases. The results showed that emodin significantly inhibited the LPS-induced expression of pro-inflammatory cytokines TNFα, IL-1β and IL-6, as well as iNOS (Figure 7).
Figure 7.
Emodin inhibited LPS-induced macrophage inflammation. Mouse peritoneal macrophages were treated with LPS (50 ng/mL) and emodin (25 µM) for 6 h. Quantitative real-time PCR was performed to measure the mRNA expression levels of TNF-α (a), IL-6 (b), IL-1β (c), and iNOS (d). Data are represented as the mean ± SEM of three replicates. *P < 0.05
Emodin suppressed Erk1/2 and p38 signaling induced by LPS in macrophages
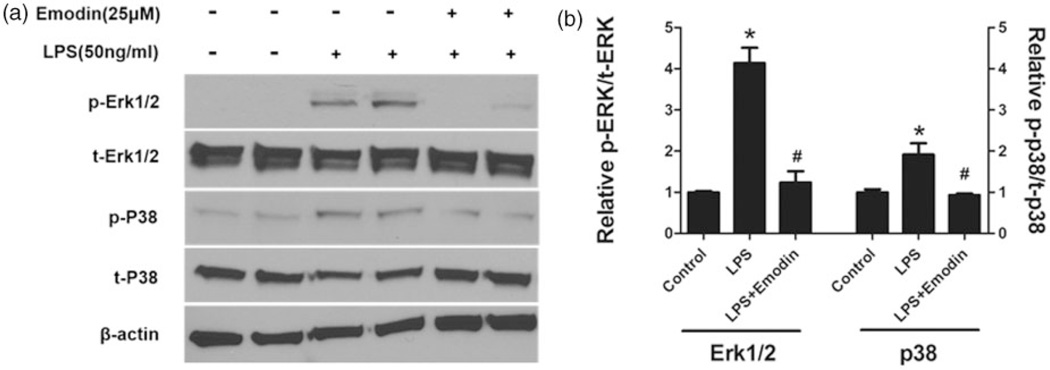
LPS induces macrophage pro-inflammatory signaling through binding to TLR4 receptor and triggering multiple intracellular signaling pathways. Next, we examined which intracellular signaling pathways may contribute to the suppressive effects of emodin. We found that emodin significantly inhibited the activation of ERK1/2 and P38 by LPS (Figure 8), while did not substantially affect LPS-induced phosphorylation of JNK and IκB (data not shown).
Figure 8.
Emodin blocked LPS-induced activation of Erk1/2 and p38 signaling in macrophages. Mouse peritoneal macrophages were treated as indicated for 24 h. Expression levels of Erk1/2, p38 and their phosphorylated forms were determined by Western blotting using corresponding antibodies. β-actin was used as a loading control. (a) Representative Western blot images. (b) Quantitative result based on three repeats. *P < 0.05 vs. control; #P < 0.05 vs. LPS
Discussion
In this study, we tested the effects of emodin on NAFLD using a mouse model generated by two hits, high fat diet-induced hyperlipidemia and LPS administration. We found emodin decreased inflammatory cell infiltration in the liver and improved liver function, although did not substantially attenuate steatosis. The reduction of simple steatosis-to-NASH transition in the liver is accompanied by ameliorated systemic inflammation.
There are no ideal animal models which fully recapitulate both pathogenic context and histopathology of NASH in humans, presenting a major obstacle to carrying out mechanistic and interventional studies.22,23 An ideal animal model should mimic the human pathogenic context (obesity, insulin resistance and hyperlipidemia) as well as replicate the histopathology of NASH (steatosis, inflammation with liver cell injury, and the distinctive pattern of pericellular fibrosis).22 ApoE−/− mice are commonly used for atherosclerosis studies; when fed a high fat, high cholesterol (HFHC) diet, they developed most pathological features of NASH.24 In this study, we used LDLR−/− mice fed a high fat diet and administrated with LPS. LDLR−/− mouse model is another commonly used model for atherosclerosis studies; when fed a western type diet, LDLR−/− mice develop hyperlipidemia, insulin resistance, and steatosis.25,26 In addition to diet-induced hyperlipidemia, chronic low dose LPS administration causes chronic low level endotoxemia, which mimics the endotoxemia caused by leaky gut and serves as a second hit for development of NASH.8,27,28 Therefore, LDLR−/− mice fed with a high fat diet and chronically administered with low dose LPS are ideal to model the transition from simple steatosis to steatohepatitis.
Originally used as a laxative agent in traditional Chinese medicine, emodin has been experimentally shown to be anti-tumor29 and anti-inflammatory,16 and to lower plasma lipid, glucose, and insulin levels.30 However, the laxative effect of emodin, when taken by an oral or intragastric route, affects nutrient absorption in the gut.31,32 Therefore, its metabolic regulating function may partially due to its laxative effects. In this study, we used an intraperitoneal route to examine emodin’s pharmacological benefits independent of its laxative effects. Indeed, in our study emodin did not result in body weight reduction and plasma lipids and blood glucose lowering. We can mostly attribute the beneficial effects of emodin to its anti-inflammatory function, evidenced by significantly reduced spleen and liver inflammatory cells, decreased serum cytokine and chemokine levels in emodin-treated group compared to control group. We focused our in vitro studies on macrophages, because we detect that emodin significantly reduced the macrophage infiltration in the liver (including proliferating liver resident kupffer cells and blood-derived macrophages). Our cell culture study showed emodin significantly reduced macrophage expression of pro-inflammatory cytokines TNFα, IL-1β, and IL-6, as well as iNOS. It has been shown that macrophage TNFα, IL-1β, IL-6, and iNOS all contribute to steatohepatitis.33–35 Therefore, our data suggest that inhibitory effects of emodin on macrophage inflammation at least partially contribute to the attenuation of steatohepatitis. Mechanistically, we further showed that emodin inhibited LPS-induced macrophage inflammation by suppressing Erk1/2 and p38 signaling pathways. It warrants further investigation regarding if emodin also modulates macrophage phenotypes other than the inflammatory phenotype induced by LPS.
There are a few previous studies showing beneficial effects of emodin on NAFLD in animal models. Dong et al. used a high caloric laboratory chow fed rat model and found that oral administration of emodin at 40 mg kg−1 per day for four weeks reduced steatosis and inflammatory cells infiltration and focal necrosis in the liver. They also found emodin reduced body weight, liver weight, blood levels of ALT and triglycerides, and increased liver PPARγ expression.18 Alisi et al. reported that in a high-fat/high-fructose diet fed rat model, emodin administration via drinking water for 10 weeks reduced hepatosteatosis and metabolic derangement. Emodin also reduced plasma TNFα concentration, slightly increased body weight but reduced liver weight/body weight ratio, reduced blood levels of ALT, triglycerides, insulin, glucose, and HOMA-IR.21 It is noteworthy that in both studies, emodin was administrated via an oral/gastric route, and plasma emodin concentration was not measured. In the first two studies mentioned earlier, oral administration of emodin, either with diet or in drinking water, attenuated steatosis and steatohepatitis in mice, accompanied with reduction in plasma lipids and blood glucose. Therefore, beneficial effects may be due to both of the lipid lowering effects and the direct inhibitory effects of emodin on gut microbiota.
In conclusion, our results suggest that emodin, when administrated by intra-peritoneal injection, exerted beneficial effects on NAFLD through its anti-inflammatory merit, independent of its potential lipid-lowering and glucose-lowering effects. We expect a combination of oral and intravenous administration of emodin in patients would increase the bioavailability and maximize the beneficial effects of emodin on metabolic inflammatory diseases such as NDFLD through multiple mechanisms.
ACKNOWLEDGEMENTS
This study was supported by grants from national Institute of Health R21AT006767 and R01HL116626 (to DF).
Footnotes
Author contributions: XJ, FY, and DF: conception, design, data acquisition, analysis and drafting of the manuscript; XJ, SI, and JW: animal study, flow cytometry, Western blot analysis; FS and YW: histology analysis; JH and QW: emodin concentration measurement; SC: data analysis. All authors read and approved the final manuscript.
REFERENCES
- 1.Hotamisligil GS. Inflammation and metabolic disorders. Nature. 2006;444:860–867. doi: 10.1038/nature05485. [DOI] [PubMed] [Google Scholar]
- 2.Farrell GC, Larter CZ. Nonalcoholic fatty liver disease: from steatosis to cirrhosis. Hepatology. 2006;43:S99–S112. doi: 10.1002/hep.20973. [DOI] [PubMed] [Google Scholar]
- 3.Farrell GC, van Rooyen D, Gan L, Chitturi S. NASH is an inflammatory disorder: pathogenic, prognostic and therapeutic implications. Gut Liver. 2012;6:149–171. doi: 10.5009/gnl.2012.6.2.149. [DOI] [PMC free article] [PubMed] [Google Scholar]
- 4.Williams CD, Stengel J, Asike MI, Torres DM, Shaw J, Contreras M, Landt CL, Harrison SA. Prevalence of nonalcoholic fatty liver disease and nonalcoholic steatohepatitis among a largely middle-aged population utilizing ultrasound and liver biopsy: a prospective study. Gastroenterology. 2012;140:124–131. doi: 10.1053/j.gastro.2010.09.038. [DOI] [PubMed] [Google Scholar]
- 5.Neuschwander-Tetri BA. Nonalcoholic steatohepatitis and the metabolic syndrome. Am J Med Sci. 2005;330:326–335. doi: 10.1097/00000441-200512000-00011. [DOI] [PubMed] [Google Scholar]
- 6.Musso G, Gambino R, Cassader M. Non-alcoholic fatty liver disease from pathogenesis to management: an update. Obes Rev. 2009;11:430–445. doi: 10.1111/j.1467-789X.2009.00657.x. [DOI] [PubMed] [Google Scholar]
- 7.Day CP, James OF. Steatohepatitis: a tale of two “hits”? Gastroenterology. 1998;114:842–845. doi: 10.1016/s0016-5085(98)70599-2. [DOI] [PubMed] [Google Scholar]
- 8.Cani PD, Possemiers S, Van de Wiele T, Guiot Y, Everard A, Rottier O, Geurts L, Naslain D, Neyrinck A, Lambert DM, Muccioli GG, Delzenne NM. Changes in gutmicrobiota control inflammation in obese mice through a mechanism involving GLP-2-driven improvement of gut permeability. Gut. 2009;58:1091–1103. doi: 10.1136/gut.2008.165886. [DOI] [PMC free article] [PubMed] [Google Scholar]
- 9.Wigg AJ, Roberts-Thomson IC, Dymock RB, McCarthy PJ, Grose RH, Cummins AG. The role of small intestinal bacterial overgrowth, intestinal permeability, endotoxaemia, and tumour necrosis factor alpha in the pathogenesis of non-alcoholic steatohepatitis. Gut. 2001;48:206–211. doi: 10.1136/gut.48.2.206. [DOI] [PMC free article] [PubMed] [Google Scholar]
- 10.Miele L, Valenza V, La Torre G, Montalto M, Cammarota G, Ricci R, Masciana R, Forgione A, Gabrieli ML, Perotti G, Vecchio FM, Rapaccini G, Gasbarrini G, Day CP, Grieco A. Increased intestinal permeability and tight junction alterations in nonalcoholic fatty liver disease. Hepatology. 2009;49:1877–1887. doi: 10.1002/hep.22848. [DOI] [PubMed] [Google Scholar]
- 11.Brun P, Castagliuolo I, Di Leo V, Buda A, Pinzani M, Palu G, Martines D. Increased intestinal permeability in obese mice: new evidence in the pathogenesis of nonalcoholic steatohepatitis. Am J Physiol Gastrointest Liver Physiol. 2007;292:G518–G525. doi: 10.1152/ajpgi.00024.2006. [DOI] [PubMed] [Google Scholar]
- 12.Park SH, Kim BI, Kim SH, Kim HJ, Park DI, Cho YK, Sung IK, Sohn CI, Kim H, Keum DK, Kim HD, Park JH, Kang JH, Jeon WK. Body fat distribution and insulin resistance: beyond obesity in nonalcoholic fatty liver disease among overweight men. J Am Coll Nutr. 2007;26:321–326. doi: 10.1080/07315724.2007.10719618. [DOI] [PubMed] [Google Scholar]
- 13.Park BJ, Kim YJ, Kim DH, Kim W, Jung YJ, Yoon JH, Kim CY, Cho YM, Kim SH, Lee KB, Jang JJ, Lee HS. Visceral adipose tissue area is an independent risk factor for hepatic steatosis. J Gastroenterol Hepatol. 2008;23:900–907. doi: 10.1111/j.1440-1746.2007.05212.x. [DOI] [PubMed] [Google Scholar]
- 14.Fain JN, Madan AK, Hiler ML, Cheema P, Bahouth SW. Comparison of the release of adipokines by adipose tissue, adipose tissue matrix, and adipocytes from visceral and subcutaneous abdominal adipose tissues of obese humans. Endocrinology. 2004;145:2273–2282. doi: 10.1210/en.2003-1336. [DOI] [PubMed] [Google Scholar]
- 15.Meng G, Liu Y, Lou C, Yang H. Emodin suppresses lipopolysaccharide-induced pro-inflammatory responses and NF-kappaB activation by disrupting lipid rafts in CD14-negative endothelial cells. Br J Pharmacol. 2010;161:1628–1644. doi: 10.1111/j.1476-5381.2010.00993.x. [DOI] [PMC free article] [PubMed] [Google Scholar]
- 16.Li HL, Chen HL, Li H, Zhang KL, Chen XY, Wang XW, Kong QY, Liu J. Regulatory effects of emodin on NF-kappaB activation and inflammatory cytokine expression in RAW 264.7 macrophages. Int J Mol Med. 2005;16:41–47. [PubMed] [Google Scholar]
- 17.Huang Z, Chen G, Shi P. Effects of emodin on the gene expression profiling of human breast carcinoma cells. Cancer Detect Prev. 2009;32:286–291. doi: 10.1016/j.cdp.2008.12.003. [DOI] [PubMed] [Google Scholar]
- 18.Dong H, Lu FE, Gao ZQ, Xu LJ, Wang KF, Zou X. Effects of emodin on treating murine nonalcoholic fatty liver induced by high caloric laboratory chaw. World J Gastroenterol. 2005;11:1339–1344. doi: 10.3748/wjg.v11.i9.1339. [DOI] [PMC free article] [PubMed] [Google Scholar]
- 19.Zhou M, Xu H, Pan L, Wen J, Guo Y, Chen K. Emodin promotes atherosclerotic plaque stability in fat-fed apolipoprotein E-deficient mice. Tohoku J Exp Med. 2008;215:61–69. doi: 10.1620/tjem.215.61. [DOI] [PubMed] [Google Scholar]
- 20.Hei ZQ, Huang HQ, Tan HM, Liu PQ, Zhao LZ, Chen SR, Huang WG, Chen FY, Guo FF. Emodin inhibits dietary induced atherosclerosis by antioxidation and regulation of the sphingomyelin pathway in rabbits. Chin Med J (Engl) 2006;119:868–870. [PubMed] [Google Scholar]
- 21.Alisi A, Pastore A, Ceccarelli S, Panera N, Gnani D, Bruscalupi G, Massimi M, Tozzi G, Piemonte F, Nobili V. Emodin prevents intrahepatic fat accumulation, inflammation and redox status imbalance during diet-induced hepatosteatosis in rats. Int J Mol Sci. 2012;13:2276–2289. doi: 10.3390/ijms13022276. [DOI] [PMC free article] [PubMed] [Google Scholar]
- 22.Larter CZ, Yeh MM. Animal models of NASH: getting both pathology and metabolic context right. J Gastroenterol Hepatol. 2008;23:1635–1648. doi: 10.1111/j.1440-1746.2008.05543.x. [DOI] [PubMed] [Google Scholar]
- 23.Larter CZ. Not all models of fatty liver are created equal: understanding mechanisms of steatosis development is important. J Gastroenterol Hepatol. 2007;22:1353–1354. doi: 10.1111/j.1440-1746.2007.05004.x. [DOI] [PubMed] [Google Scholar]
- 24.Tous M, Ferre N, Camps J, Riu F, Joven J. Feeding apolipoprotein E-knockout mice with cholesterol and fat enriched diets may be a model of non-alcoholic steatohepatitis. Mol Cell Biochem. 2005;268:53–58. doi: 10.1007/s11010-005-2997-0. [DOI] [PubMed] [Google Scholar]
- 25.Ishibashi S, Goldstein JL, Brown MS, Herz J, Burns DK. Massive xanthomatosis and atherosclerosis in cholesterol-fed low density lipoprotein receptor-negative mice. J Clin Invest. 1994;93:1885–1893. doi: 10.1172/JCI117179. [DOI] [PMC free article] [PubMed] [Google Scholar]
- 26.Knowles JW, Maeda N. Genetic modifiers of atherosclerosis in mice. Arterioscler Thromb Vasc Biol. 2000;20:2336–2345. doi: 10.1161/01.atv.20.11.2336. [DOI] [PMC free article] [PubMed] [Google Scholar]
- 27.Cani PD, Bibiloni R, Knauf C, Waget A, Neyrinck AM, Delzenne NM, Burcelin R. Changes in gut microbiota control metabolic endotoxemia-induced inflammation in high-fat diet-induced obesity and diabetes in mice. Diabetes. 2008;57:1470–1481. doi: 10.2337/db07-1403. [DOI] [PubMed] [Google Scholar]
- 28.Tilg H, Moschen AR. Inflammatory mechanisms in the regulation of insulin resistance. Mol Med. 2008;14:222–231. doi: 10.2119/2007-00119.Tilg. [DOI] [PMC free article] [PubMed] [Google Scholar]
- 29.Cha TL, Qiu L, Chen CT, Wen Y, Hung MC. Emodin down-regulates androgen receptor and inhibits prostate cancer cell growth. Cancer Res. 2005;65:2287–2295. doi: 10.1158/0008-5472.CAN-04-3250. [DOI] [PubMed] [Google Scholar]
- 30.Feng Y, Huang SL, Dou W, Zhang S, Chen JH, Shen Y, Shen JH, Leng Y. Emodin, a natural product, selectively inhibits 11beta-hydroxysteroid dehydrogenase type 1 and ameliorates metabolic disorder in diet-induced obese mice. Br J Pharmacol. 2010;161:113–126. doi: 10.1111/j.1476-5381.2010.00826.x. [DOI] [PMC free article] [PubMed] [Google Scholar]
- 31.Ma T, Qi QH, Xu J, Dong ZL, Yang WX. Signal pathways involved in emodin-induced contraction of smooth muscle cells from rat colon. World J Gastroenterol. 2004;10:1476–1479. doi: 10.3748/wjg.v10.i10.1476. [DOI] [PMC free article] [PubMed] [Google Scholar]
- 32.Xu JD, Liu S, Wang W, Li LS, Li XF, Li Y, Guo H, Ji T, Feng XY, Hou XL, Zhang Y, Zhu JX. Emodin induces chloride secretion in rat distal colon through activation of mast cells and enteric neurons. Br J Pharmacol. 2011;165:197–207. doi: 10.1111/j.1476-5381.2011.01573.x. [DOI] [PMC free article] [PubMed] [Google Scholar]
- 33.Bieghs V, Rensen PC, Hofker MH, Shiri-Sverdlov R. NASH and atherosclerosis are two aspects of a shared disease: central role for macrophages. Atherosclerosis. 2012;220:287–293. doi: 10.1016/j.atherosclerosis.2011.08.041. [DOI] [PubMed] [Google Scholar]
- 34.Miyoshi T, Li Y, Shih DM, Wang X, Laubach VE, Matsumoto AH, Helm GA, Lusis AJ, Shi W. Deficiency of inducible NO synthase reduces advanced but not early atherosclerosis in apolipoprotein E-deficient mice. Life Sci. 2006;79:525–531. doi: 10.1016/j.lfs.2006.01.043. [DOI] [PubMed] [Google Scholar]
- 35.Bhargava P, Lee CH. Role and function of macrophages in the metabolic syndrome. Biochem J. 2012;442:253–262. doi: 10.1042/BJ20111708. [DOI] [PubMed] [Google Scholar]


