Abstract
Echocardiography is ideally suited to guide fluid resuscitation in critically ill patients. It can be used to assess fluid responsiveness by looking at the left ventricle, aortic outflow, inferior vena cava and right ventricle. Static measurements and dynamic variables based on heart–lung interactions all combine to predict and measure fluid responsiveness and assess response to intravenous fluid resuscitation. Thorough knowledge of these variables, the physiology behind them and the pitfalls in their use allows the echocardiographer to confidently assess these patients and in combination with clinical judgement manage them appropriately.
Keywords: echocardiography, guidelines, haemodynamics, ventricular function, ultrasound protocols
Introduction
Echocardiography is an essential tool for guiding resuscitation in critically ill patients. Resuscitation often requires the infusion of intravenous fluid in an effort to reverse organ dysfunction. The harms of inappropriate use of fluid are becoming increasingly apparent (1, 2).
Although the purpose of fluid resuscitation is often to increase cardiac output, blood flow is not routinely used to guide resuscitation. Sufficient mean arterial pressure (MAP) is rightly targeted but is proportional to flow only for a given systemic vascular resistance (SVR), which is a dynamic component of circulatory state.
Measurement of flow requires more equipment, time and expertise than standard parameters such as blood pressure, and the value that achieves adequate perfusion for an individual patient is not predictable. Mixed venous oxygen saturations and lactate are useful but only reveal a large mismatch between supply and demand, missing subtler shock states.
The question of whether the patient improves with fluid, additional vasopressors or inotropes can be difficult to answer. Echocardiography is an evidence-based approach and ideally suited to address this problem.
This article first outlines the physiological basis of fluid resuscitation. Then there is a description of the concept of fluid responsiveness (FR) and how this can be assessed with echocardiography. In addition, the limitations and pitfalls are discussed.
Background to fluid responsiveness
The ultimate goal of resuscitation with fluids, vasopressors and inotropes is to ensure adequate oxygen delivery (DO2) to prevent or treat organ dysfunction. There are some fundamental principles that must be appreciated:
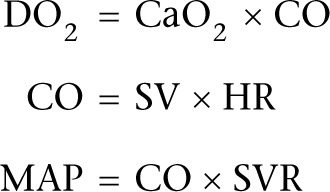 |
where DO2 refers to oxygen delivery, CaO2 refers to oxygen content of arterial blood, CO refers to cardiac output, SV refers to stroke volume, HR refers to heart rate, MAP refers to mean arterial pressure and SVR refers to systemic vascular resistance.
SV is the amount of blood ejected from the heart with each beat and is dependent on preload (end-diastolic wall tension), contractility and afterload (end-systolic wall tension). When myocytes are stretched, they contract more forcefully and so SV increases as venous return (VR) increases (Frank–Starling law). This is the foundation for the concept of fluid responsiveness. However, when stretched beyond a certain level, they are unable to contract more forcefully and so SV does not increase further (fluid ‘unresponsiveness’). This is depicted in Fig. 1.
Figure 1.
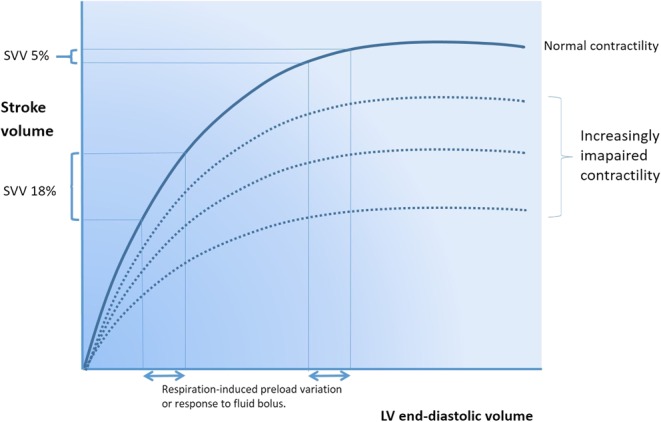
The Frank–Starling curve. Lower on the curve a given change in preload results in a large change in stroke volume. On the higher, flatter portion, the same preload change has minimal effect on stroke volume.
Increased pressure in the left atrium and pulmonary vasculature may then result in excessive capillary engorgement, resulting in pulmonary oedema. In clinical practice, a fluid responder is generally defined as someone who increases their stroke volume by >15% after a 500mL fluid challenge. Around 50% of fluid challenges administered in critically ill patients do not result in an increase in SV, exposing these patients to potential harm (3, 4).
Preload, or VR, is determined by the pressure gradient between capacitance veins and the right atrium (RA). The pressure in the veins is termed ‘mean circulatory filling pressure’ (MCFP) or ‘mean systemic pressure’ (MSP) (5):
 |
where VR refers to venous return, MSP refers to mean systemic pressure, RAP refers to right atrial pressure and SVR refers to systemic vascular resistance.
MSP is regulated to a great extent by the effect of sympathetic nervous system on the splanchnic venous system. This contains 20% of the total blood volume, is 30 times more compliant than the arterial circulation and is heavily innervated with α-adrenoceptors. It serves as a reservoir of blood made up of capacitance vessels easily able to change in volume to maintain VR to the heart (6).
A visual analogy is shown in Fig. 2. MSP is increased by fluid administration and by vasoconstriction. This partly explains the improvement in cardiac output sometimes seen with vasopressor administration. If both ventricles are preload dependent, that is they lie on the steep part of the Starling curve, stroke volume increases appreciably.
Figure 2.
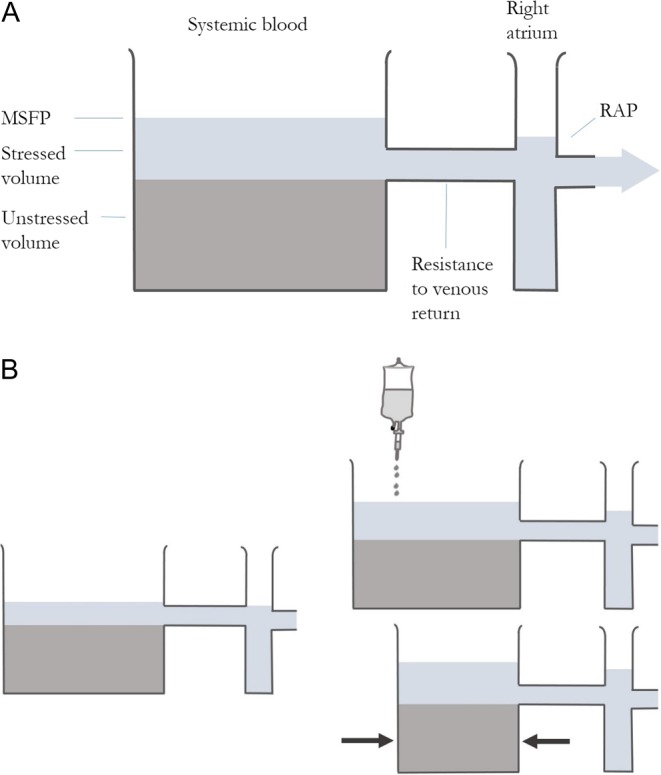
Stressed volume and venous return. (A) The fluid below the outlet is unstressed venous volume and does not contribute to flow out of the tank. The additional fluid in the tank is stressed volume, which drives venous return. Lowering RAP or increasing MSP in isolation would increase VR. (B) The proportion of the circulation that is stressed volume can be increased by giving fluid (attenuated somewhat by reflex venodilatation) or reducing the size of the tank (giving a vasopressor to convert unstressed to stressed volume).
Static parameters
Preload is defined as end-diastolic wall tension which, while related to, is not the same as LV pressure or volume. Consequently, an individual’s Starling curve is governed by their myocardial contractility. This means that, although they say something about preload, static markers such as CVP, pulmonary capillary wedge pressure and ventricular volumes do not reliably predict FR. This has been borne out in over 100 studies since 1970s (7).
Dynamic parameters
Dynamic parameters are information gained from provoking the circulation by inducing changes in the loading conditions of the heart. In reality, this provocation is either in the form of heart–lung interactions or a change in posture.
Heart–lung interactions
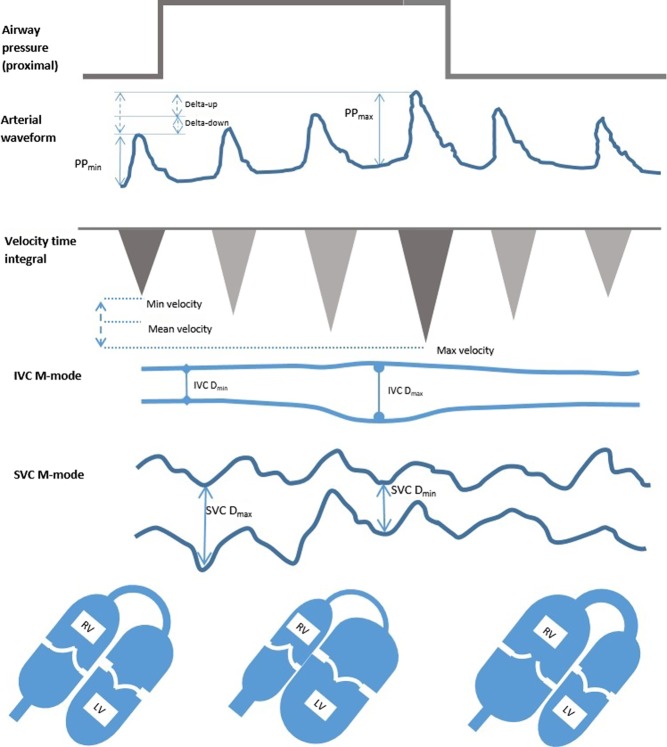
Ventilation induces cyclical changes in intrathoracic pressure (ITP), which in turn cause alterations in SV (Fig. 3). These changes are composed of two elements termed delta-Up and delta-Down (8).
Figure 3.
The physiology of respiratory-induced flow and pressure changes during positive pressure ventilation without additional respiratory effort. The inspiratory rise in intrathoracic pressure is transmitted, at least in part, to the pericardium and causes increased transmural pressure across the RV wall, plethora within the IVC and compression of the SVC. The RV stroke volume immediately falls. Concurrently, the pulmonary vasculature is compressed, forcing blood into the LV causing an initial increase in LV stroke volume. After the pulmonary transition time, the LV receives less blood and its stroke volume falls. This effect is exaggerated in states of low circulating volume and attenuated in the overloaded system or when either ventricle is failing. PP pulse pressure, IVC D inferior vena cava diameter, SVC D superior vena cava diameter.
dDown
In positive pressure inspiration:
Increased ITP reduces venous return. If hypovolaemia is present, this is exaggerated by collapse of the SVC.
Increased transpulmonary pressure (TPP) compresses pulmonary vessels and increases RV afterload. At higher levels, small increases in pressure can result in large increases in PVR, explaining the sensitivity of the RV to high ventilation pressures.
Both these phenomena reduce RV output. This causes reduced LV output a few heartbeats later.
Decrease in venous return plays the biggest role in normovolaemia and hypovolaemia. Increased afterload dominates if there is significantly reduced lung compliance (with normovolaemia), pulmonary hypertension or significant right heart failure (9). Although both mechanisms lead to the same result, the appropriate treatment is very different. Fluid may be indicated if there is reduced venous return, whereas it could be detrimental with increased TTP.
dUp
Increased TPP reduces LV afterload and compresses pulmonary capillaries in inspiration, forcing blood into the left heart, and increasing stroke volume. Therefore, dUp is unrelated to fluid responsiveness (10).
Biventricular failure has an exaggerated dDown and dUp causing false positives for FR.
It can be appreciated from the explanations above that the cyclical changes in intrathoracic pressure from mechanical ventilation induce cyclical changes in preload and SV if the ventricles are on the steep ascending part of the Starling curve, i.e. if they are fluid responsive.
Postural change
Changes in posture such as from a head up to head down position also alter the heart’s loading conditions by transferring blood between the leg veins and the central circulation. A manoeuvre termed passive leg raising (PLR) and the interpretation of the physiological response to this are now well studied. The PLR test and its assessment with echocardiography are discussed later.
Predicting fluid responsiveness
There is now a large body of evidence to show that various dynamic parameters (both invasive and non-invasive) have a high sensitivity and specificity for predicting FR. These include pulse pressure variation, systolic pressure variation, stroke volume variation, systolic velocity variation, end-expiratory occlusion and leg raise-induced changes (11).
The variation in pulse pressure, measured by analysis of the arterial waveform, has been shown to be a valid method when a threshold of around 12% is used. The variation in stroke volume as determined by cardiac output monitoring, usually also done by arterial waveform analysis, appears equally valid when a similar cut-off value is employed.
End-expiratory occlusion involves holding the patient at end-expiration for approximately 15s and examining the change in cardiac output that results. A rise in stroke volume strongly suggests fluid responsiveness.
Ultrasound devices using Doppler to study the descending aortic flow use the same principles as those used in echocardiography. The most common of these is the oesophageal Doppler device. This is ‘semi-invasive’ and usually requires the patient to be asleep. Positioning of the probe to achieve an accurate signal can sometimes be difficult.
These methods are clearly useful but are limited by the requirement of an arterial cannula and a precise arterial trace. Movement artefact, kinking of the catheter and over- or under-damping of the waveform affect accuracy.
Echocardiography provides much more information on the causes of shock than just FR and is increasingly considered the first-line monitoring tool of choice in haemodynamically compromised patients. Both static and dynamic parameters may be assessed to build a picture of the circulatory state.
Before the fluid challenge; using echocardiography to predict fluid responsiveness
Echocardiography avoids the need for invasive lines and probes. Although it suffers from its own set of limitations, it is non-invasive and also provides a wealth of qualitative information in addition to the quantitative assessment for accurate circulating volume assessment. It can be used to assess the effect of a fluid challenge.
The most prevalent ways of using echocardiography for assessing volume status are discussed here.
Left ventricle
LV size
Although static parameters have a poor ability to predict FR, there are some suggestive features that are seen with overt hypovolaemia. The size of the LV is predictive of FR only when it is very small. A hyperdynamic LV with an end-diastolic area in the PSAX view of less than 10cm2 or papillary apposition (kissing ventricles) is strongly indicative of hypovolaemia (10, 12). Remember this appearance is also found in LV hypertrophy, highly inotropic and vasodilated states, so care should be taken when interpreting these findings. It is usually obvious from clinical signs where there is profound hypovolaemia.
Changes in LV size as assessed by TOE reflect changes in preload (13). However, increasing preload does not necessarily increase SV, and LV size is a poor predictor of fluid responsiveness. Variation in LV stroke area with respiration has been shown to predict fluid responsiveness (change >16%). This is impractical without appropriate software in the echo machine as it uses automated border detection on a beat-to-beat basis (14).
An additional important LV feature to check for is dynamic outflow tract obstruction. In patients with known hypertrophic obstructive cardiomyopathy, hypovolaemia accentuates the obstruction and can be fatal. Significant narrowing of the outflow tract during systole can be induced by under filling of the LV in patients, particularly when in a hyperdynamic state such as sepsis, or during inotrope infusions in the presence or absence of proximal septal thickening (15). Careful assessment of the outflow tract is, therefore, obligatory and should include searching for systolic high outflow tract velocity and anterior movement of the anterior mitral valve leaflet.
LVEDP
A restrictive pattern in MV flow should prompt caution with fluid administration as it reflects elevated LV diastolic pressure (Fig. 4). It should be remembered, however, that if LV compliance is reduced, the LVED pressure–volume relationship is shifted up and left so:
Figure 4.
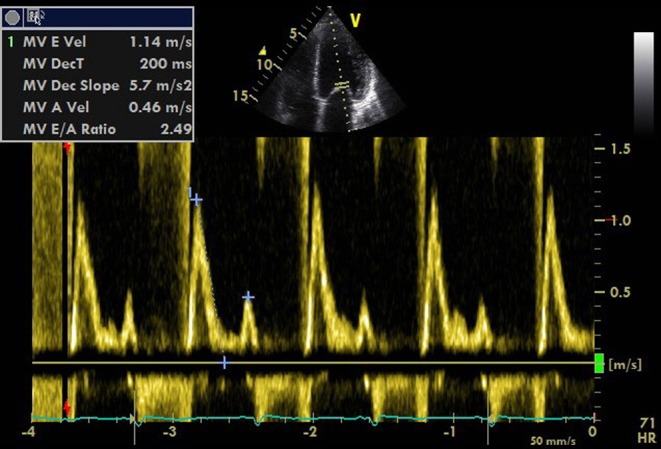
PW Doppler of MV inflow demonstrating high LV filling pressure.
The LV can be under-filled despite high filling pressures.
The optimum filling range is narrow: it is under or overfilled easily.
Therefore, a hypovolaemic LV with diastolic dysfunction may have elevated filling pressures, may respond well to fluid, but will easily be overloaded with pulmonary oedema resulting.
An additional reason for caution in using LV inflow pattern is the occurrence of mild diastolic impairment in hypovolaemia (9).
LV outflow variation
Stroke volume variation
Stroke volume variation is a good indicator of fluid responsiveness (4). Measurement of stroke volume is relatively simple with echocardiography:
Flow through a tube is velocity×cross-sectional area if flow is constant.
Blood flow is pulsatile rather than constant, so we need to calculate volume per contraction.
Measuring the velocity time integral VTI (measurement of all the velocities of RBCs for each contraction at a certain point) can be done by tracing the spectral Doppler envelope.
This is measured in centimetres and represents how far the column of blood is ejected (stroke distance).
volume = area × length
therefore:
volume = area × velocity × time
So the area under the PW Doppler trace (VTI) is the stroke distance (SD):
 |
or
Thus, SV can be calculated by measuring VTI and diameter at the same point. This is best performed by measuring the diameter of the LVOT in the parasternal long axis (PLAX) view, remembering an error is squared. Optimize the view by minimizing the sector width and depth (Fig. 5).
Figure 5.
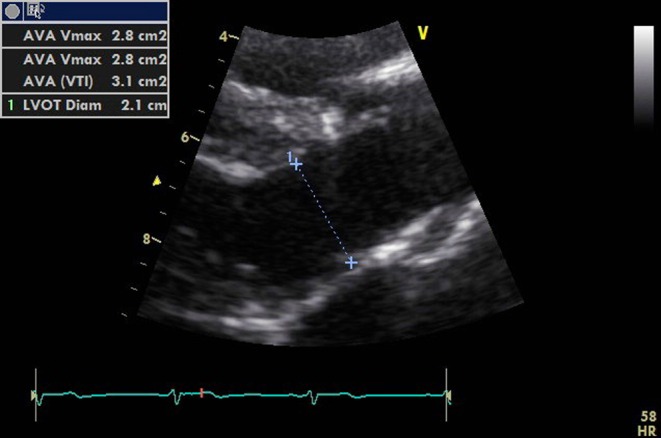
PLAX view optimized for measuring the LVOT diameter.
After switching to an apical five-chamber view (A5C), the PW Doppler sample box should be placed at the same point at which the LVOT was measured in the PLAX view. The VTI can then be traced (Fig. 6).
Figure 6.
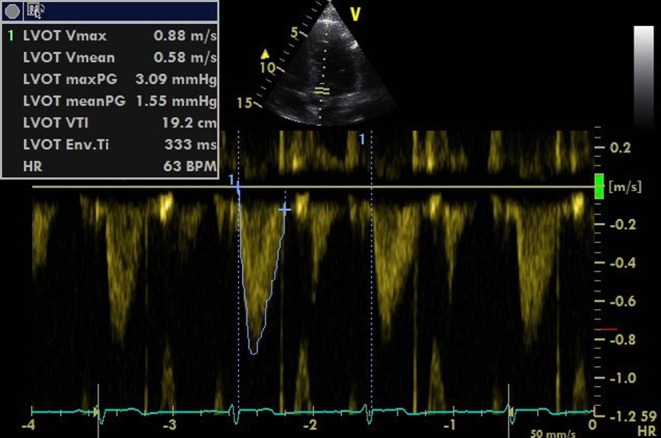
Tracing the PWD waveform to get the VTI value.
Decreasing the sweep speed allows aortic flows to be seen over more than one respiratory cycle. Tracing the largest and smallest VTI over a respiratory cycle allows the percentage change to be calculated.
Stroke volume variation of more than 12% accurately predicts fluid responsiveness with values over 14% having a very high positive predictive value and less than 10% a high negative predictive value (4). Variation of 12–14% represents a grey area and should encourage a search for other markers.
Aortic peak velocity and VTI variation
The LVOT can be assumed not to change in size over the respiratory and cardiac cycle and so changes in aortic blood flow reflect changes in stroke volume. This can be demonstrated with CW or PW Doppler with the sweep speed set to ensure that several respiratory cycles are represented. Evidence to date has used PW Doppler to show changes in Vmax or VTI, so we recommend using PW Doppler. The sample box should be placed at the level of the aortic valve or within 1 cm of it, in the LVOT, just as it would be when measuring SV. Peak velocity variation of 12% in both adults and children predicts fluid responsiveness (12) and VTI variation is also predictive (Fig. 7).
Figure 7.
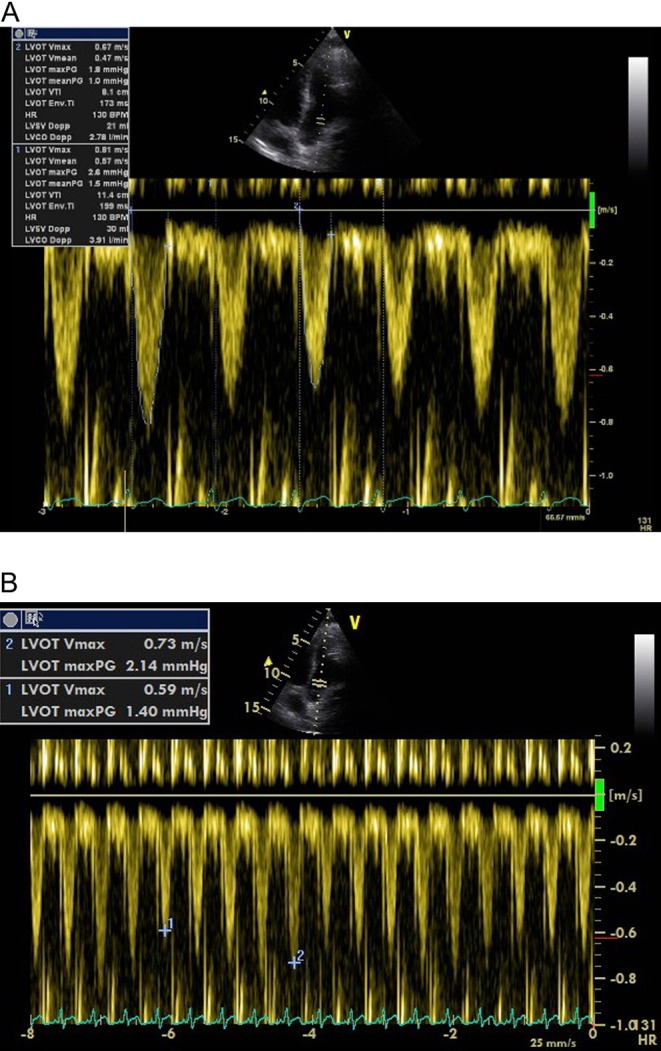
(A) PWD in the LV outflow tract. VTI measurement of the smallest and largest envelope within the respiratory cycle. (B) Measuring Vmax variation with appropriate sweep speed.
It is essential to remember that these percentage variations in SV, VTI or peak velocity are calculated using the following equation:
 |
or in full
 |
Pitfalls of using LV outflow variation
SVV, SPV, PPV, peak velocity and VTI variation are only valid with certain preconditions:
The patient must be in sinus rhythm otherwise stroke volume may vary because of the arrhythmia.
For the more established methods, there must be no spontaneous respiratory effort, which would alter preload and SV and make variations a reflection of work of breathing rather than FR.
Tidal volumes should be around 8 mL/kg. Lower, although now desirable, tidal volumes cause small amplitude changes in intravascular pressure and have been shown to cause false negatives (consequently, it may be necessary to increase tidal volumes during the study) (16).
Intra-abdominal pressure should be normal as although respiratory variations are still predictive, the cut-off value has to be raised by an amount as yet undefined (17).
The thorax should be intact-an open chest invalidates any conclusions based on flow variation (18).
These limitations have brought into question the usefulness of these tests when applied to a general body of critically ill patients (19). However, when the preconditions are met, these tests have a very high positive predictive value for identifying fluid responders.
The great veins
The size and variation in size over the respiratory cycle of both the IVC and SVC give information about volume status.
IVC size
IVC size, measured just distal to the hepatic vein, in spontaneously breathing patients correlates with RAP (20). Ventilated patients demonstrate a low correlation between IVC size and RAP; however, an RAP of less than 10 mm of Mercury can be assumed if the IVC is less than 12 mm (21). In spontaneously breathing patients, the best cut-off value for an RAP above or below 10 mm of Mercury is 2 cm (22). As already discussed, this is of little clinical value. However, a small (<10 mm) IVC suggests that fluid is tolerated (23). Invasively ventilated patients often have a dilated IVC because of increased intrathoracic pressure rather than as a reflection of their intravascular volume status.
IVC diameter variation
Cyclical changes in intrathoracic pressure induce changes in RAP, which alters venous return. In controlled ventilation, the IVC expands in inspiration and reduces in expiration (Fig. 8A). This can be assessed in M-mode but is often best done in 2D as the vessel does not always lie perpendicular to the beam (Fig. 8B).
Figure 8.
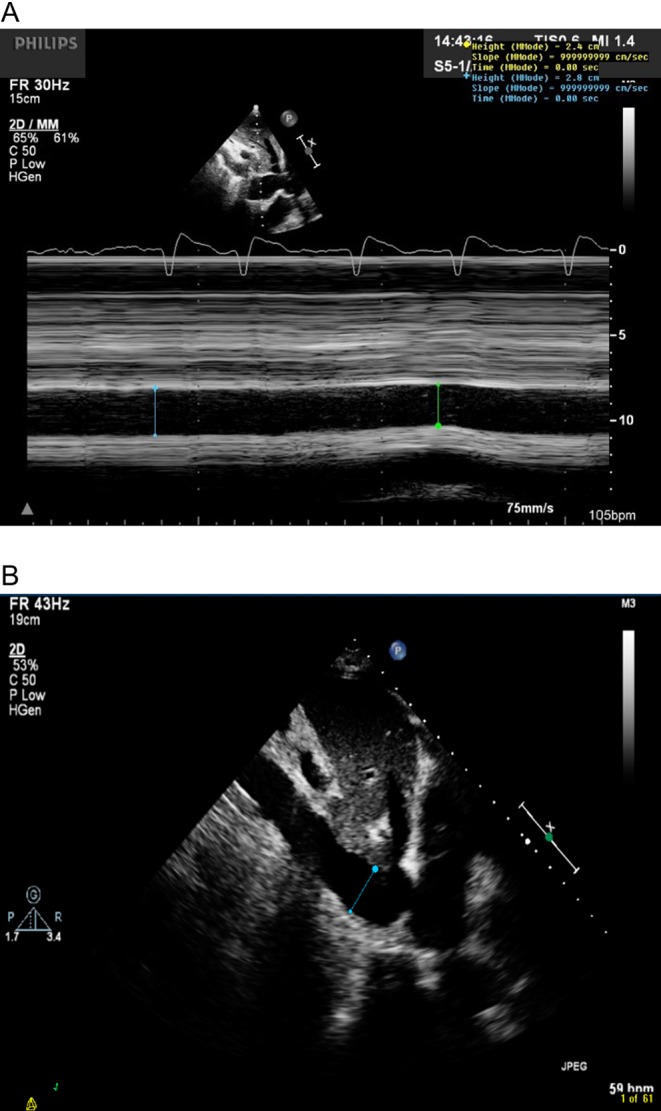
IVC measurement just distal to the hepatic vein. M-mode (A) can be used if the vessel is perpendicular to the ultrasound incidence; however, 2D measurements (B) are often more reliable.
This variation is abolished when RAP is high. The absence of respiratory variation strongly suggests that the patient is not fluid responsive (23). In contrast, and similarly to LV outflow, large variations in IVC size with IPPV accurately predict FR. A diameter ‘variability’ cut-off value of more than 12% identifies responders (24):
 |
DVIVC refers to IVC diameter variability, Dmax refers to maximum diameter, Dmin refers to minimum diameter and Dmean refers to mean diameter over the respiratory cycle.
A variation threshold of 18% is used if the following formula for the ‘IVC distensibility index’ is used. IVC variability is as follows (23):
 |
DIIVC refers to IVC distensibility index.
IVC diameter variation has also been studied in spontaneously breathing patients without respiratory support; however, the evidence to support its use is weak and cannot be advocated at this time (25).
SVC variation
The SVC is difficult to see with TTE but can be easily visualized with TOE in the longitudinal 90- to 100-degree view. Diameter changes are opposite of the IVC in IPPV. The SVC partially collapses in mechanical inspiration, as the increase in pleural pressure is greater than the increase in RAP with a positive pressure breath. The collapsibility index of the SVC has been shown to be predictive of FR with a variation in SVC size of 36%, being an appropriate cut-off value using the equation 100×(Dmax–Dmin/Dmin) (26).
Pitfalls of great vein variations
With respiration, the IVC can move out of the plane of the US beam, falsely mimicking changes in diameter. The IVC wall must be clearly visualized throughout the respiratory cycle and the bright edges kept in view. Work of breathing with any spontaneous ventilation has a significant impact on IVC size over the respiratory cycle and, similar to LVOT flow variations, spontaneous breathing and TVs of less than 8mm/kg may invalidate conclusions on FR. Arrhythmia seems to be less confounding for IVC interpretation than for LV outflow variation.
Right ventricle
RV size
A dilated right ventricle is commonly seen in critically ill patients due to acute cor pulmonale compounded by fluid administration. Acute cor pulmonale can be caused by high ventilation pressures, which are sometimes necessary to ventilate stiff lungs, so the mode of ventilation and pressures delivered should be noted. The RV can easily dilate to accommodate increased volume loading but tolerates acute pressure loading poorly. Patients with RV dilatation from pulmonary embolism have been shown to increase their SV with a fluid challenge; however, a dilated RV should prompt caution in fluid administration (27). As both ventricles occupy a relatively fixed space constrained by the pericardium, the RV dilates at the expense of LV size (Fig. 9). An increase in RV size with no increase in SV is a definite stopping point for fluid administration. Paradoxical septal wall motion demonstrating very high RV pressure may be a contraindication to IV fluid.
Figure 9.
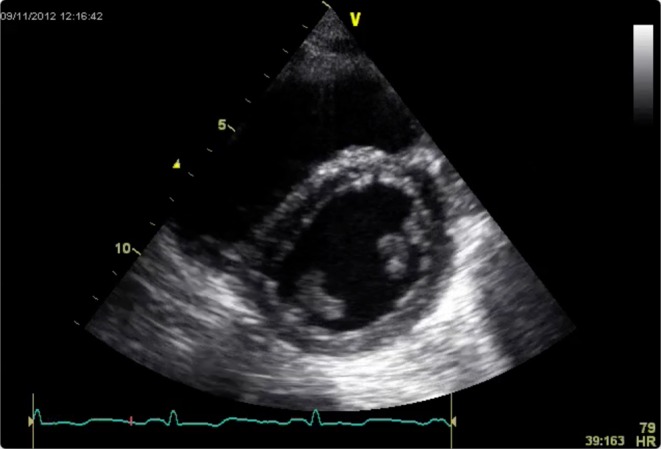
RV dilatation and septal flattening is evident in this PSAX view. LV filling is being impaired.
Importantly, RV failure results in false positives for fluid responsiveness. The increased afterload induced by a positive pressure breath exaggerates dDown producing significant SV or VTI variation.
Passive leg raising
Passive leg raising is a simple method of predicting fluid responsiveness (28). It is performed by tilting a patient from a 45-degree semi-recumbent head up position to a 45-degree leg up position, which transfers up to 300mL of blood into the central circulation. Tipping the whole bed and not lifting the legs avoids compression of the femoral veins. Stroke volume or simply VTI across either outflow tract is measured before and 1 min after the PLR. An increment of 10% suggests FR.
The fluid shift settles within a few minutes, so runs none of the risks of excess administration. It also overcomes some of the limitations of the dynamic parameters above, as it can be used in spontaneous ventilation and arrhythmias.
Pain on tilting, lower limb amputation or severe peripheral vascular disease, and raised intracranial pressure are contraindications to PLR.
After a fluid challenge
As seen above, dynamic parameters in particular are extremely useful for predicting fluid responsiveness. The gold standard, however, must be whether SV actually increases with a fluid challenge. A fluid challenge is generally defined as rapid administration of 250–500 mm of intravenous fluid (29).
Assessment of the response in flow to a fluid challenge is easy with echocardiography. It is really only necessary to measure LVOT VTI rather than adding in an LVOT measurement to get SV. Measurement of VTI should occur immediately before and after a fluid challenge. Measurements should ideally be end-expiratory or averaged over several consecutive beats.
Recently, it has been shown that a mini-fluid challenge of only 100mL accurately predicts FR using variations in aortic VTI with TTE (30). It should be noted that significant improvements in SV may not be reflected by changes in blood pressure; however, blood flow and calculated oxygen delivery are improved.
The length of time that cardiac output remains increased after a successful fluid bolus is poorly studied. In health, redistribution of most of a crystalloid bolus occurs within 45 min, slightly longer for colloids. In disease states, this duration is very variable and may be as brief as 20 min (31). As such, the need for frequent reassessment of circulating volume is important.
A further consideration is the dilutional effects of fluid administration. Although cardiac output may be increased, haemoglobin has been necessarily diluted. The balance of these effects determines whether overall oxygen delivery has been augmented. Equally frequent checks on haemoglobin or haematocrit are, therefore, often advised.
Fluid tolerance
When there is doubt about whether a fluid challenge is appropriate, it can be reassuring to elicit signs with echocardiography that suggest that fluid administration will at least not lead to pulmonary oedema or right heart failure. In both spontaneously breathing and ventilated patients, a small IVC that varies in size with respiration, non-dilated right heart chambers, a non-displaced inter-ventricular septum, absence of right and left ventricular systolic failure and absence of markers of raised LVEDP all suggest that fluid administration will not cause acute harm.
Fluid administration should stop when VTI no longer significantly increases with a fluid bolus. False negatives can be excluded by demonstrating that preload has increased by measuring an increase in LV E velocity, LV E:A ratio or RV size.
Clinical judgement
The tests that predict fluid responsiveness do not always give a dichotomic answer. Where a study’s ROC curve analysis yields a best cut-off of 12% between responders and non-responders, it must be recognized that this is a balance between sensitivity and specificity (Fig. 10). If the tests produce a result around the threshold, then this should trigger a search for other markers of FR (Fig. 11).
Figure 10.
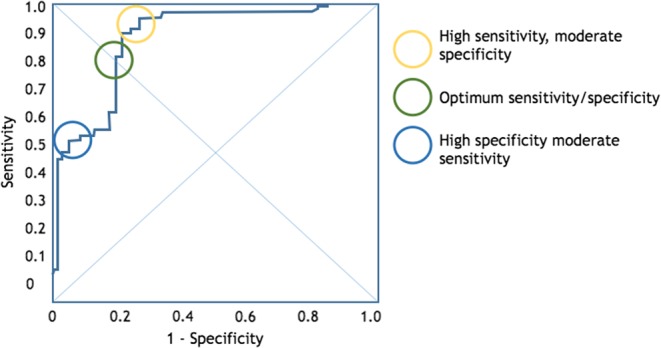
A typical ROC curve for the power of echocardiography to predict fluid responsiveness. The ‘optimum’ threshold is neither the most sensitive nor specific.
Figure 11.
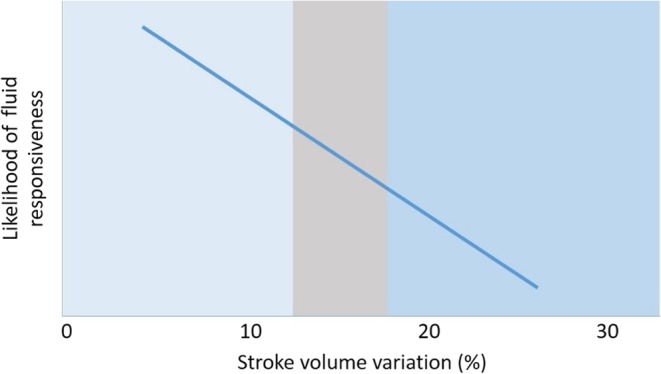
The ‘grey zone’ approach to flow variation assessment means that when the result is around the threshold value, further corroborating evidence should be sort from other modalities (e.g. IVC evaluation).
FR means SV increases with fluid in the immediate term. However, a patient being fluid responsive does not necessarily mean that fluid is beneficial. Administration of a fluid challenge to a healthy normovolaemic individual very likely results in increased SV. This does not mean they needed fluid or that it was of benefit to them. It is vital for the physician to be aware of the dangers of unnecessary fluid loading and take the whole clinical picture into account.
Conclusion
Echocardiography is an ideal imaging modality for rapid assessment of the circulation in the shocked patient. It usually elucidates the cause, whether cardiac ischaemia, cardiomyopathy, acute valve disease, tamponade, significant pulmonary embolism, aortic root pathology or distributive shock. This article has focused on the fluid optimization phase of resuscitation.
Intravenous fluid boluses can benefit the circulation but also cause harm. The presence of signs that fluid delivery improves cardiac output does not mean that a greater cardiac output is necessary.
Echocardiography is an invaluable tool for assessing both whether a patient will be fluid responsive and what effects the fluid administration has on the heart. There are limitations to its use and interpretation; no single test is immune to false positives and negatives. For example, it has been shown that between 2 and 30% of patients may have tidal volumes outside the range for which outflow tract flow variations are technically valid. However, acknowledging such weaknesses, taking into account the pre-test probability and gathering as many markers as possible, leads to good clinical decision making.
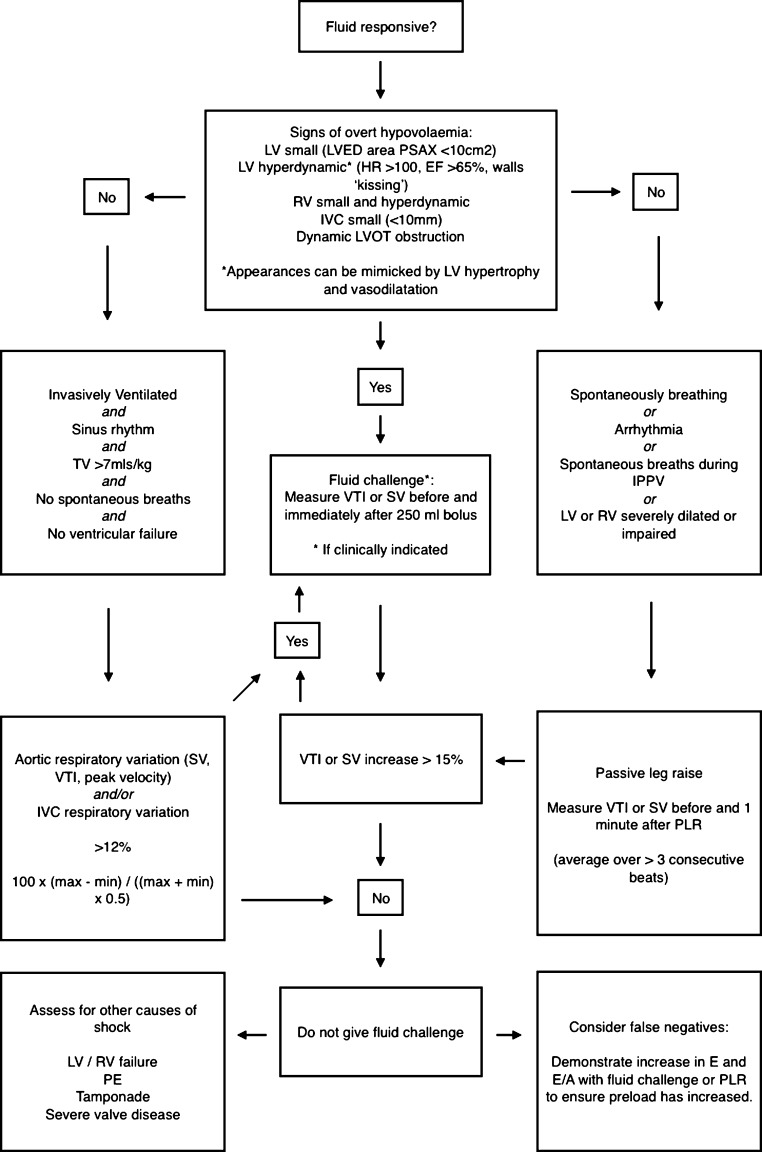
The methods outlined in this article are summed up in an algorithm to assess for fluid responsiveness (Fig. 12).
Figure 12.
An algorithm to guide fluid resuscitation using echocardiography.
The principles of the use of echocardiography for volume assessment used in the critically ill are as follows:
Small hyperdynamic ventricles with a small IVC suggest significant hypovolaemia.
In a shocked patient without signs of overt hypovolaemia, dynamic indices of FR should be sought.
Echocardiography can give additional information regarding the validity of other clinical and monitoring markers.
Echocardiography informs about the dangers of delivering a fluid bolus in terms of adding to extravascular fluid or worsening LV filling.
When interpreting echocardiography findings, the limitations of that particular technique in that particular patient must be taken into account.
Further research
Although there are numerous signals in the literature that higher overall fluid balance correlates with poorer outcome, the prospective evidence is lacking. Indeed, it is not known whether it is actually better to maintain the patient in a state of fluid responsiveness rather than so often try to maximize stroke volume.
Further research in the use of echocardiography for optimizing circulating volume might explore the in-depth use of diastolic assessment of both LV and RV, the use of strain imaging and the changes induced by small rapid fluid boluses.
Declaration of interest
The authors declare that there is no conflict of interest that could be perceived as prejudicing the impartiality of this guideline.
Funding
This work did not receive any specific grant from any funding agency in the public, commercial, or not-for-profit sector.
References
- 1.Wiedemann HP, Wheeler AP, Bernard GR, Thompson BT, Hayden D, deBoisblanc B, Connors AF, Jr, Hite RD, Harabin AL. 2006. Comparison of two fluid-management strategies in acute lung injury. New England Journal of Medicine 354 2564–2575. 10.1056/NEJMoa062200 [DOI] [PubMed] [Google Scholar]
- 2.Boyd JH, Forbes J, Nakada T, Walley KR, Russell JA. 2011. Fluid resuscitation in septic shock: a positive fluid balance and elevated central venous pressure are associated with increased mortality. Critical Care Medicine 39 259–265. 10.1097/CCM.0b013e3181feeb15 [DOI] [PubMed] [Google Scholar]
- 3.Michard F. 2002. Predicting fluid responsiveness in ICU patients: a critical analysis of the evidence. Chest 121 2000–2008. 10.1378/chest.121.6.2000 [DOI] [PubMed] [Google Scholar]
- 4.Marik PE, Cavallazzi R, Vasu T, Hirani A. 2009. Dynamic changes in arterial waveform derived variables and fluid responsiveness in mechanically ventilated patients: a systematic review of the literature. Critical Care Medicine 37 2642–2647. 10.1097/CCM.0b013e3181a590da [DOI] [PubMed] [Google Scholar]
- 5.Magder S, De Varennes B. 1998. Clinical death and the measurement of stressed vascular volume. Critical Care Medicine 26 1061–1064. 10.1097/00003246-199806000-00028 [DOI] [PubMed] [Google Scholar]
- 6.Gelman S. 2008. Venous function and central venous pressure: a physiologic story. Anesthesiology 108 735–748. 10.1097/ALN.0b013e3181672607 [DOI] [PubMed] [Google Scholar]
- 7.Marik PE, Baram M, Vahid B. 2008. Does central venous pressure predict fluid responsiveness? A systematic review of the literature and the tale of seven mares. Chest 134 172–178. 10.1378/chest.07-2331 [DOI] [PubMed] [Google Scholar]
- 8.Perel A, Pizov R, Cotev S. 1987. Systolic blood pressure variation is a sensitive indicator of hypovolemia in ventilated dogs subjected to graded hemorrhage. Anesthesiology 67 498–502. 10.1097/00000542-198710000-00009 [DOI] [PubMed] [Google Scholar]
- 9.Chew MS. 2012. Haemodynamic monitoring using echocardiography in the critically ill: a review. Cardiology Research and Practice 2012 139537 10.1155/2012/139537 [DOI] [PMC free article] [PubMed] [Google Scholar]
- 10.Tavernier B, Makhotine O, Lebuffe G, Dupont J, Scherpereel P. 1998. Systolic pressure variation as a guide to fluid therapy in patients with sepsis-induced hypotension. Anesthesiology 89 1313–1321. 10.1097/00000542-199812000-00007 [DOI] [PubMed] [Google Scholar]
- 11.Mandeville JC, Colebourn CL. 2013. Predicting fluid responsiveness in the critically ill adult. British Journal of Intensive Care 23 20–26. 10.1155/2012/513480 [DOI] [Google Scholar]
- 12.Feissel M, Michard F, Mangin I, Ruyer O, Faller JP, Teboul JL. 2001. Respiratory changes in aortic blood velocity as an indicator of fluid responsiveness in ventilated patients with septic shock. Chest 119 867–873. 10.1378/chest.119.3.867 [DOI] [PubMed] [Google Scholar]
- 13.Tousignant CP, Walsh F, Mazer CD. 2000. The use of transesophageal echocardiography for preload assessment in critically ill patients. Anesthesia & Analgesia 90 351–355. 10.1213/00000539-200002000-00021 [DOI] [PubMed] [Google Scholar]
- 14.Cannesson M, Slieker J, Desebbe O, Farhat F, Bastien O, Lehot J-J. 2006. Prediction of fluid responsiveness using respiratory variations in left ventricular stroke area by transoesophageal echocardiographic automated border detection in mechanically ventilated patients. Critical Care 10 R171 10.1186/cc5123 [DOI] [PMC free article] [PubMed] [Google Scholar]
- 15.Chauvet J-L, El-Dash S, Delastre O, Bouffandeau B, Jusserand D, Michot J-B, Bauer F, Maizel J, Slama M. 2015. Early dynamic left intraventricular obstruction is associated with hypovolemia and high mortality in septic shock patients. Critical Care 19 262. 10.1186/s13054-015-0980-z [DOI] [PMC free article] [PubMed] [Google Scholar]
- 16.Muller L, Louart G, Bousquet P-J, Candela D, Zoric L, Coussaye J-E, Jaber S, Lefrant J-Y. 2009. The influence of the airway driving pressure on pulsed pressure variation as a predictor of fluid responsiveness. Intensive Care Medicine 36 496–503. 10.1007/s00134-009-1686-y [DOI] [PubMed] [Google Scholar]
- 17.Tavernier B, Robin E. 2011. Assessment of fluid responsiveness during increased intra-abdominal pressure: keep the indices, but change the thresholds. Critical Care 15 134 10.1186/cc10074 [DOI] [PMC free article] [PubMed] [Google Scholar]
- 18.de Waal EEC, Rex S, Kruitwagen CLJJ, Kalkman CJ, Buhre WF. 2009. Dynamic preload indicators fail to predict fluid responsiveness in open-chest conditions. Critical Care Medicine 7 510–515. 10.1097/CCM.0b013e3181958bf7 [DOI] [PubMed] [Google Scholar]
- 19.Mahjoub Y, Lejeune V, Muller L, Perbet S, Zieleskiewicz L, Bart F, Veber B, Paugam-Burtz C, Jaber S, Ayham A, et al. 2014. Evaluation of pulse pressure variation validity criteria in critically ill patients: a prospective observational multicentre point-prevalence study. British Journal of Anaesthesia 112 681–685. 10.1093/bja/aet442 [DOI] [PubMed] [Google Scholar]
- 20.Jardin F, Vieillard-Baron A. 2006. Ultrasonographic examination of the venae cavae. Intensive Care Medicine 32 203–206. 10.1007/s00134-005-0013-5 [DOI] [PubMed] [Google Scholar]
- 21.Jue J, Chung W, Schiller NB. 1992. Does inferior vena cava size predict right atrial pressures in patients receiving mechanical ventilation? Journal of the American Society of Echocardiography 5 613–619. 10.1016/S0894-7317(14)80327-1 [DOI] [PubMed] [Google Scholar]
- 22.Brennan JM, Blair JE, Goonewardena S, Ronan A, Shah D, Vasaiwala S, Kirkpatrick JN, Spencer KT. 2007. Reappraisal of the use of inferior vena cava for estimating right atrial pressure. Journal of the American Society of Echocardiography 20 857–861. 10.1016/j.echo.2007.01.005 [DOI] [PubMed] [Google Scholar]
- 23.Feissel M, Michard F, Faller J-P, Teboul J-L. 2004. The respiratory variation in inferior vena cava diameter as a guide to fluid therapy. Intensive Care Medicine 30 1834–1837. [DOI] [PubMed] [Google Scholar]
- 24.Barbier C, Loubières Y, Schmit C, Hayon J, Ricôme J-L, Jardin F, Vieillard-Baron A. 2004. Respiratory changes in inferior vena cava diameter are helpful in predicting fluid responsiveness in ventilated septic patients. Intensive Care Medicine 30 1740–1746. [DOI] [PubMed] [Google Scholar]
- 25.Airapetian N, Maizel J, Alyamani O, Mahjoub Y, Lorne E, Levrard M, Ammenouche N, Seydi A, Tinturier F, Lobjoie E, et al. 2015. Does inferior vena cava respiratory variability predict fluid responsiveness in spontaneously breathing patients? Critical Care 19 400. 10.1186/s13054-015-1100-9 [DOI] [PMC free article] [PubMed] [Google Scholar]
- 26.Vieillard-Baron A, Chergui K, Rabiller A, Peyrouset O, Page B, Beauchet A, Jardin F. 2004. Superior vena caval collapsibility as a gauge of volume status in ventilated septic patients. Intensive Care Medicine 30 1734–1739. [DOI] [PubMed] [Google Scholar]
- 27.Mercat A, Diehl JL, Meyer G, Teboul JL, Sors H. 1999. Hemodynamic effects of fluid loading in acute massive pulmonary embolism. Critical Care Medicine 27 540–544. 10.1097/00003246-199903000-00032 [DOI] [PubMed] [Google Scholar]
- 28.Cavallaro F, Sandroni C, Marano C, La Torre G, Mannocci A, De Waure C, Bello G, Maviglia R, Antonelli M. 2010. Diagnostic accuracy of passive leg raising for prediction of fluid responsiveness in adults: systematic review and meta-analysis of clinical studies. Intensive Care Medicine 36 1475–1483. 10.1007/s00134-010-1929-y [DOI] [PubMed] [Google Scholar]
- 29.Vincent J-L, Weil MH. 2006. Fluid challenge revisited. Critical Care Medicine 34 1333–1337. 10.1097/01.CCM.0000214677.76535.A5 [DOI] [PubMed] [Google Scholar]
- 30.Muller L, Toumi M, Bousquet P-J, Riu-Poulenc B, Louart G, Candela D, Zoric L, Suehs C, de La Coussaye JE, Molinari N, et al. 2011. An increase in aortic blood flow after an infusion of 100 ml colloid over 1 minute can predict fluid responsiveness: the mini-fluid challenge study. Anesthesiology 115 541–547. 10.1097/ALN.0b013e318229a500 [DOI] [PubMed] [Google Scholar]
- 31.Hilton AK, Bellomo R. 2012. A critique of fluid bolus resuscitation in severe sepsis. Critical Care 16 302 10.1186/cc11154 [DOI] [PMC free article] [PubMed] [Google Scholar]


 This work is licensed under a