Abstract
In spite of the wealth of available cultural and archeological information as well as general interest in the Mayans, little is known about their genetics. In this study, for the first time, we attempt to alleviate this lacuna of knowledge by comprehensively investigating the Y chromosome composition of contemporary Mayan populations throughout their domain. To accomplish this, five geographically targeted and ethnically distinct Mayan populations are investigated using Y-SNP and Y-STR markers. Findings: overall, the Mayan populations as a group are highly homogeneous, basically made up of only two autochthonous haplogroups, Q1a2a1a1*-M3 and Q1a2a1*-L54. Although the Y-STR data illustrates diversity, this diversity, for the most part, is uniformly distributed among geographically distant Mayan populations. Similar haplotypes among populations, abundance of singletons and absence of population partitioning within networks among Mayan populations suggest recent population expansion and substantial gene flow within the Mayan dominion, possibly due to the development of agriculture, the establishment of interacting City–State systems and commerce.
Introduction
Native Americans are descendant of Siberian migrants that penetrated the American continent 40–15 thousand years ago (kya).1 These travelers are thought to have originated in the South Altaic region of Central Asia.1, 2 Based on the genetic data, it has been proposed that the expansion to America took place in three main stages: (1) a trans-Siberian dispersion of Paleolithic people from the South Altai region to Beringia as early as 40 000 years ago (ya); (2) the settlement of Beringia and a migrational hiatus that could have lasted 15 000 years and (3) a trek from Beringia into the American continent. We do know that humans got to Monte Verde, Chile in extreme South America ~14 500 ya3. In addition, Clovis remains belonging to Y haplogroup Q-L54*(xM3) from western Montana indicate that gene flow from Siberia to America happened before 12 600 ya indicating prior divergence among Native American groups.4
Paleo-Natives reached the region known today as Mesoamerica around 10 000–16 000 ya.5 These original settlers were hunter-gatherers surviving on wild animals, collecting wild plants, shellfish and possibly fishing. Within the traditional Mayan region, a number of settlements have been found at Los Tapiales in the Quiche Basin in the highlands of Guatemala dating to 10 000–11 000 ya.6 About 8000 ya, it is thought that these people started selecting plants that provided for subsistence.6 It is thought that these efforts eventually lead to the in situ development of agriculture and domestication of animals. An agrarian mode of existence combined with the domestication of animals provided surplus food for communal consumption during lean times and ushered a new era of centralized governance, population growth and creativity.7 Proto or Archaic Mayans are first detected in what we know today as Petén, Central Guatemala about 4000 ya.7 The region of Petén is considered the birth place of Mayan civilization. The Ceibal, in the Pasión region of Petén, represents the earliest known Mayan sedentary community discovered thus far, dating back to about 3000 ya.8 The Ceibal location corresponds roughly to the collection area of our Q'eqchi population. Increasingly complex City–States such as Nakbe appeared during the subsequent Pre-Classic Period, also in the region of Petén.9 The City–State system incited rivalries and warfare in the quest for control over trade routes between the lowlands and the highlands.10 At the start of the Classic period (around 1800 ya), the Mayan empire had become a complex and dynamic entity, undergoing a series of population expansions and contractions.5 The Classic Period also experienced an intensification of trade and commerce among Mayan City–States and other civilizations including the Aztecs.10, 11 Undoubtedly, these cultural and demographic events impacted the genetic make up of Mayans throughout their empire.
Throughout their suzerainty, individual City–States emerged and flourished just to be dramatically abandoned centuries later while others were established de novo nearby. Regional soil exhaustion, ecological collapse, drought, overpopulation and/or epidemics are frequently cited as reasons for the downfall of specific settlements and eventually the entire Empire. The contemporary Mayans share several cultural traits including mythology, science, art, architecture and language, oral as well as written. This cultural homogeneity among Mayan groups is likely the result of the extensive trade and communication routes that permeated the Mayan territory from its beginning. The current classification employed to discriminate among Mayan groups is primarily based on degrees of linguistic similarities.12
Albeit the many cultural communalities among Mayan groups, little is known about the genetic diversity of distinct Mayan populations. Specifically, minimal information exists on the genetic constitution of Mayan populations and their relationships to non-Mayan Mesoamerican groups. What little is known suffers from limited scope and population coverage within the Mayan territory as well as fragmentary data encompassing few and different marker systems making direct comparisons difficult. In the present study, we comprehensibly assess, for the first time, the paternal genetic profiles of a number of key populations representing the main geographical regions of the traditional Mayan domain. For this purpose, we ascertained the diversity of STR and SNP markers on the Y chromosome and phylogeneticaly compare it in the context of geographically targeted populations from the literature.
Materials and methods
Collection of samples and DNA isolation
Buccal swabs were collected with informed consent from 351 unrelated Mayan males residing in five ethnical distinct regions within the Mayan dominion in Mesoamerica. These traditional Mayan ethnic groups include Q'eqchi (n=132), Itza (n=80), Yucatán (n=73), Cakchikel (n=45) and Quiche (n=21). Genealogical information for each donor was collected for at least two generations in order to access the regional ancestry of the individuals and confirm lack of familial ties among donors. The DNA was isolated as previously described.13
Published data
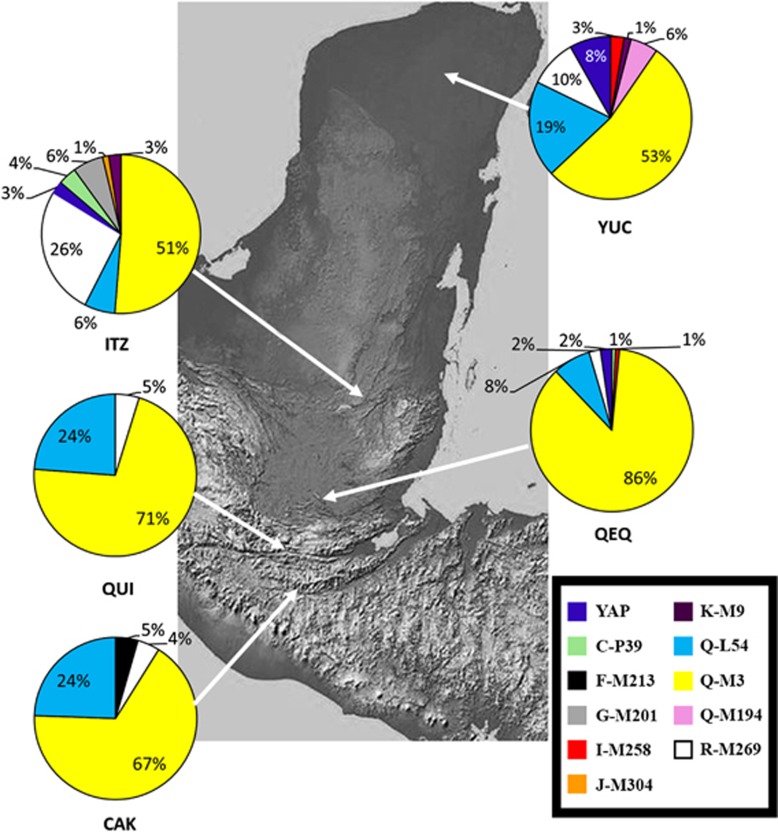
A total of 19 ethnographically targeted reference populations were procured from the literature for phylogenetic comparison. A list of populations analyzed in this study, abbreviations, sample number, geographical regions and references are provided in Supplementary Table 1. A map representing the traditional Mayan realm with the populations genotyped in this study is provided in Figure 1. The locations of the reference populations are illustrated in Supplementary Figure 1. The 19 reference populations were genotyped for Y-STR or binary Y-SNP markers in common with the Mayan populations genotyped in this study.
Figure 1.
Location and haplogroup distribution of the five Mayan populations genotyped. The full colour version of this figure is available at European Journal of Human Genetics online.
Y-SNP haplogroups
Bi-allelic markers from the non-recombining region of the human Y-chromosome (NRY) were assessed in hierarchical order using the standard methods including PCR-RFLP,14 allele-specific PCR,15 the YAP polymorphic Alu insertion (PAI)16 and direct sequencing17 to assign individuals to their respective Y-haplogroups. Assignment of Y-SNP haplogroups and nomenclature of the markers was according to the Y Chromosome Consortium18 and subsequent revisions.19, 20, 21
Y-STR genotyping
Individuals were genotyped at 17 Y-STR loci (DYS19, DYS385a/b, DYS389 I/II, DYS390, DYS391, DYS392, DYS393, DYS437, DYS438, DYS439, DYS448, DYS456, DYS458, DYS635 and Y-GATA H4) in a multiplex reaction using the AmpFlSTR Identifiler kit (Applied Biosystems, Foster City, CA, USA) according to the manufacturer's specifications.1, 22
Accession numbers
The genotypes of individuals of the five Mayan populations reported for the first time in this publication have been successfully submitted and are now included in the YHRD database (https://yhrd.org) under the following accession numbers: Qèqchi YA004139; Itza; YA004140; Yucatán YA004141; Cakchikel YA004142 and Quiche YA004143. All the Y-specific haplotypes reported in this article have been described and appear in the YHRD database (https://yhrd.org). Details on the haplotypes assigned are found in https://yhrd.org.
Statistical and phylogenetic analyses
The STR allelic frequencies for the Mayan populations genotyped in this study were computed using the GENEPOP v3.4 program.23 A number of parameters of population genetics interest including number of haplotypes (NH), unique haplotypes (UH), fraction of unique haplotypes (FUH), discrimination capacity (DC), average gene diversity over loci (GD) and haplotype-level gene diversity (HD) were calculated using Arlequin v.3.5.24 Arlequin v.3.5 24 was employed to compute haplotype-level gene diversity and average gene diversity over loci at the 17 loci level.
An analysis of molecular variance (AMOVA) was performed utilizing Y-STR allelic frequencies. The Arlequin v.3.5 software24 was employed in this analysis with the different populations partitioned geographically into six groups (Alaskan Eskimos, Altaians, Mayans, Mesoamericans (other than Mayans), North Americans and South Americans).
Y-STR haplotype data for 15 populations from the Mayan domain (QEQ, ITZ, YUC, CAK, QUI, KIC, MAM and QEC), South America (AYM and QUE), North America (ATH), Alaskan Eskimos (INU and YUP) and Eastern Siberia (MON and KHA) was utilized to calculate pair-wise genetic distances (Rst values) and corresponding p-values. The Rst values were calculated based on 15 Y-STR loci as peviously described 1, 25 and p-values were adjusted with the Bonferroni corrections (0.05/120=4.167 × 10−4). Samples carrying microvariants were excluded from the Rst calculations. The Rst values were subsequently employed in the construction of a multidimensional scaling (MDS) plot as previously published.1 The lack of haplotype data for some of the reference populations previously published prevented calculation of Rst values and MDS analysis for the entire set of 19 populations.
Evolutionary26 and genealogical27 mutation rates were employed to generate time estimates based on individuals within the Q-M242, Q1a2a1a1*-M3, Q1a2a1*-L54 and Q1a2a1a1b-M194 haplogroups. These calculations were performed using the previously described method.27 Y-STR variances were estimated utilizing the Vp function previously described.1 Due to the limitations of Y-STR markers for assessing age and variances, the dates provided in this study should only be used for comparisons of relative ages among the Mayan populations. The Q1a2a1a1*-M3 and Q1a2a1*-L54 Media Joining networks were generated as previously described.1
All phylogenetic analyses were executed utilizing 15 Y-STR loci (DYS19, DYS389I, DYS389II, DYS390, DYS391, DYS392, DYS393, DYS437, DYS438, DYS439, DYS448, DYS456, DYS458, DYS635 and GATA H4) in common among the collections listed in Supplementary Table 1. DYS385 was excluded from the AMOVA, Rst, network, time estimates and haplotype diversity calculations because it is not possible to discriminate between DYS385a and DYS385b with the genotypic method employed. In addition, the size of the DYS389I allele was subtracted from the DYS389II for all analyses.
Results
Y-SNP distributions
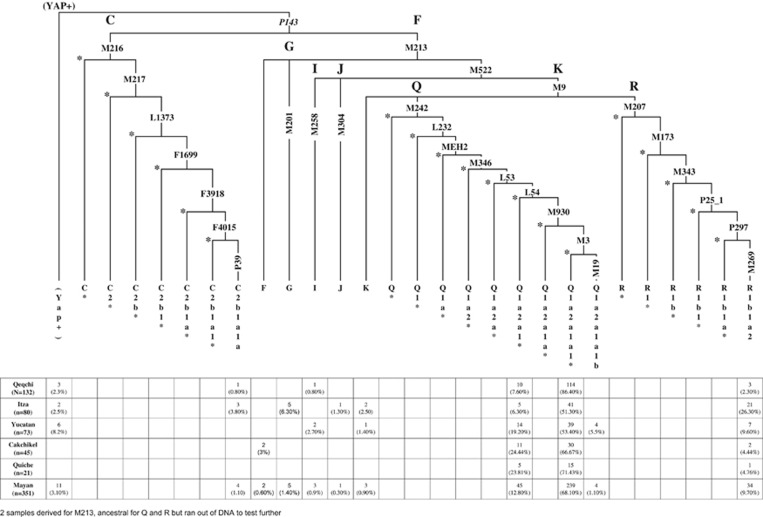
The phylogenetic relationship of the Y-SNP mutations and the haplogroups they define are provided in Figure 2. The vast majority of all the Mayan populace from the different regions belonged to haplogroup Q-M242 (Q'eqchi=94%, Cakchikel=91%, Quiche=95%, Yucatan=78% and Itza=57%). Overall, all five Mayan populations exhibit very limited haplogroup diversity compared, for example, to Eurasian and African populations. Q1a2a1a1*-M3 is the predominant haplogroup (51–86%) throughout the region (Figure 1). Second in abundance is haplogroup Q1a2a1*-L54. Itza (26%) and Yucatán (10%) possess a substantial proportion of the Eurasian R1b1a2-M269 haplogroup introduced during and subsequent to the European colonization of the two regions. Itza is also the population with greater haplogroup diversity. The SNP for the Q1a2a1a1b-M194 mutation was detected only in Yucatan at a rate of 6% (n=4). Other than Q1a2a1a1*-M3, Q1a2a1*-L54 and Q1a2a1a1b-M194, the other haplogroups detected in the five Mayan populations can be attributed to post-Colombian migrations from Europe (eg, R1b1b2-M269 and G-M201), Asia (C3b-P39) or Africa (D/E-YAP+). Although C3b-P39 is only found in North America and is associated with Na-Dené speakers, it is possible that the four C3b-P39 individuals detected in Q'eqchi (1) and Itza (3) are autochthonous Native Americans. Alternatively, these four C3b-P39 samples may represent Chinese contemporary migrants ubiquitous in different parts of America.
Figure 2.
Haplotype and distribution among the Mayan populations.
Y-STR allele frequencies
The allelic frequencies for the 17 Y-STR loci genotyped in the five Mayan populations of Q'eqchi, Itza, Yucatán, Cakchikel and Quiche are provided in Supplementary Tables 2a–e, respectively. The genotypes of each individual of the five Mayan populations are provided in Supplementary Table 3. Supplementary Table 4 illustrates a number of parameters of population genetics importance (NH, UH, FUH, DC, GD and HD). A total of 96 allelic variants were detected in Q'eqchi, 89 in Itza, 85 in Yucatán, 75 in Cakchikel and 64 in Quiche. Of all five Mayan populations genotyped in this study, Q'eqchi exhibits the highest values for number of haplotypes, unique haplotypes and gene diversity followed by Itza, Yucatán, Cakchikel and Quiche, in that order (Supplementary Table 4).
MDS and Rst values
Rst pair-wise comparisons before Bonferroni corrections (Supplementary Table 5) indicate non significant genetic differences between QEQ-QUI, YUC-CAK, YUC-QUI and CAK-QUI. Subsequent to Bonferroni adjustments, QEQ-CAK and ITZ-QUI became non significantly different as well. The CAK-QUI comparison exhibits the lowest Rst genetic distance of any pair-wise combination.
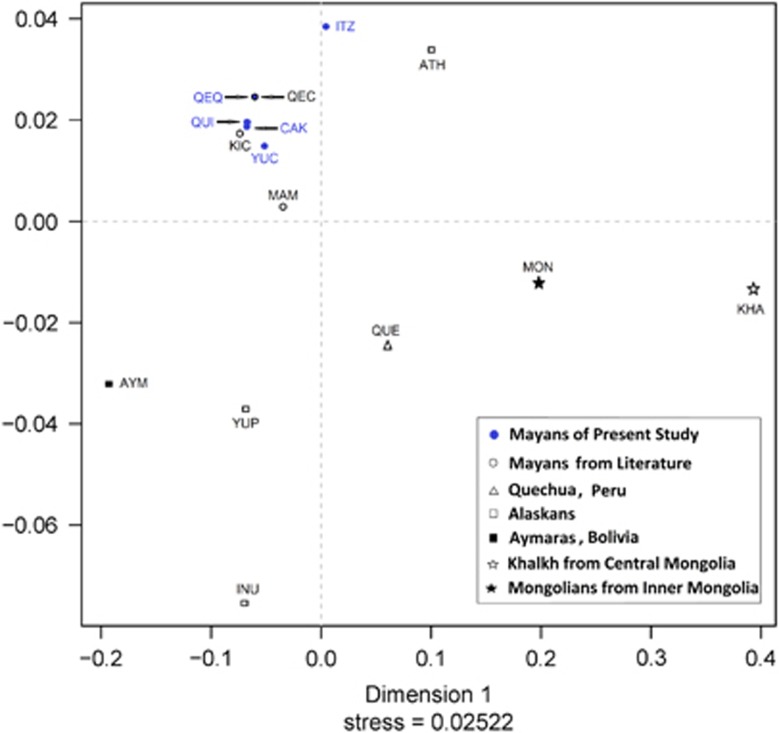
Allelic Y-STR frequencies from three Mayan populations procured from the literature were also employed to generate Rst distances (Supplementary Table 5) and a MDS plot (Figure 3). These phylogenetic analyses allowed comparison between our set of five Mayan populations and Mayan groups from other locations within the Mayan territory. Prior to Bonferroni corrections, pair-wise Rst distance comparisons among all eight Mayan populations indicate insignificant genetic differences between QUI-KIC, CAK-KIC, CAK-MAM, QEQ-QEC, QEC-YUC, CAK-QEC and QUI-QEC. After Bonferroni adjustments, QEQ-KIC, YUC-KIC, QEQ-MAM, ITZ-MAM YUC-MAM, QUI-MAN and QUE-ITZ became non significantly different. Overall, comparison of the Y-STR data illustrates strong similarities among the eight Mayan populations. The MDS plot illustrates a tight cluster of Mayan populations with Itza and Mam segregating at the periphery of the conglomerate. Corresponding populations belonging to the same linguistic groups (QEQ–QEC and KIC–QUI) partition in close proximity.
Figure 3.
MDS plot based pm Y-STR data. The full colour version of this figure is available at European Journal of Human Genetics online.
Pairwise Rst distances between Mayan and non-Mayan populations indicate that prior to Bonferroni adjustments all pair-wise comparisons generate statistically significant differences. Subsequent to Bonferroni correction, 10 pair-wise Rst distance comparisons involving YUP (4), INU (3) or QUE (3) in combination with Mayan populations became non significantly different (Supplementary Table 5).
The MDS plot presents the Central Mongolian (KHA) and the Inupiat Eskimo population from Alaska (INU) as outliers (Figure 3). The Athabascan (Nadene) population from Alaska (ATH) segregates close to the Mayan cluster in the upper right quadrant. The additional populations from South America (AYM and QUE), Alaskan Eskimo (YUP) and Inner Mongolia (MON) plot independently at a distance from the Mayan conglomerate.
Networks and TMRCA estimates
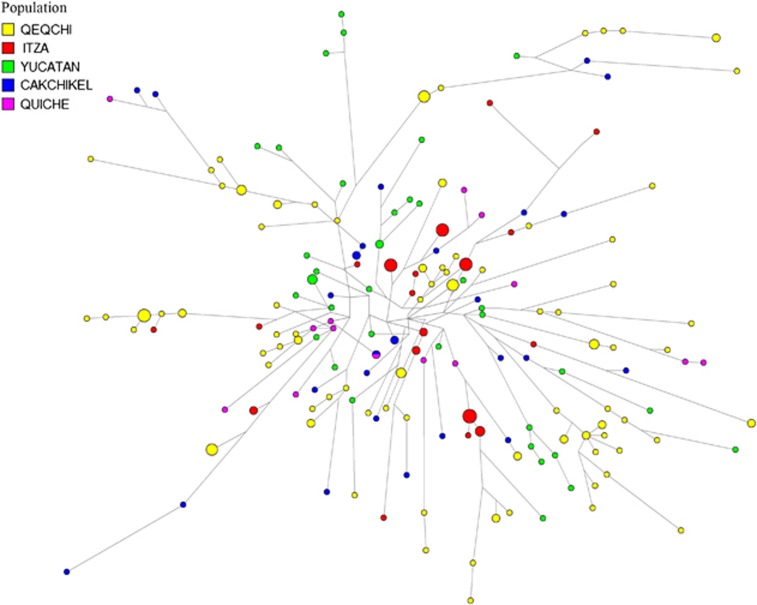
Network analyses were performed based on individuals under haplogroups Q1a2a1a1*-M3 (Figure 4) and Q1a2a1*-L54 (Figure 5). These two haplogroups represent the two most abundant lineages in the Mayan populations genotyped. Considering only autochthonous haplogroups, Q1a2a1a1*-M3 and Q1a2a1*-L54 (combined) are fixed in four Mayan populations. Only Yucatán exhibits a third low frequency Native American haplotype, Q1a2a1a1b-M194 (6%). Within the Q1a2a1a1*-M3 network, other than the clustering of some Q'eqchi individuals at the extreme end of some branches and the presence of nodes from Itza at the center of the projection, no partitioning of populations is observed. For the most part, the individuals from the five Mayan populations within this haplogroup are distributed randomly throughout the network. The vast majority of the haplotypes are singletons. A number of exceptions are the multi-individuals nodes of Itza individuals located near the extrapolated center of the non star-like network and a number differentiated haplotypes made up of Q'eqchis. Only one node exhibiting inter-population haplotype sharing is seen in the Q1a2a1a1*-M3 network. It is noteworthy that the persons from Q'eqchi Petén predominantly occupy peripheral positions in the network stemming from nodes belonging to Itza individuals.
Figure 4.
Network for haplogroup Q-M3. The full colour version of this figure is available at European Journal of Human Genetics online.
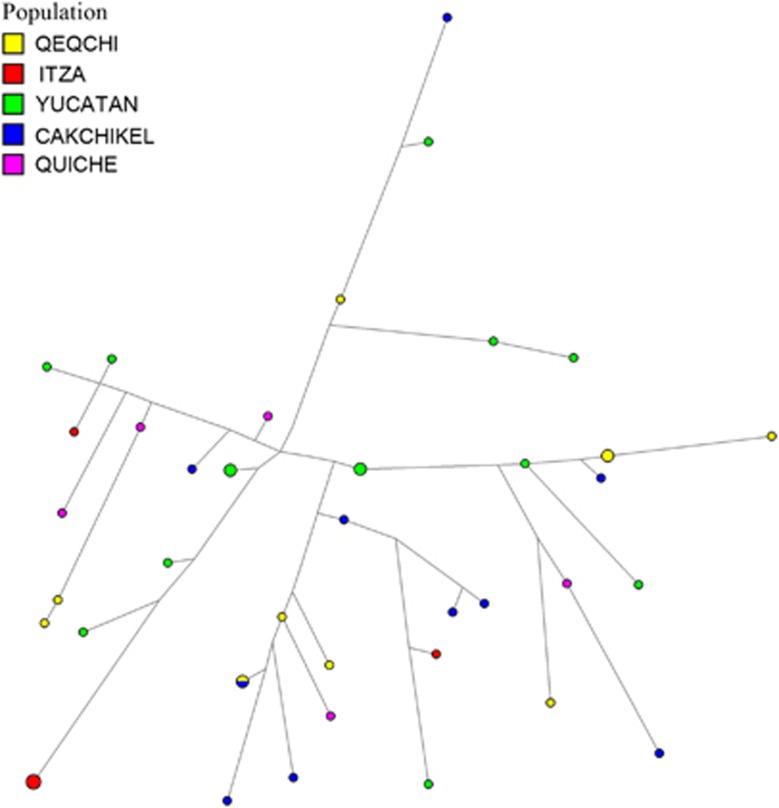
Figure 5.
Network for haplogroup Q-L54. The full colour version of this figure is available at European Journal of Human Genetics online.
Evolutionary26 and genealogical27 TMRCA estimates were computed. The oldest dates for the M242 mutation that defines haplogroup Q are 31.8±3.7 ky (evolutionary) and 12.3±1.4 ky (genealogical) in Q'eqchi and the youngest are 26.4±3.9 ky (evolutionary) and 10.2±1.5 ky (genealogical) in Itza. The TMRCA estimates for all Q1a2a1a1*-M3 lineages range from 31.7±3.6 to 21.8±4.1 ky and from 12.3±1.4 to 8.4±1.6 ky, respectively, depending on the Mayan population in question (Supplementary Table 6). Again Q'eqchi possesses the oldest time estimates while Itza the youngest. The highest variance estimates for haplogroup Q1a2a1a1*-M3 is found in Q'eqchi (Vp=0.7098) and the lowest in Itza (Vp=0.4280) (Supplementary Table 6).
The Q1a2a1*-L54 network exhibits a random, non star-like distribution of samples from the five Mayan populations. The haplotypes from the five different populations are widely dispersed throughout the network. Immediate connections among nodes often involve individuals from different populations. Most of the nodes are singletons and only one instance of inter-population haplotype sharing is observed. The evolutionary26 and genealogical27 TMRCA estimates for all Q1a2a1*-L54 lineages range from 41.7±11.5 ky (Itza) to 21.0±4.5 ky (Quiche) and 16.1±4.5 ky (Itza) to 8.1±1.8 ky (Quiche), respectively, depending on the Mayan population in question (Supplementary Table 6). The highest mean variance estimates for haplogroup Q1a2a1*-L54 is observed in Itza (Vp=0.7781) and the lowest in Quiche (Vp=0.5200) (Supplementary Table 6). The time estimates for the Q1a2a1a1b-M194 mutation found only in the population of Yucatán is 8.2±2.1 ky (evolutionary) and 3.2±0.8 ky (genealogical).
AMOVA
AMOVA demonstrates statistically significant correlation between genetic diversity and geographical partitioning (Supplementary Table 7). The greatest amount of diversity (75.8%) is found within populations, followed by variation among groups of populations (18.2%), and among populations within groups (6%).
Discussion
The five populations genotyped in this study were selected because they represent the main regions within the traditional territory of the Mayan Empire. These populations also constitute the diverse ecological habitats and geological spectrum within the Mayan realm. In addition, they also exemplify regions that flourished at different time periods during Mayan history (ie, ancient, pre-classical, classical and post-classical periods). From north to south, we sampled the population of Yucatán, in southeast Mexico, a lime stone, flat land home to City–States that date back from the classic period to the late post-classic, Itza in the rainforest of northern Guatemala with enclaves spanning the classic and post-classic, Q'eqchi in hilly central Guatemala with communities going back to the ancient and early pre-classic to the classic epochs, and the Cakchikel and Quiche in the highland forests of southwestern Guatemala with settlements encompassing the pre-classic to the classic.
Limited information exists on the genetic homogeneity, or the lack of it, within the traditional Mayan realm. Some genetic homogeneity is expected since both anthropological and linguistic evidence suggest that Mayans have a common ancestry. The notion that Mayans and Native Americans, in general, are of common Asian extraction is supported by the limited number of genetic markers that they exhibit and share. For example, the Y-SNP profiles indicate that individuals of the five Mayan populations genotyped in this study overwhelming belong to only two Q haplogroup lineages, Q1a2a1a1*-M3 and Q1a2a1*-L54. Within haplogroup Q, Q1a2a1*-L54 predominates in populations from the South Altaic (100%) and the Tuva Republic (95.8%) while Q1a2a1a1*-M3 prevails in Northeastern Siberia (77.9%).1 Thus, based on Y-SNP data, the five regionally distinct Mayan populations reported in this study are closely related exhibiting limited heterogeneity.
For the most part, our Y-STR results corroborate the Y-SNP findings. The observed Y-STR diversity is homogeneously distributed among the five Mayan populations genotyped in this study. The calculated Rst distances demonstrate that prior to the Bonferroni adjustments only six (six of 25) pair-wise comparisons involving the five Mayan populations exhibit significant genetic differences. Five of the six significantly different comparisons involve the populations from Itza and Yucatan, the two groups most impacted by recent gene flow from Europe, Africa and Asia. It is likely that these comparisons generating significant differences stem from the heterogeneity introduced by recent non-autochthonous gene flow events. Three of the six significantly different comparisons became non significant subsequent to Bonferroni corrections. These close genetic affinities among all Mayan populations are also reflected in the MDS results. The positioning of some South American and North American reference populations near the compact Mayan cluster suggests phylogenetic relationships among these Native American groups and Mayans likely due to sharing an Asian common ancestry. The Mongolian (MON and KHA) and Alaskan Eskimo groups (INU and YUP), geographically the most distant from Mesoamerica, segregate the furthest from the Mayan conglomerate in the MDS plot. This hierarchy in genetic distances as a function of geographical span is corroborated by the AMOVA results, which exhibits a statistical correlation between genetic diversity and geography.
Overall, the networks based on haplogroups Q1a2a1a1*-M3 and Q1a2a1*-L54 indicate lack of sub-structure and population-specific partitioning in the of Y-STR diversity distribution within the Mayan territory. The abundance of related haplotypes, predominance of singletons as well as the ubiquitous and random distribution of individuals belonging to different Mayan populations suggest lack of regional barriers within the Mayan Empire, likely the result of recent, extensive movement of people, possibly involved in commerce and trade. The recent time estimates for these two haplogroups and the small number of mutations between nodes point to a rapid population growth not long ago, possibly subsequent to the birth of the Mayan culture and the development of agriculture. It is notable that the genealogical time estimates for Q1a2a1a1*-M3 (12.3–8.4 ky) and Q1a2a1*-L54 (16.1–8.1 ky) are close to each other and coincide with the proposed time period for the colonization of America by Paleo-Natives from Asia. This temporal proximity suggests a rapid dispersal from North Central Asia and Beringia to the Mayan region. It is possible that the Q1a2a1a1*-M3 mutation occurred soon after the genesis of Q1a2a1*-L54 during the trek from North Central Asia to Beringia. In fact, it has been previously advanced that Q1a2a1a1-M3 originated during a hiatus (of up to 15 000 years in duration) in Beringia and back migration transported the mutation to Asia.1 On the other hand, haplogroup Q1a2a1a1b-M194 exhibits more recent origins, about 3.2 kya, possibly after the establishment of the Mayan Empire. The restriction of this mutation to Yucatan, Mexico suggests that it took place there.
The abundance of haplogroup Q1a2a1a1*-M3 in Q'eqchi Petén (86%) is considerably higher than in any other Mayan group and the frequency of European, African and Asian non-indigenous haplogroups is only the second lowest (6%) to Quiche (5%). In the Q1a2a1a1*-M3 network, this Q'eqchi group is vastly represented by extreme nodes at the end of branches, all over the projection. These Q'eqchi end haplogroups connect directly to ancestral nodes that belong to the other four Mayan populations but especially to individuals from Itza. Conversely, the Itza individuals occupy central, less differentiated positions within the projection. This type of distribution scheme is compatible with some of the Y-STR diversity deriving from specific sources within the Mayan domain. In other words, it is possible that individuals from genetically unique Mayan regions migrated into Petén promoting genetic diversity. This contention is supported by the mean variance (Vp) and time estimates values based on the Q1a2a1a1*-M3 Q'eqchi individuals, the highest among the five Mayan populations. This scenario is also congruent with the intense commerce-driven and ceremonial travel practiced by Mayan City–States. And specifically, considering the pivotal role that the region of Petén played at the initial stages of the Mayan civilization, it is possible that people from different parts of the Empire journeyed to Petén for pilgrimage or trade.
Conclusion
In general, our results on the genetic diversity of contemporary Mayans illustrate a group of populations that in spite of the diverse habitats that they occupy, they exhibit considerable genetic homogeneity in the form of two predominant autochthonous Asian haplogroups that they share as well as limited and uniform Y-STR diversity. The degree of recent gene flow from European, African and Asian admixture varies with the specific Mayan population in question, but reflect historical accounts of colonial and post-colonial contacts. The Y-STR profiles point to similar haplotypes, abundance of singletons, limited population partitioning within networks and the lack of haplotype sharing among Mayan populations. These characteristics suggest recent population expansion and substantial gene flow within the Mayan domain possibly coinciding with the developing of agriculture and the establishment of the City–State system and commerce.
The authors declare no conflict of interest.
Footnotes
Supplementary Information accompanies this paper on European Journal of Human Genetics website (http://www.nature.com/ejhg)
Supplementary Material
References
- Regueiro M, Alvarez J, Rowold D, Herrera RJ: On the origins, rapid expansion and genetic diversity of Native Americans from hunting-gatherers to agriculturalists. Am J Phys Anth 2013; 150: 333–348. [DOI] [PubMed] [Google Scholar]
- Dulik MC, Zhadanov SI, Osipova LP et al: Mitochondrial DNA and Y chromosome variation provides evidence for a recent common ancestry between Native Americans and Indigenous Altaians. Am J Hum Genet 2012; 90: 1–18. [DOI] [PMC free article] [PubMed] [Google Scholar]
- Dillehay TD, Ramırez C, Pino M, Collins MB, Rossen J, Pino-Navarro JD: Monte Verde: seaweed, food, medicine, and the peopling of South America. Science 2008; 320: 784–786. [DOI] [PubMed] [Google Scholar]
- Rasmussen M, Anzick SL, Waters MR et al: The genome of a Late Pleistocene human from a Clovis burial site in western Montana. Nature 2014; 506: 225–229. [DOI] [PMC free article] [PubMed] [Google Scholar]
- Ibarra-Rivera L, Mirabal S, Regueiro MM, Herrera RJ: Delineating genetic relationships among the Maya. Am J Phys Anth 2008; 135: 329–347. [DOI] [PubMed] [Google Scholar]
- Blanton RE, Kowalewski SA, Feinman GM, Finsten LM: Ancient Mesoamerrica: a Comparison of Change in Three Regions Ancient. Cambridge, UK: Cambridge University Press, 1997. [Google Scholar]
- Coe MD: Breaking the Maya code. New York: Thames & Hudson, 1999. [Google Scholar]
- Inomata T, MacLellana J, Triadana D, Munsonb J, Burhama M: Development of sedentary communities in the Maya lowlands: coexisting mobile groups and public ceremonies at Ceibal, Guatemala. Proc Natl Acad Sci 2015; 112: 4268–4273. [DOI] [PMC free article] [PubMed] [Google Scholar]
- Inomata T, Triadan D, Aoyama K, Castillo V, Yonenobu H: Early ceremonial constructions at Ceibal, Guatemala, and the origins of lowland Maya civilization. Science 2013; 340: 467–471. [DOI] [PubMed] [Google Scholar]
- Sharer R, Traxler L: The Ancient Maya. Stanford: Stanford University Press, 2005. [Google Scholar]
- Coe MD: The Maya. New York: Thames & Hudson, 2005. [Google Scholar]
- Sharer RJ: Daily Life in Maya Civilization. Westport CT: The Greenwood Press, 2009. [Google Scholar]
- Calderon S, Perez-Benedico D, Mesa L, Guyton D, Rowold DJ, Herrera RJ: Phylogenetic and forensic studies of the Southeast Florida Hispanic population using the next-generation forensic PowerPlexY23 STR marker system. Legal Med 2013; 15: 289–292. [DOI] [PubMed] [Google Scholar]
- Luis JR, Rowold DJ, Regueiro MM et al: The Levant versus the Horn of Africa: evidence for bidirectional corridors of human migrations. Am J Hum Gen 2004; 74: 532–544. [DOI] [PMC free article] [PubMed] [Google Scholar]
- Martinez L, Reategui EP, Fonesca LR et al: Superimposing polymorphism: The case of a point mutation within a polymorphic Alu insertion. Hum Hered 2005; 59: 109–117. [DOI] [PubMed] [Google Scholar]
- Hammer MF, Horai S: Y chromosomal DNA variation and the peopling of Japan. Am J Hum Genet 1995; 56: 951–962. [PMC free article] [PubMed] [Google Scholar]
- Gayden T, Regueiro M, Martinez L, Cadenas AM, Herrera RJ: Human Y-chromosome haplotyping by allele-specific polymerase chain reaction. Electrophoresis 2008; 29: 2419–2423. [DOI] [PubMed] [Google Scholar]
- Y Chromosome Consortium: A nomenclature system for the tree of human Y-chromosomal binary haplogroups. Genome Res 2002; 12: 339–348. [DOI] [PMC free article] [PubMed] [Google Scholar]
- Karafet TM, Mendez FL, Meilerman MB, Underhill PA, Zegura SL, Hammer MF: New binary polymorphisms reshape and increase resolution of the human Y chromosomal haplogroup tree. Genome Res 2008; 18: 830–838. [DOI] [PMC free article] [PubMed] [Google Scholar]
- Myres N, Rootsi S, Lin A et al: A major Y-chromosome haplogroup R1b Holocene era founder effect in Central and Western Europe. Eur J Hum Genet 2011; 19: 95–101. [DOI] [PMC free article] [PubMed] [Google Scholar]
- Underhill PA, Passarino G, Lin AA et al: The phylogeography of Y chromosome binary haplotypes and the origins of modern human populations. Ann Hum Gen 2001; 65: 43–62. [DOI] [PubMed] [Google Scholar]
- Applied Biosystems. AmpFlSTR Identifiler PCR Amplification Kit User's ManualFoster City, California 2001.
- Raymond M, Rousset F: An exact test for population differentiation. Evol 1995; 149: 1280–1283. [DOI] [PubMed] [Google Scholar]
- Schneider S, Roessli D, Excoffier L Alequin v.2000: A Software For Population Genetics Data Analysis. Geneva, Genetics and Biometry Laboratory, University of Geneva, 2000.
- Kayser M, Brauer S, Schadlich H et al: Y chromosome STR haplotypes and the genetic structure of U.S. populations of African, European, and Hispanic ancestry. Genome Res 2003; 13: 624–634. [DOI] [PMC free article] [PubMed] [Google Scholar]
- Zhivotovsky LA, Underhill PA, Cinnioğlu C et al: The effective mutation rate at Y chromosome short tandem repeats, with application to human population divergence time. Am J Hum Genet 2004; 74: 50–61. [DOI] [PMC free article] [PubMed] [Google Scholar]
- Goedbloed M, Vermeulen M, Fang RN et al: Comprehensive mutation analysis of 17 Y chromosomal short tandem repeat polymorphisms included in the AmpFlSTR Yfiler PCR amplification kit. Int J Legal Med 2009; 123: 471–482. [DOI] [PMC free article] [PubMed] [Google Scholar]
Associated Data
This section collects any data citations, data availability statements, or supplementary materials included in this article.


