Abstract
In this work, a novel colorimetric strategy for miRNA analysis is proposed based on hybridization chain reaction (HCR)-mediated localized surface plasmon resonance (LSPR) variation of silver nanoparticles (AgNPs). miRNA in the sample to be tested is able to release HCR initiator from a solid interface to AgNPs colloid system by toehold exchange-mediated strand displacement, which then triggers the consumption of fuel strands with single-stranded tails for HCR. The final produced long nicked double-stranded DNA loses the ability to protect AgNPs from salt-induced aggregation. The stability variation of the colloid system can then be monitored by recording corresponding UV-vis spectrum and initial miRNA level is thus determined. This sensing system involves only four DNA strands which is quite simple. The practical utility is confirmed to be excellent by employing different biological samples.
miRNAs are a group of single-stranded, endogenous, small noncoding RNA molecules (approximately 18–25 nucleotides), which play significant regulatory roles in numerous biological processes including cellular proliferation, differentiation and apoptosis1,2,3. Aberrant expressions of certain miRNAs have been found to be indicative in a variety of human diseases4. Recently, certain miRNAs have been employed as biomarkers for early clinical diagnosis of some cardiovascular diseases, infectious diseases and cancers5,6,7,8. For instance, miR-29a-3p is found to be down-regulated in throat swabs of the subjects infected with influenza A virus H1N19; let-7a levels in severe asthma patients can be used to distinguish distinct phenotypes of the disease10; mir-133b, mir-133a-2, and mir-1-2 levels are found to be significantly correlated with tumor pathologic and stage of gastric cancer11. So far, great efforts have been made for the development of sensitive and selective analytical methods. However, some obstacles exist and traditional techniques are limited for certain applications12,13. For example, qRT-PCR requires complicated primer design and housekeeping gene for normalization14; microarray is able to realize fluorescent imaging of miRNAs with multiple channels but only semi-quantitative information can be obtained15; electrochemical techniques always need time-consuming modification of electrode interface16; surface enhanced Raman spectroscopy (SERS) is rarely used in application for non-SERS active molecules17. Hence, it is important to establish advanced methods for miRNA quantification with simple design and high sensitivity.
The field of plasmonic colorimetric sensing based on noble metal nanoparticles has been well established with high sensitivities, and convenient operations without complicated labels18,19,20,21,22. In recent years, different silver nanoparticles (AgNPs) synthesis and modification methods have been developed for the detection of a variety of molecules based on the localized surface plasmon resonance (LSPR) effect23,24,25. These studies exhibit certain advantages due to fine properties of AgNPs like easy of synthesis, high extinction coefficients and stability26,27.
Herein, we propose a novel hybridization chain reaction (HCR)-based colorimetric biosensor to conveniently detect miR-29a-3p for the application of clinical diagnosis. HCR is an enzyme-free and target-induced fuel strands assembly process28. The final product is long nicked double-stranded DNA. The reaction has been widely applied for DNA detection with PCR-like sensitivity29,30,31. In this work, we have realized the release of HCR initiator from a solid interface by target miRNA, which triggers HCR in AgNPs colloid system in the presence of two DNA probes. Since single-stranded DNA interacts with AgNPs through the exposed nitrogen-containing bases, nanoparticles aggregation induced by salt can be effectively prevented. Therefore, single-stranded DNA can act as the stabilizer of the colloid system. Nevertheless, double-stranded DNA exposes no nitrogen-containing bases and cannot interact with AgNPs. After HCR initiated by target miRNA, the transformation of fuel strands with single-stranded DNA tails to double-stranded DNA changes the stabilization ability of DNA molecules in AgNPs colloid system, which can be reflected by UV-vis spectrum. This simply designed method for the detection of miRNA achieves the limit of detection as low as 1 pM, which is lower than or at least comparable to other enzyme-mediated colorimetric assays.
Results and Discussion
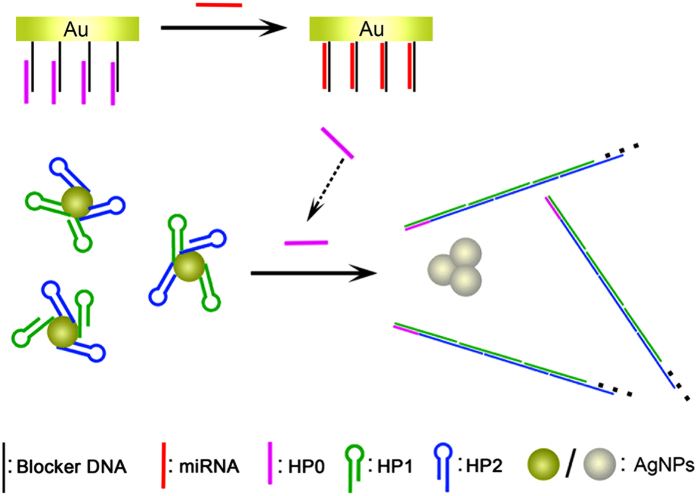
The detailed strategy for colorimetric assay of miRNA is illustrated in Fig. 1. Briefly, Blocker DNA is immobilized on a gold solid interface via thiol-gold interaction32. By partial hybridization with another DNA probe named HP0, double-stranded DNA is formed. The gold solid interface is then immersed in the mixture of AgNPs and two DNA probes named as HP1 and HP2, which are not only two fuels strands for hybridization chain reaction33, but also act as stabilizers of AgNPs colloid system. The presence of HP1 and HP2 makes AgNPs much more stable. The nanoparticles disperse well in 0.1 M MgCl2 and the UV–vis spectrum peak barely changes. Since a toehold exists at the duplex on the gold solid interface, the introduced target miRNA could initiate strand displacement reaction, releasing HP0 back to the solution, which further triggers the hybridization chain reaction, generating long double-stranded DNA product. Thereby, due to the lack of single-stranded tails of HP1 and HP2, the colloid system of AgNPs is less stable against the treatment of salt. By analyzing UV-vis spectrum of the system, the phenomenon of miRNA-induced aggregation of AgNPs could be quantified.
Figure 1. Scheme of the colorimetric strategy for miRNA assay.
The prepared AgNPs suspension is transparent and yellow colored. From the TEM image in Fig. 2a, it is observed that AgNPs disperse well in water and the diameter is about 5 nm. Moreover, a well characteristic absorbance peak at the wavelength around 400 nm can be confirmed in the UV–vis spectrum of AgNPs (Fig. 2b). After miRNA-induced HP0 release and the following HCR, the aggregation of AgNPs can be observed, which confirms the effectiveness of the proposed strategy (inset in Fig. 2a).
Figure 2.
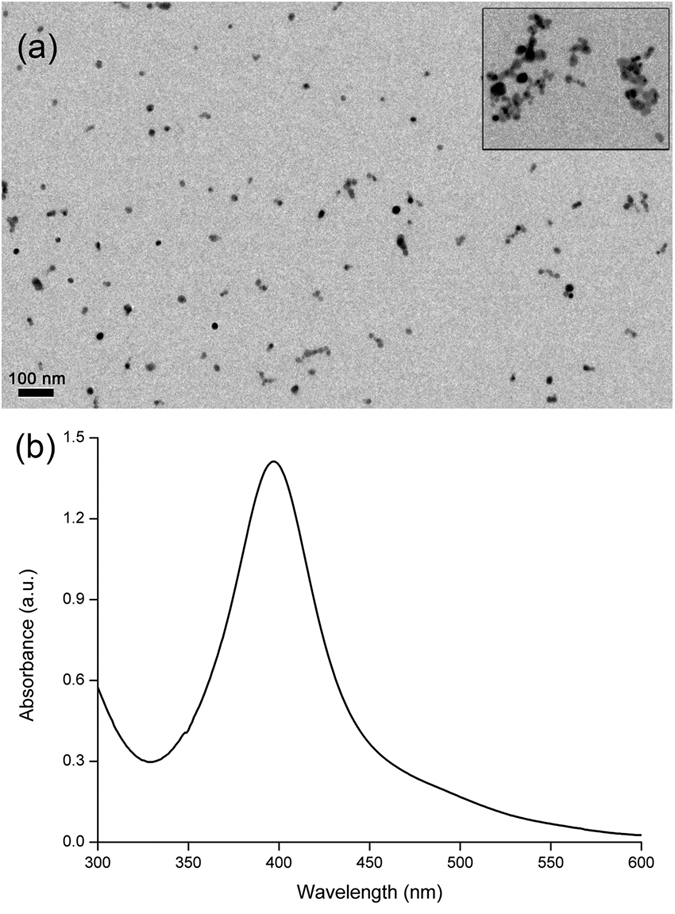
(a) TEM image of AgNPs. Inset is the image after miRNA induced HP0 release and subsequent HCR. (b) UV–vis spectrum of bare AgNPs.
To achieve the optimized aggregation condition, we have performed preliminary experiments. Divalent cations are much more effective to neutralize negative charges on the surface of AgNPs than monovalent cations like Na+. A series of Mg2+ concentrations have been used to check the salt-tolerance of AgNPs. More Mg2+ may lead to the larger decrease of the absorbance peak. The ratio of net decreased peak (ΔA/A0) is used to represent the distribution state of AgNPs. Figure 3a shows the relationship between ΔA/A0 of bare AgNPs and the concentration of Mg2+. The fitting curve is a Boltzmann sigmoid and the equation is as follows:
Figure 3.
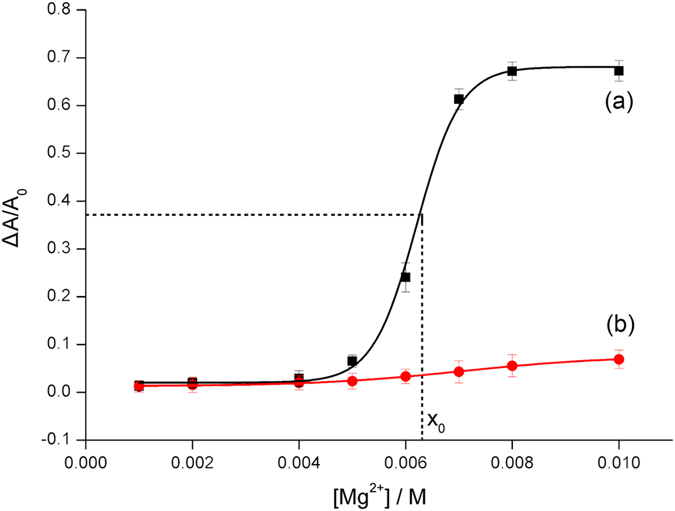
ΔA/A0 of (a) bare AgNPs, (b) HP1 and HP2 protected AgNPs versus the concentration of Mg2+. The slim dash lines represent the position of the critical point for salt-tolerance of bare AgNPs. Error bars represent standard deviations of three measurements.
 |
in which y is ΔA/A0, x is the concentration of Mg2+, A1 = 0.0204, A2 = 0.6810, x0 = 0.0062, dx = 0.0004, n = 3, R2 = 0.9977. The slope of this fitting curve reaches a maximum value at the point of 0.0062, indicating that AgNPs is most sensitive to the changes of salt when the concentration of Mg2+ is 6.2 mM, which is then used for the following colorimetric investigation. However, in the case of AgNPs protected by HP1 and HP2, ΔA/A0 barely increases after the treatment of Mg2+, which demonstrates the high stability of the AgNPs stabilized by DNA probes with single-stranded DNA tails (Fig. 3b).
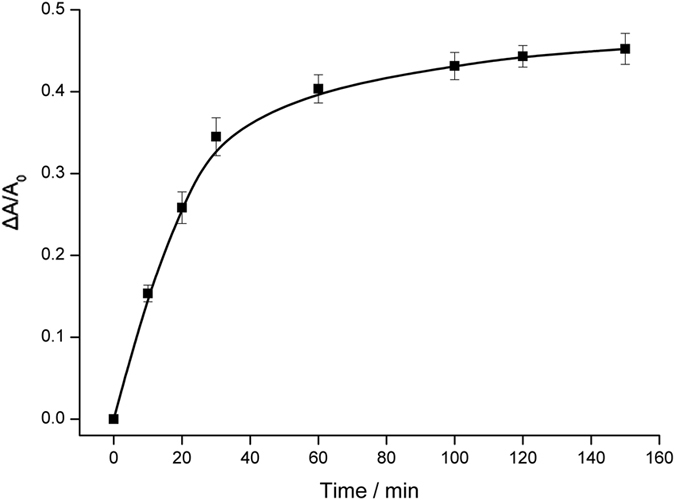
UV-vis spectra are recorded for the experiments using miRNA of different concentrations to trigger strand displacement reaction and further HCR. HCR could be directly confirmed by a gel electrophoresis experiment. The bands representing much larger molecular weight are observed after the reaction, indicating the formation of assembled long double-stranded DNA (inset in Fig. 4a). Furthermore, the presence of miRNA leads to the decrease of absorbance peak, which is shown in Fig. 4a. More miRNA releases more HP0, and leads to the consumption of more stabilizers. Finally, the absorbance peak decreases accordingly. Optimized reaction time of hybridization chain reaction is identified to be 100 min by comparing the recorded absorbance peaks (Fig. 5). Figure 4b depicts the calibration curve reflecting the relationship between ΔA/A0 and miRNA concentration. Corresponding AgNPs colors are also shown. From the Figure, a linear dependency is obtained with a fitting equation of
Figure 4.
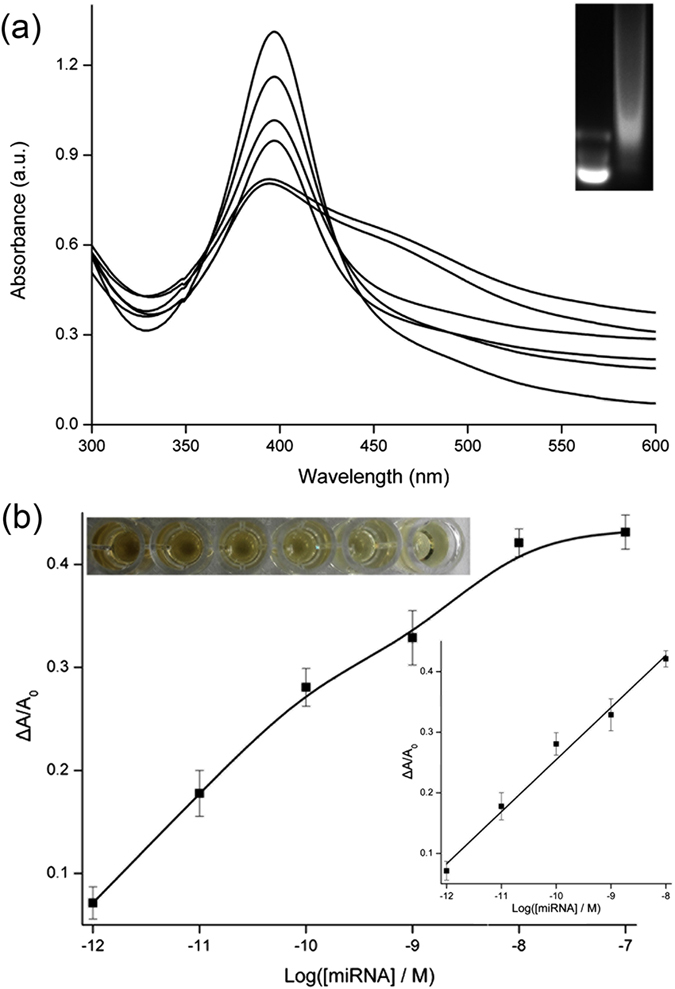
(a) UV–vis spectra of mixtures of AgNPs, Mg2+, HP1, HP2, and HP0 released by miRNA with different concentrations: 1 pM, 10 pM, 100 pM, 1 nM, 10 nM, 100 nM (from top to bottom). Inset is the agarose gel electrophoresis analysis of mixture of HP1 and HP2 (left) and mixture of HP0, HP1 and HP2 (right). (b) Calibration curve of ΔA/A0 versus logarithmic miRNA concentration. Inset are the corresponding solution colors and linear curve.
Figure 5. Relationship between ΔA/A0 and duration of hybridization chain reaction.
 |
in which y is ΔA/A0, x is the concentration of target miRNA, n = 3, R2 = 0.9869. The limit of detection is calculated to be 1 pM (S/N = 3), which is sufficient for the application of clinical diagnosis. For example, influenza A virus H1N1 diagnostics can be performed by the detection of the biomarker of miR-29a-3p using the proposed colorimetric strategy.
A representative member of miR-29 family, miR-29c, is chosen to be detected by the proposed method, which contains only single base mismatch compared with miR-29a. The resulted ΔA/A0 is negligible, which confirms the high specificity of this method for the detection or target miRNA.
In addition, we have carried out experiments involving real samples to check the practical utility of this colorimetric biosensor. Throat swabs from healthy and infected individuals are collected and treated before the colorimetric assay. Moreover, a commercial qRT-PCR Kit is employed to obtain the control values. The results listed in Table 1 reveal that the detected values of the two methods are consistent with each other. The proposed colorimetric assay could distinguish infected individuals by accurately determining the level of the biomarker. Sampling and colorimetric assay operations are both quite simple, which could promise great practical utility.
Table 1. Validations of miR-29a-3p levels in samples from healthy and infected individuals by the proposed colorimetric method and qRT-PCR.
| Sample | Colorimetry (pM) | qRT-PCR (pM) |
|---|---|---|
| Healthy individual | 83 | 86 |
| 75 | 72 | |
| Infected individual | 17 | 19 |
| 14 | 18 |
In summary, we have herein developed a novel colorimetric strategy for visual miRNA detection based on hybridization chain reaction. Target miRNA could release HP0 to the solution to trigger HCR, which hinders the protection of AgNPs by single-stranded DNA tails of HP1 and HP2 from divalent cation-induced aggregation. The information of UV–vis spectra can then be used to reveal the initial miRNA level. This non-enzymatic method involves only four DNA strands, which is quite simple. Moreover, it also has high sensitivity towards the clinical diagnosis applications.
Methods
Materials and Chemicals
The methods were carried out in accordance with institutional and national guidelines and with the approval of the Medical Ethics Committee of The First Affiliated Hospital of Soochow University (no.2012076). Informed consent was obtained from all subjects. The study was also conducted in accordance with the Declaration of Helsinki. Silver nitrate (AgNO3), sodium borohydride (NaBH4), tris(2-carboxyethyl) phosphine hydrochloride (TCEP), trisodium citrate, diethypyrocarbonate (DEPC), mercaptohexanol (MCH), ethylenediaminetetraacetic acid (EDTA) were purchased from Sigma (USA). All other reagents were of analytical grade. Human samples were from local hospital. Water used was previously purified by a Millipore system to 18 MΩ cm resistivity and treated with DEPC. All DNAs and miRNA were obtained from Takara Biotechnology Co., Ltd. (Dalian, China). The sequence were listed in Table 2. TEM images were taken by using a FEI Tecnai G20 transmission electron microscopy (FEI, USA). UV-vis spectra were measured by an Agilent Cary 300 Scan UV-vis absorption spectrophotometer (Agilent Technologies, USA).
Table 2. DNA and miRNA sequences.
| Name | Sequence (from 5′ to 3′) |
|---|---|
| miR-29a-3p | UAGCACCAUCUGAAAUCGGUUA |
| miR-29c-3p | UAGCACCAUUUGAAAUCGGUUA |
| Blocker DNA | CCGTAACCGATTTCAGATGGTGCTATTTT-SH |
| HP0 | CGGTTACGGTTACGGTTA |
| HP1 | CGGTTACGGTTACTAGAGTAACCGTAACCGTAACCG |
| HP2 | CTCTAGTAACCGTAACCGCGGTTACGGTTACGGTTA |
Preparation of AgNPs
Bare AgNPs were synthesized according to a previously reported protocol34. Briefly, AgNO3 solution and trisodium citrate solution were prepared and mixed. The concentrations of AgNO3 and trisodium citrate were both 0.25 mM. NaBH4 solution was then prepared with the concentration of 10 mM. 3 mL of NaBH4 solution was added to 100 mL of the mixture of AgNO3 and trisodium citrate. Then, the reaction solution was stirred vigorously for 0.5 h. Afterwards, the solution was kept in dark and left to sit for 24 h. The formed AgNPs were later purified by three cycles of centrifugation at 12,000 g for 0.5 h.
Optimization of Mg2+ Concentration
Bare AgNPs could keep stable due to presence of negatively charged citrate. However, with the disturbance of salt in the colloid system, aggregation occurred and the color of the solution changed correspondingly. Mg2+ with a series of concentrations were prepared to induce the aggregation of AgNPs. Absorbance peaks were recorded and ratios of net decreased peak values (ΔA/A0) were calculated. After analysing the data, the critical value of Mg2+ to induce aggregation was found to represent the Mg2+-tolerance of AgNPs35.
Gel electrophoresis Experiments
Different DNA samples were monitored for comparison by 4% agarose gel electrophoresis for 30 min (100 V). The photograph of gel stained with ethidium bromide was taken under UV light by a Gel DocTM XR+ System (Bio-Rad, USA).
UV-vis Spectroscopy Analysis of miRNA
Plasmonic colorimetric detection of miRNA was carried out as follows. 2 μM HP1 and HP2 were added to AgNPs solution to protect the colloid system. Standard miRNA solutions with the concentration from 1 pM to 100 nM was prepared to treat Blocker DNA/HP0 duplex modified gold solid interface for 1 h. The released HP0 in the solution was then transferred to HP1 and HP2 protected AgNPs. Since HP0 could initiate HCR and make colloid system less stable, after the addition of Mg2+ with the critical value, AgNPs aggregated, which was recorded by UV-vis absorption spectrophotometer.
Determination of miRNA in Real Samples
To verify the practical utility of this method in human samples, throat swabs from healthy and infected (H1N1 influenza A virus) individuals were collected and diluted by sterile saline for miRNA analysis. Total RNA were extracted by a RNA extraction kit from Qiagen according to manufacture’s instructions. The levels of miR-29a-3p were then calculated referring to the linear curve of the proposed colorimetric assay. In addition, the results obtained from commercial Quant One Step qRT-PCR Kit were used as the controls.
Additional Information
How to cite this article: Miao, J. et al. A plasmonic colorimetric strategy for visual miRNA detection based on hybridization chain reaction. Sci. Rep. 6, 32219; doi: 10.1038/srep32219 (2016).
Acknowledgments
This work is supported by the National Natural Science Foundation of China (grant no. 31400847 and 31500805) and the Natural Science Foundation of Jiangsu Province of China (grant no. BK20141204).
Footnotes
Author Contributions H.G. and P.M. designed the experiments. J.M., J.G. and K.H. conducted the experiments. J.W. and C.J. participated in the experiments and discussions. H.G. and P.M. wrote the paper.
References
- Shimono Y. et al. Downregulation of miRNA-200c links breast cancer stem cells with normal stem cells. Cell 138, 592–603 (2009). [DOI] [PMC free article] [PubMed] [Google Scholar]
- Cheloufi S., Dos Santos C. O., Chong M. M. W. & Hannon G. J. A Dicer-independent miRNA biogenesis pathway that requires Ago catalysis. Nature 465, 584–589 (2010). [DOI] [PMC free article] [PubMed] [Google Scholar]
- Ong S. G., Lee W. H., Kodo K. & Wu J. C. MicroRNA-mediated regulation of differentiation and trans-differentiation in stem cells. Adv. Drug Deliv. Rev. 88, 3–15 (2015). [DOI] [PMC free article] [PubMed] [Google Scholar]
- de Leeuw D. C. et al. MicroRNA-551b is highly expressed in hematopoietic stem cells and a biomarker for relapse and poor prognosis in acute myeloid leukemia. Leukemia 30, 742–746 (2016). [DOI] [PubMed] [Google Scholar]
- Tao L. C., Bei Y. H., Zhou Y. L., Xiao J. J. & Li X. L. Non-coding RNAs in cardiac regeneration. Oncotarget 6, 42613–42622 (2015). [DOI] [PMC free article] [PubMed] [Google Scholar]
- Miao P. et al. Nuclease assisted target recycling and spherical nucleic acids gold nanoparticles recruitment for ultrasensitive detection of microRNA. Electrochim. Acta 190, 396–401 (2016). [Google Scholar]
- Adams B. D., Anastasiadou E., Esteller M., He L. & Slack F. J. The inescapable influence of noncoding RNAs in cancer. Cancer Res. 75, 5206–5210 (2015). [DOI] [PMC free article] [PubMed] [Google Scholar]
- Zhang J., Xiao X. J. & Liu J. The role of circulating miRNAs in multiple myeloma. Sci. China-Life Sci. 58, 1262–1269 (2015). [DOI] [PubMed] [Google Scholar]
- Loo J. F. C. et al. A non-PCR SPR platform using RNase H to detect MicroRNA 29a-3p from throat swabs of human subjects with influenza A virus H1N1 infection. Analyst 140, 4566–4575 (2015). [DOI] [PubMed] [Google Scholar]
- Rijavec M., Korosec P., Zavbi M., Kern I. & Malovrh M. M. Let-7a is differentially expressed in bronchial biopsies of patients with severe asthma. Sci Rep 4, 6103 (2014). [DOI] [PMC free article] [PubMed] [Google Scholar]
- Chen S. L. et al. Combination of miRNA and RNA functions as potential biomarkers for gastric cancer. Tumor Biol. 36, 9909–99918 (2015). [DOI] [PubMed] [Google Scholar]
- Miao P., Wang B. D., Yu Z. Q., Zhao J. & Tang Y. G. Ultrasensitive electrochemical detection of microRNA with star trigon structure and endonuclease mediated signal amplification. Biosens. Bioelectron. 63, 365–370 (2015). [DOI] [PubMed] [Google Scholar]
- Zhang H., Liu Y., Gao J. & Zhen J. H. A sensitive SERS detection of miRNA using a label-free multifunctional probe. Chem. Commun. 51, 16836–16839 (2015). [DOI] [PubMed] [Google Scholar]
- Peltier H. J. & Latham G. J. Normalization of microRNA expression levels in quantitative RT-PCR assays: Identification of suitable reference RNA targets in normal and cancerous human solid tissues. RNA-Publ. RNA Soc. 14, 844–852 (2008). [DOI] [PMC free article] [PubMed] [Google Scholar]
- Luo Q. J. et al. Evidence for Antisense Transcription Associated with MicroRNA Target mRNAs in Arabidopsis. Plos Genetics 5, 1000457 (2009). [DOI] [PMC free article] [PubMed] [Google Scholar]
- Zhao J., Hu S. S., Cao Y., Zhang B. & Li G. X. Electrochemical detection of protein based on hybridization chain reaction-assisted formation of copper nanoparticles. Biosens. Bioelectron. 66, 327–331 (2015). [DOI] [PubMed] [Google Scholar]
- Ouyang L., Li D. Y., Zhu L. H., Yang W. W. & Tang H. Q. A new plasmonic Pickering emulsion based SERS sensor for in situ reaction monitoring and kinetic study. J. Mater. Chem. C 4, 736–744 (2016). [Google Scholar]
- Yue G. Z. et al. Gold nanoparticles as sensors in the colorimetric and fluorescence detection of chemical warfare agents. Coord. Chem. Rev. 311, 75–84 (2016). [Google Scholar]
- Vilela D., Gonzalez M. C. & Escarpa A. Sensing colorimetric approaches based on gold and silver nanoparticles aggregation: Chemical creativity behind the assay. A review. Anal. Chim. Acta 751, 24–43 (2012). [DOI] [PubMed] [Google Scholar]
- Liu S. H. & Han M. Y. Silica-coated metal nanoparticles. Chem.-Asian J. 5, 36–45 (2010). [DOI] [PubMed] [Google Scholar]
- Zhang W. W., Vinueza N. R., Datta P. & Michielsen S. Functional dye as a comonomer in a water-soluble polymer. J. Polym. Sci. Pol. Chem. 53, 1594–1599 (2015). [Google Scholar]
- Zhu L., Younes A. H., Yuan Z. & Clark R. J. 5-Arylvinylene-2,2′-bipyridyls: Bright “push-pull” dyes as components in fluorescent indicators for zinc ions. J. Photochem. Photobiol. A-Chem. 311, 1–15 (2015). [DOI] [PMC free article] [PubMed] [Google Scholar]
- Noh K. C., Nam Y. S., Lee H. J. & Lee K. B. A colorimetric probe to determine Pb2+ using functionalized silver nanoparticles. Analyst 140, 8209–8216 (2015). [DOI] [PubMed] [Google Scholar]
- Hu R. et al. Highly sensitive colorimetric sensor for the detection of H2PO4- based on self-assembly of p-sulfonatocalix[6]arene modified silver nanoparticles. Sens. Actuator B-Chem. 218, 191–195 (2015). [Google Scholar]
- Okochi M., Kuboyama M., Tanaka M. & Honda H. Design of a dual-function peptide probe as a binder of angiotensin II and an inducer of silver nanoparticle aggregation for use in label-free colorimetric assays. Talanta 142, 235–239 (2015). [DOI] [PubMed] [Google Scholar]
- Cao Y., Wang J., Xu Y. Y. & Li G. X. Sensing purine nucleoside phosphorylase activity by using silver nanoparticles. Biosens. Bioelectron. 25, 1032–1036 (2010). [DOI] [PubMed] [Google Scholar]
- Miao P. et al. Melamine functionalized silver nanoparticles as the probe for electrochemical sensing of clenbuterol. ACS Appl. Mater. Interfaces 6, 8667–8672 (2014). [DOI] [PubMed] [Google Scholar]
- Dirks R. M. & Pierce N. A. Triggered amplification by hybridization chain reaction. Proc. Natl. Acad. Sci. USA 101, 15275–15278 (2004). [DOI] [PMC free article] [PubMed] [Google Scholar]
- Ma C. P., Wang W. S., Mulchandani A. & Shi C. A simple colorimetric DNA detection by target-induced hybridization chain reaction for isothermal signal amplification. Anal. Biochem. 457, 19–23 (2014). [DOI] [PubMed] [Google Scholar]
- Li C. X., Wang H. Y., Shen J. & Tang B. Cyclometalated Iridium Complex-Based Label-Free Photoelectrochemical Biosensor for DNA Detection by Hybridization Chain Reaction Amplification. Anal. Chem. 87, 4283–4291 (2015). [DOI] [PubMed] [Google Scholar]
- Liu P. et al. Enzyme-Free Colorimetric Detection of DNA by Using Gold Nanoparticles and Hybridization Chain Reaction Amplification. Anal. Chem. 85, 7689–7695 (2013). [DOI] [PubMed] [Google Scholar]
- Bo B. et al. An electrochemical biosensor for clenbuterol detection and pharmacokinetics investigation. Talanta 113, 36–40 (2013). [DOI] [PubMed] [Google Scholar]
- Huang F. J., Zhou X., Yao D. B., Xiao S. Y. & Liang H. J. DNA polymer brush patterning through photocontrollable surface-initiated DNA hybridization chain reaction. Small 11, 5800–5806 (2015). [DOI] [PubMed] [Google Scholar]
- Doty R. C., Tshikhudo T. R., Brust M. & Fernig D. G. Extremely stable water-soluble Ag nanoparticles. Chem. Mat. 17, 4630–4635 (2005). [Google Scholar]
- Miao P. et al. Highly sensitive, label-free colorimetric assay of trypsin using silver nanoparticles. Biosens. Bioelectron. 49, 20–24 (2013). [DOI] [PubMed] [Google Scholar]


