

Abstract
Purpose
The use of multivariable clinical models to assess postoperative prognosis in ovarian cancer increased. All published models incorporate surgical debulking. However, postoperative CT can detect residual disease (CT-RD) in 40% of optimally resected patients. The aim of our study was to investigate the added value of incorporating CT-RD evaluation into clinical models for assessment of overall survival (OS) and progression free survival (PFS) in patients after primary cytoreductive surgery (PCS).
Methods
212 women with PCS for advanced ovarian cancer between 01/1997-12/2011, and a contrast enhanced abdominal CT 1-7 weeks after surgery were included in this IRB approved retrospective study. Two radiologists blinded to clinical data, evaluated all CT for the presence of CT-RD, and Cohen's kappa assessed agreement. Cox proportional hazards regression with stepwise selection was used to develop OS and PFS models, with CT-RD incorporated afterwards. Model fit was assessed with bootstrapped Concordance Probability Estimates (CPE), accounting for over-fitting bias by correcting the initial estimate after repeated subsampling.
Results
Readers agreed on the majority of cases (179/212, k=0.68). For OS and PFS, CT-RD was significant after adjusting for clinical factors with a CPE 0.663 (p=0.0264) and 0.649 (p=0.0008). CT-RD was detected in 37% of patients assessed as optimally debulked (RD<1 cm) and increased the risk of death (HR: 1.58, 95% CI: 1.06-2.37%).
Conclusion
CT-RD is a significant predictor after adjusting for clinical factors for both OS and PFS. Incorporating CT-RD into the clinical model improved the prediction of OS and PFS in patients after PCS for advanced ovarian cancer.
Keywords: Ovarian carcinoma, survival, residual disease, debulking
Introduction
Ovarian cancer has the highest tumor specific mortality and is the leading cause of death from gynecologic cancer in the United States(1). The staging system developed by the International Federation of Gynecology and Obstetrics (FIGO) is commonly used to determine prognosis and assign an optimized therapeutic regimen(2). The initial treatment approach which typically includes primary cytoreductive surgery is known to have a high impact on mortality as the presence of residual tumor after surgery is one of the most important prognostic factors(3). Other factors influencing prognosis include age and the presence of ascites(4, 5).
Nomograms are gaining more and more acceptance to improve prognostic accuracy for clinical outcome by incorporating several independently weighted prognostic factors into a single quantitative risk probability (6-9). At least four nomograms have been developed for patients with ovarian cancer after primary cytoreduction (10-13), which all include information on the intraoperative assessment of residual disease after primary cytoreductive surgery as a predictive factor. However, none have looked at the added value of imaging residual disease assessment to clinical parameters and optimal debulking assessment. The Gynecologic Oncology Group (GOG) defines “optimal” cytoreduction as no residual disease > 1 cm in longest diameter after surgery (14). Although optimal cytoreduction is widely accepted as an important prognostic factor, its definition is based on the operating surgeon's assessment at the end of the procedure, based on visual inspection and manual measurement of the largest remaining tumor. A study with simulated patients illustrated how difficult this clinical validation is, with many errors and a high interobserver variability (15). More surgeons underestimated than overestimated tumor diameters and that ovarian cancer treatment protocols based on tumor volume are subject to significant measurement errors (15). To improve the reliability of residual disease assessment several studies have examined the value of postoperative CT in patients considered optimally resected clinically and found that CT revealed residual disease in up to 40% of clinically optimally resected patients (16-18). Outcome analysis also showed that those patients with residual disease on postoperative CT scans have a significantly worse prognosis than patients that were free of disease (16, 18).
Therefore the aim of our study was to investigate the added value of CT residual disease assessment to baseline clinical models in the prediction of overall and recurrence free survival in patients with advanced stage epithelial ovarian cancer.
Materials and Methods
Patients
This retrospective study was approved by our Institutional Review Board, which waived the informed consent requirement. All patients that underwent primary cytoreductive surgery by an attending gynecologic oncologist in our institution between January 1997 and December 2011 were eligible. Inclusion criteria were: (i) primary cytoreductive surgery for stage III or IV ovarian cancer; (ii) Contrast enhanced abdominal CT performed within 1-7 weeks after surgery and before initiation of chemotherapy (iii) Complete clinical data. Fifty one patients were included that were scanned in a prospective study protocol with pre- and postoperative CT scans. Results have been published for the postoperative CT component (18).
Image acquisition and analysis
CT scans were performed on GE Lightspeed helical scanners (GE Medical Systems, Milwaukee, WI). Images were reconstructed at 5-mm or 7.5-mm intervals. All patients received oral (900 cc dilute Hypaque solution) and intravenous (150 cc Omnipaque-300) contrast medium before the examination. CT scans performed at outside institutions were reviewed by one of the coauthors and included in the study only if judged to be of acceptable imaging quality.
Two readers with 12 years (--) and 4 years (--) of experience respectively, in gynecologic cancer imaging independently and retrospectively interpreted the images according to the previous published papers analyzing RD with postoperative CT (16-18). The readers were blinded to all clinical information. Readers recorded the presence of residual disease using a five point scale (1: definitely no disease, 2: probably no disease, 3: indeterminate, 4: probably disease and 5: definitely disease). Residual disease was dichotomized for all analyses into negative (scores 1-3) and positive (scores 4-5). A lesion was recorded as suspicious (4 or 5) only when larger than 1 cm in diameter.
Data collection
The hospital patient information system was used to collect the clinical and surgical data for each patient including preoperative age, FIGO stage, preoperative albumin, tumor histology, history of hereditary breast/ovarian cancer syndrome (HBOC), history of personal breast cancer, preoperative CA125, ascites at surgery, American Society of Anesthesiologists (ASA) score, and surgical debulking. These variables were chosen based on our literature review (10-13) and data availability.
Date of progression was defined by either follow-up CT scan, CA-125 level or biopsy, whichever test occurred first. Progressive disease based on CT was defined as either new lesions or enlargement of residual disease after completion of adjuvant chemotherapy. Progressive disease based on CA-125 level was defined when CA-125 levels were twice over the nadir value or twice above normal values (19). Overall Survival (OS) time was defined as the interval between date of surgery and date of death or date of last follow up. Patients alive were censored. Progression Free Survival (PFS) time was defined as the interval between date of surgery and date of recurrence, death or date of last follow up. Patients alive and disease free were censored.
Statistical analysis
Inter-observer agreement and agreement between CT and surgical assessment was analyzed with Cohen's kappa statistic and interpreted as follows: k<0.00 - no agreement, 0.00<ĸ≤0.20 - slight agreement, 0.21≤ĸ≤0.40 - fair agreement, 0.41≤ĸ≤0.60 - moderate agreement, 0.61≤ĸ≤0.80 -substantial agreement, and 0.81≤ĸ≤1.0 - almost perfect agreement (20). To be able to calculate kappa, surgical debulking was grouped into ≤1 cm and >1cm. additionally, the percent of agreement and disagreement was presented.
Frequencies and percent were used to summarize categorical variables, and medians and ranges were used to summarize continuous variables. Clinical variables were grouped as follows for survival analyses: 1) Histology: Papillary vs. endometrioid, clear cell, and mixed; 2) Stage: III vs. IV; 3) ASA: 1-2 vs. 3-4; 4) Surgical Debulking: Complete vs. 0-1 cm vs. >1cm; 5) Breast cancer history: Yes vs. no; and 6) HBOC: Yes vs. no. Continuous variables were examined for normality and CA-125 was transformed with the natural logarithm.
Overall OS and PFS were presented in Kaplan Meier plots. Additionally, we used Kaplan Meier methods to provide overall OS and PFS broken down by surgical debulking assessment. OS and PFS were examined in separate Cox proportional hazards regression models. Cox proportional hazards was chosen over a cumulative hazard competing risks model as too few competing events (n=6) were present to assess in a competing risks framework. We checked for an interaction between surgical debulking and CT residual disease assessment. Surgical and clinical parameters were entered into stepwise selection models with entry criteria of α=0.10 and exit criteria of α=0.05. In a second step, CT residual disease assessment was then added into the selected models and significance was assessed with p<0.05 as the criteria. After these models were built, nomograms were created to provide a quantifiable probability of 5 year OS and PFS.
The predictive discrimination of our models was quantified using Concordance Probability Estimate (CPE) developed by Gonen and Heller (21). Asymptotic 95% confidence intervals were provided. Discrimination refers to the model's ability to correctly separate patients with events from those without events and was assessed with the concordance index mentioned above. This index produces a similar statistic to the area under the receiver operating characteristic curve (AUC), but takes into account censored outcomes in its calculation. Similarly, it can range from 0.5(no discrimination ability) to 1 (perfect discrimination ability). The CPE was adjusted with 500 bootstrap resamples to account for over-fitting bias. Bootstrapping is a method of model bias correction where repeated subsets of the initial sample are taken and the statistical tests are run on each of these subsamples. The initial estimates are then corrected based on the repeated analyses.
Additionally, calibration was used with n=40 to assess each patient's predicted probability compared to the patient's actual risk at 5 years. Tabular output and calibration plots with the predicted probability versus the observed mortality were created. Corrected Kaplan Meier estimates served as the patients' true risk assessment.
P values less than 0.05 were considered statistically significant. Statistical analyses and graphing were performed using SAS 9.4 (SAS Institute, Cary, NC), Stata SE 12 (StataCorp, 2011), and R version 3.1.1 (R Development Core Team, 2014) with “Hmisc,” “CPE,” “rms,” and “survival” packages added.
Results
Patient characteristics
A total of 212 patients were included in the study. The median age was 60 years (range: 23-82 years) and all patients were newly diagnosed with ovarian cancer FIGO stage III (n= 123, 58%) or IV (n= 89, 42%). At the end of follow up, 47 patients were alive without evidence of recurrent disease (22%), 56 were alive with disease (26%), 103 patients died from ovarian cancer (49%), 2 patients died of other causes (1%), and 4 patients died of unknown causes (2%). For OS and PFS see Figure 1. The median follow up was 38.1 months (range: 0.8-129.4 months) and the median time to death was 36.1months (range: 0.8-120.5 months). For completely debulked patients (R=0), the median KM OS estimates were 70 months (95% CI: 55-NE months) compared to 57 months (95% CI: 41-69 months) for patients with ≤1cm RD and 32 months (95% CI: 20-51 months) for patients with >1cm RD. Additionally, median KM PFS estimated were 23 months (95% CI: 19-36 months) for R0 resected patients, compared to 15 months (95% CI: 13-18 months) for <1cm RD patients and 11 months (95% CI: 8-16 months) for >1cm RD patients. Overall, 171 of the 212 patients (81%) recurred or died during the follow up period. Additional patient characteristics can be found in Table 1.
Figure 1. A) Overall and B) Progression Free Survival after cytoreductive surgery.
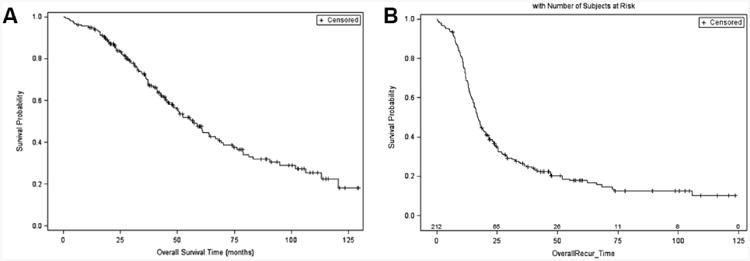
Table 1. Demographics and tumor histology.
| N | % | |
|---|---|---|
|
| ||
| Patients | 212 | |
| Age at diagnosis in years (median, range) | 60.0 (23.1–81.6) | |
|
| ||
| Histology: | ||
|
| ||
| Serous (I) | 202 | (95.3) |
| Endometrioid (II) | 2 | (0.9) |
| Clear Cell (III) | 3 | (1.4) |
| Mixed (IV) | 5 | (2.4) |
|
| ||
| Stage: | ||
|
| ||
| FIGO III | 123 | (58.0) |
| FIGO IV | 89 | (42.0) |
|
| ||
| Clinical information: | ||
|
| ||
| Preoperative Albumin (median, range) | 4.1 (2.0-5.0) | |
| Surgical debulking | ||
| No residual disease | 104 | (49.1) |
| Residual disease < 1 cm | 83 | (39.2) |
| Residual disease > 1cm | 25 | (11.8) |
|
| ||
| History suggestive of HBOC: | ||
|
| ||
| Yes | 60 | (28.3) |
| No | 152 | (71.7) |
|
| ||
| ASA | ||
|
| ||
| I | 7 | (3.3) |
| II | 118 | (55.7) |
| III | 85 | (40.1) |
| IV | 2 | (0.9) |
| Days between Surgery and CT (median, range) | 19 | (6-49) |
HBOC = Hereditary breast / ovarian cancer syndrome; ASA=American Society of Anesthesiologists' Score
Debulking status
After surgical assessment 187 of 212 (88.2%) were regarded as optimally resected without residual disease over 1 cm, in 83 (39.2%) patients the surgeon reported residual disease < 1 cm, 104 patients were considered completely free of disease (49.1%) and 25 patients (11.8%) had residual disease larger than 1 cm.
The median time between surgery and CT was 19 days (range: 6-49 days). On postoperative CT scans reader 1 detected disease in 90 patients (42.3%) and reader 2 in 89 patients (42.0%). Inter-reader agreement was substantial (k=0.68, 95% CI: 0.58-0.78). Therefore, the assessments of the more experienced reader were used in the survival models (CT-RD). CT-RD was detected in 69 of 187 patients by R1 (36.9%) and in 70 of 187 patients by R2 (37.4%) after primary cytoreductive surgery assessed as optimally debulked (RD 0 or < 1 cm). The agreement between CT-RD and intraoperative debulking assessment was slight with k=0.20 (95% CI: 0.10-30) for R1 and k=0.20 (95% CI: 0.10-0.31) for R2. The percent agreement was only 64.6% (137/212) for R1 and 65.1% (138/212) for R2. The surgeon indicated no residual disease in 104 cases, in those R1 and R2 indicated CT-RD in 32 (30.7%) and 34 cases (32.7%), respectively. An overview of the site of residual disease for both readers is given in table 2. In only 5 cases (2.4%) for both readers, CT-RD did not indicate RD where the surgical assessment had.
Table 2. Residual disease in patients regarded as optimally debulked at surgery.
| Patients – R0 resection by surgery | Reader 1 | Reader 2 | ||
|---|---|---|---|---|
| N = 104 | (N) | (%) | (N) | (%) |
| CT-RD | 32 | (30.7) | 34 | (32.7) |
| Supradiaphragmatic disease | 12 | (11.5) | 7 | (6.7) |
| Perihepatic | 21 | (20.2) | 13 | (12.5) |
| Perisplenic | 6 | (5.8) | 3 | (2.9) |
| Omental | 9 | (8.7) | 10 | (9.6) |
| Organ metastasis | 3 | (2.9) | 5 | (4.8) |
Overall Survival
All clinical variables were entered into a stepwise model, and after selection surgical debulking (p<0.0001), histology (p=0.0042), HBOC (p=0.0303), PreOp albumin (p=0.0422), and PreOp age (p=0.0081) remained significant predictors of OS. This model had a bootstrap-adjusted CPE of 0.652 (95% CI: 0.610-0.694). CT-RD was then added to the model and was a significant predictor of OS (p=0.0264). Having residual disease on CT increased one's risk of death (HR: 1.58, 95% CI: 1.06-2.37). The bootstrap adjusted CPE was 0.663 (95% CI: 0.621-0.704), slightly higher than the baseline clinical models, though these could not be directly compared. Please see table 2 for more information.
As a separate sensitivity analysis, we checked whether an interaction existed between surgical debulking status and CT-RD in an OS model. No significant interaction was found (p=0.31) when the interaction was added to the main effects model.
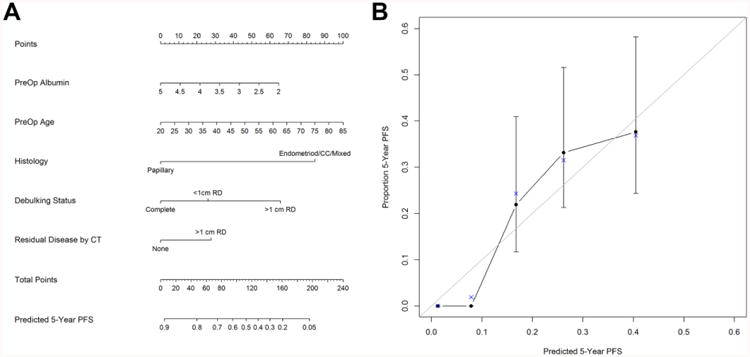
The nomogram for predicting OS is summarized in Figure 2A. To determine a patients' 5 year survival probability, one determines the points for each of the predictors, aligning the value with the corresponding top scale (Points). The points are then summed and the total points are compared to the 5 year survival probability at the bottom(22). Further, the calibration plot (Figure 2B) demonstrates the predicted probabilities from the nomogram versus the Kaplan-Meier estimated 5 year probability for OS, and table 3 numerically demonstrates how close the predicted estimates are from the true probabilities. As one can see from the table, the predicted values are within 1 standard error of the actual values, demonstrating modest calibration.
Figure 2.

A) Overall Survival Nomogram and B) Model Calibration. Instruction: Locate the patient's preoperative albumin value on the axis. Draw upwards to the Points axis to determine the value for the patient's preoperative albumin regarding the survival probability. Repeat this for the other axes and sum up the points for each predictor. Locate this value on the Total Points axis and draw a straight line down to the patient's probability to survive 5 years.
Table 3. Cox Proportional Hazards Regression Models.
| Modality | Parameter | Level | HR | [95% CI] | p-value |
|---|---|---|---|---|---|
| OS: Clinical(S) | Surgical Debulking | <1cm Residual Disease | 1.70 | [1.10- 2.62] | .0165 |
| >1cm Residual Disease | 3.89 | [2.15- 7.04] | <.0001 | ||
| Complete Resection | REF | ||||
| PreOp Albumin | 0.67 | [0.45- 0.99] | .0422 | ||
| Histology | Endometrioid/CC/Mixed | 3.95 | [1.54- 10.10] | .0042 | |
| Papillary | REF | ||||
| HBOC | No | REF | |||
| Yes | 0.61 | [0.39- 0.95] | .0303 | ||
| PreOp Age | 1.03 | [1.01- 1.05] | .0081 | ||
| OS: Clinical(S)+CT | Surgical Debulking | <1cm Residual Disease | 1.60 | [1.03- 2.48] | .0346 |
| >1cm Residual Disease | 3.16 | [1.70- 5.87] | .0003 | ||
| Complete Resection | REF | ||||
| CT Residual Disease | No | REF | |||
| Yes | 1.58 | [1.06- 2.37] | .0264 | ||
| PreOp Albumin | 0.68 | [0.45- 1.01] | 0.06 | ||
| Histology | Endometrioid/CC/Mixed | 4.30 | [1.67- 11.04] | .0024 | |
| Papillary | REF | ||||
| HBOC | No | REF | |||
| Yes | 0.63 | [0.40- 0.99] | .0457 | ||
| PreOp Age | 1.03 | [1.01- 1.05] | .0093 | ||
| PFS: Clinical(S) | Surgical Debulking | <1cm Residual Disease | 1.92 | [1.39- 2.67] | <.0001 |
| >1cm Residual Disease | 4.07 | [2.51- 6.59] | <.0001 | ||
| Complete Resection | REF | ||||
| HBOC | No | REF | |||
| Yes | 0.69 | [0.49- 0.98] | .0365 | ||
| PreOp Age | 1.01 | [1.00- 1.03] | .0434 | ||
| PFS: Clinical(S)+CT | Surgical Debulking | <1cm Residual Disease | 1.77 | [1.27- 2.46] | .0008 |
| >1cm Residual Disease | 3.23 | [1.96- 5.33] | <.0001 | ||
| Complete Resection | REF | ||||
| CT Residual Disease | No | REF | |||
| Yes | 1.72 | [1.25- 2.36] | .0008 | ||
| HBOC | No | REF | |||
| Yes | 0.72 | [0.51- 1.02] | 0.07 | ||
| PreOp Age | 1.02 | [1.00- 1.03] | .0438 |
HBOC = Hereditary breast / ovarian cancer syndrome, RD = residual disease,(S)=selected model, REF = reference
Progression Free Survival
Surgical debulking (p<0.0001), HBOC (p=0.0365), and PreOp age (p=0.0434) remained significant predictors of PFS after selection procedures. The bootstrap adjusted CPE for this model was 0.639 (95% CI: 0.599-0.679). CT-RD assessment remained a significant predictor (p=0.0008) after adjusting for the above covariates. The risk for progression increased (HR: 1.72, 95% CI: 1.25-2.36) when residual disease was found on CT. The bootstrap adjusted CPE was 0.649 (95% CI: 0.612-0.686), again slightly higher than the baseline model, though they could not be directly compared.
As a separate sensitivity analysis, we checked whether an interaction existed between surgical debulking status and CT-RD in a PFS model. No significant interaction was found (p=0.50) when the interaction was added to the main effects model.
Figure 3A shows the PFS nomogram and Figure 3B contains the calibration plot and table. As one can see from the plot and nomogram, the probability of being progression free at 5 years is quite low. The calibration is moderate on the high end with most of the predicted values being within one standard error of the Kaplan Meier estimate. Given the low probability of being progression free, standard errors were not estimable on the lower end.
Figure 3. A) Progression Free Survival Nomogram and B) Model Calibration.
Discussion
In our study, CT evaluation of residual disease was significantly associated with OS and PFS after controlling for significant clinical predictors, including surgical debulking. CT models also demonstrated slightly higher CPE of 0.663 compared to 0.652 for OS and 0.649 compared to 0.639 for PFS. These are the first models integrating postoperative CT assessment into clinical models, which include surgical debulking assessment, for predicting the OS and PFS.
Assessment of individual patient prognosis after primary surgical debulking for epithelial ovarian cancer is essential. However, as previous studies showed, FIGO stage alone is an oversimplification, especially for stage III and IV ovarian cancer (13). As a result, four different survival models were proposed to predict outcome after primary surgery, integrating postoperative residual disease based on surgical assessment (10-13). Barlin et al. proposed an all stage nomogram for patients after primary surgery, with seven clinical factors including surgical assessment for residual disease, including surgical assessment for complete resection, age, FIGO stage, preoperative albumin, tumor histology type, history of hereditary breast /ovarian cancer syndrome and ASA score(13). The three other nomograms also incorporated surgical residual disease assessment as a predictive factor (10-12). In a prospective multicenter study, a multivariate survival analysis of 226 patients treated with surgery and platinum-based chemotherapy revealed that patient age (p=0.02) and complete cytoreduction (p = 0.001) were the best predictive factors for progression free and overall survival (23). Additionally Teramukai et al dertermined a prognostic index with age, performance status, histologic cell type and residual tumor size, categorizing patients in three risk groups (24). These previous studies indicate the importance of surgical residual disease assessment as a prognostic factor for patients after primary cytoreductive surgery for advanced ovarian cancer. However, previous studies published that in up to 40% of patients regarded optimally resected during surgery, a postoperative CT detected residual disease larger than 1 cm (16-18). Residual disease on postoperative CT was also associated with a reduced OS (16, 18). Therefore, we generated a new model integrating CT-RD data with significant clinical predictors for OS and PFS. The relationship between residual disease volume and overall survival in high stage ovarian cancer has also been shown by Winter et al. in a cohort of 360 patients with ovarian carcinoma stage FIGO IV they showed a significantly worse outcome for patients with residual disease larger than 5 cm (25). In our cohort residual disease larger than 5 cm was identified only in 6 patients by reader 1 and in 5 patients by reader 2; therefore, we did not examine this outcome further.
Our study has several limitations. First, we did not have histology confirmation for residual disease detected on postoperative CT scans. Second, despite a long time frame we had a relatively small study population that made internal validation and calibration difficult and produced wide confidence intervals. Similarly, due to the selection of a long study interval, the imaging protocols and scanner types were variable and could not be controlled for in our analysis. Third, this was a single institution study and the practical implementation in other clinical settings still needs external validation. We also acknowledge that the retrospective nature of this study impairs the reliability of the analysis and that a prospective assessment in a larger study population would be necessary to validate the two nomograms incorporating CT-RD to predict OS and PFS.
With the current study we confirmed that postoperative CT detected residual disease larger than 1 cm in 37 % of the patients and that residual disease on CT (CT RD) was associated with an increased risk of death and progression. Furthermore, we proposed two nomograms to predict 5-year progression free survival and overall survival, which incorporated CT RD and clinical predictors, demonstrating that CT RD has significant value in addition to that of clinical predictors and surgical residual disease assessment. These nomograms require prospective and external validation.
Supplementary Material
Table 4. Calibration Estimates for Figures 2B and 3B.
| Model | N | Predicted | KM Est | SE |
|---|---|---|---|---|
| OS | 38 | 0.14 | 0.15 | 0.52 |
| 40 | 0.38 | 0.45 | 0.19 | |
| 39 | 0.51 | 0.43 | 0.22 | |
| 40 | 0.61 | 0.53 | 0.16 | |
| 40 | 0.73 | 0.77 | 0.1 | |
| PFS | 40 | 0.13 | 0 | NA |
| 38 | 0.08 | 0.02 | NA | |
| 39 | 0.17 | 0.24 | 0.32 | |
| 39 | 0.26 | 0.32 | 0.23 | |
| 30 | 0.4 | 0.37 | 0.22 |
OS = Overall survival, PFS = Progression free survival
Highlights.
Surgical assessment of residual disease is an important prognostic factor after primary cytoreductive surgery for advanced ovarian cancer.
Postoperative CT detects residual disease larger than 1 cm (CT-RD) in 37 % of patients regarded as completely resected.
Including CT-RD into a nomogram to predict 5-year overall-survival improves the concordance probability estimates compared to clinical predicators only.
Acknowledgments
Irene A. Burger was financially supported by the Prof. Dr. Max Cloëtta Foundation (Switzerland) and the Swiss Society of Nuclear Medicine.
Footnotes
Conflict of Interest: There is no potential conflict of interest relevant to this article.
Publisher's Disclaimer: This is a PDF file of an unedited manuscript that has been accepted for publication. As a service to our customers we are providing this early version of the manuscript. The manuscript will undergo copyediting, typesetting, and review of the resulting proof before it is published in its final citable form. Please note that during the production process errors may be discovered which could affect the content, and all legal disclaimers that apply to the journal pertain.
References
- 1.Society AC. Cancer Facts & Figures 2011. Atlanta: American Cancer Society; 2011. p. 10. [Google Scholar]
- 2.Prat J Oncology FCoG. Staging classification for cancer of the ovary, fallopian tube, and peritoneum. International journal of gynaecology and obstetrics: the official organ of the International Federation of Gynaecology and Obstetrics. 2014;124:1–5. doi: 10.1016/j.ijgo.2013.10.001. [DOI] [PubMed] [Google Scholar]
- 3.Chi DS, Liao JB, Leon LF, et al. Identification of prognostic factors in advanced epithelial ovarian carcinoma. Gynecol Oncol. 2001;82:532–7. doi: 10.1006/gyno.2001.6328. [DOI] [PubMed] [Google Scholar]
- 4.Makar AP, Baekelandt M, Trope CG, Kristensen GB. The prognostic significance of residual disease, FIGO substage, tumor histology, and grade in patients with FIGO stage III ovarian cancer. Gynecol Oncol. 1995;56:175–80. doi: 10.1006/gyno.1995.1027. [DOI] [PubMed] [Google Scholar]
- 5.Current FIGO staging for cancer of the vagina, fallopian tube, ovary, and gestational trophoblastic neoplasia. Int J Gynecol Obstet. 2009;105:3–4. doi: 10.1016/j.ijgo.2008.12.015. [DOI] [PubMed] [Google Scholar]
- 6.Shariat SF, Kattan MW, Vickers AJ, et al. Critical review of prostate cancer predictive tools. Future Oncol. 2009;5:1555–84. doi: 10.2217/fon.09.121. [DOI] [PMC free article] [PubMed] [Google Scholar]
- 7.Shukla-Dave A, Hricak H, Akin O, et al. Preoperative nomograms incorporating magnetic resonance imaging and spectroscopy for prediction of insignificant prostate cancer. BJU Int. 2012;109:1315–22. doi: 10.1111/j.1464-410X.2011.10612.x. [DOI] [PMC free article] [PubMed] [Google Scholar]
- 8.Lachance JA, Choudhri AF, Sarti M, et al. A nomogram for estimating the probability of ovarian cancer. Gynecologic oncology. 2011;121:2–7. doi: 10.1016/j.ygyno.2010.12.365. [DOI] [PubMed] [Google Scholar]
- 9.Lee CK, Simes RJ, Brown C, et al. A prognostic nomogram to predict overall survival in patients with platinum-sensitive recurrent ovarian cancer. Annals of oncology : official journal of the European Society for Medical Oncology / ESMO. 2013;24:937–43. doi: 10.1093/annonc/mds538. [DOI] [PubMed] [Google Scholar]
- 10.Chi DS, Palayekar MJ, Sonoda Y, et al. Nomogram for survival after primary surgery for bulky stage IIIC ovarian carcinoma. Gynecologic oncology. 2008;108:191–4. doi: 10.1016/j.ygyno.2007.09.020. [DOI] [PubMed] [Google Scholar]
- 11.Gerestein CG, Eijkemans MJ, de Jong D, et al. The prediction of progression-free and overall survival in women with an advanced stage of epithelial ovarian carcinoma. BJOG : an international journal of obstetrics and gynaecology. 2009;116:372–80. doi: 10.1111/j.1471-0528.2008.02033.x. [DOI] [PubMed] [Google Scholar]
- 12.Clark TG, Stewart ME, Altman DG, et al. A prognostic model for ovarian cancer. British journal of cancer. 2001;85:944–52. doi: 10.1054/bjoc.2001.2030. [DOI] [PMC free article] [PubMed] [Google Scholar]
- 13.Barlin JN, Yu C, Hill EK, et al. Nomogram for predicting 5-year disease-specific mortality after primary surgery for epithelial ovarian cancer. Gynecologic oncology. 2012;125:25–30. doi: 10.1016/j.ygyno.2011.12.423. [DOI] [PubMed] [Google Scholar]
- 14.Armstrong DK, Bundy B, Wenzel L, et al. Intraperitoneal cisplatin and paclitaxel in ovarian cancer. N Engl J Med. 2006;354:34–43. doi: 10.1056/NEJMoa052985. [DOI] [PubMed] [Google Scholar]
- 15.Prefontaine M, Gelfand AT, Donovan JT, Powell JL. Reproducibility of tumor measurements in ovarian cancer: a study of interobserver variability. Gynecologic oncology. 1994;55:87–90. doi: 10.1006/gyno.1994.1253. [DOI] [PubMed] [Google Scholar]
- 16.Sala E, Mannelli L, Yamamoto K, et al. The value of postoperative/preadjuvant chemotherapy computed tomography in the management of patients with ovarian cancer. International journal of gynecological cancer : official journal of the International Gynecological Cancer Society. 2011;21:296–301. [PubMed] [Google Scholar]
- 17.Chi DS, Ramirez PT, Teitcher JB, et al. Prospective study of the correlation between postoperative computed tomography scan and primary surgeon assessment in patients with advanced ovarian, tubal, and peritoneal carcinoma reported to have undergone primary surgical cytoreduction to residual disease 1 cm or less. Journal of clinical oncology : official journal of the American Society of Clinical Oncology. 2007;25:4946–51. doi: 10.1200/JCO.2007.12.2317. [DOI] [PubMed] [Google Scholar]
- 18.Lakhman Y, Akin O, Sohn MJ, et al. Early postoperative CT as a prognostic biomarker in patients with advanced ovarian, tubal, and primary peritoneal cancer deemed optimally debulked at primary cytoreductive surgery. AJR American journal of roentgenology. 2012;198:1453–9. doi: 10.2214/AJR.11.7257. [DOI] [PubMed] [Google Scholar]
- 19.Rustin GJ, Marples M, Nelstrop AE, et al. Use of CA-125 to define progression of ovarian cancer in patients with persistently elevated levels. Journal of clinical oncology : official journal of the American Society of Clinical Oncology. 2001;19:4054–7. doi: 10.1200/JCO.2001.19.20.4054. [DOI] [PubMed] [Google Scholar]
- 20.Landis JR, Koch GG. An application of hierarchical kappa-type statistics in the assessment of majority agreement among multiple observers. Biometrics. 1977;33:363–74. [PubMed] [Google Scholar]
- 21.Gonen M, Heller G. Concordance probability and discriminatory power in proportional hazards regression. Biometrika. 2005;92:965–70. [Google Scholar]
- 22.Kattan MW, Reuter V, Motzer RJ, et al. A postoperative prognostic nomogram for renal cell carcinoma. The Journal of urology. 2001;166:63–7. [PubMed] [Google Scholar]
- 23.Polterauer S, Vergote I, Concin N, et al. Prognostic value of residual tumor size in patients with epithelial ovarian cancer FIGO stages IIA-IV: analysis of the OVCAD data. International journal of gynecological cancer : official journal of the International Gynecological Cancer Society. 2012;22:380–5. doi: 10.1097/IGC.0b013e31823de6ae. [DOI] [PubMed] [Google Scholar]
- 24.Teramukai S, Ochiai K, Tada H, et al. PIEPOC: a new prognostic index for advanced epithelial ovarian cancer--Japan Multinational Trial Organization OC01-01. Journal of clinical oncology : official journal of the American Society of Clinical Oncology. 2007;25:3302–6. doi: 10.1200/JCO.2007.11.0114. [DOI] [PubMed] [Google Scholar]
- 25.Winter WE, 3rd, Maxwell GL, Tian C, et al. Tumor residual after surgical cytoreduction in prediction of clinical outcome in stage IV epithelial ovarian cancer: a Gynecologic Oncology Group Study. Journal of clinical oncology : official journal of the American Society of Clinical Oncology. 2008;26:83–9. doi: 10.1200/JCO.2007.13.1953. [DOI] [PubMed] [Google Scholar]
Associated Data
This section collects any data citations, data availability statements, or supplementary materials included in this article.