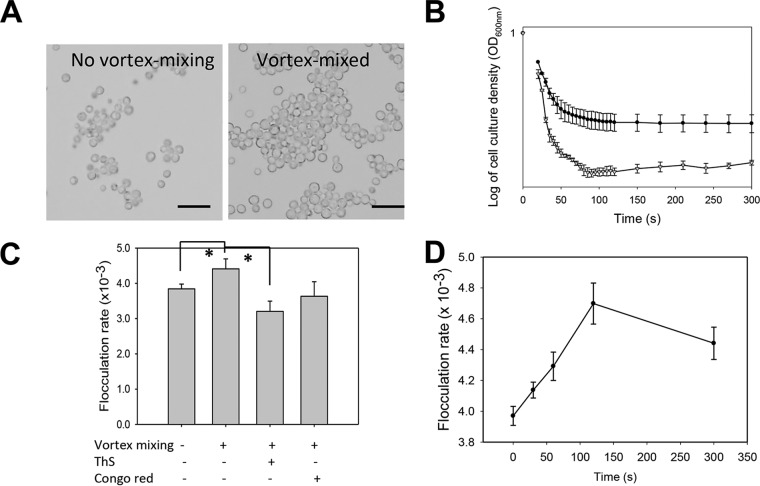
FIG 3 .
Effects of vortex mixing on the flocculation of S. cerevisiae cells expressing Flo1p. (A) Cells were left untouched or vortex mixed and then visualized in the absence of Ca2+. Scale bars = 20 µm. (B) Flocculation assays after the addition of 1.0 mM Ca2+. Cells were not mixed (●) or vortex mixed for 5 min (▽). (C) Flocculation rates in the absence or presence of the inhibitors ThS (200 µM) and CR (0.5 mM) (n = 3). *, P < 0.01 (Student’s t test). (D) Effect of duration of vortex mixing on activation of flocculation.

