Abstract
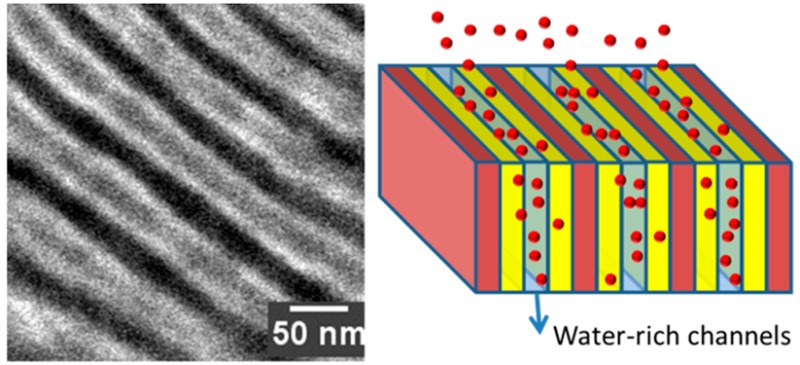
We introduce the use of block copolymer membranes for an emerging application, “drug capture”. The polymer is incorporated in a new class of biomedical devices, referred to as ChemoFilter, which is an image-guided temporarily deployable endovascular device designed to increase the efficacy of chemotherapy-based cancer treatment. We show that block copolymer membranes consisting of functional sulfonated polystyrene end blocks and a structural polyethylene middle block (S-SES) are capable of capturing doxorubicin, a chemotherapy drug. We focus on the relationship between morphology of the membrane in the ChemoFilter device and efficacy of doxorubicin capture measured in vitro. Using small-angle X-ray scattering and cryogenic scanning transmission electron microscopy, we discovered that rapid doxorubicin capture is associated with the presence of water-rich channels in the lamellar-forming S-SES membranes in aqueous environment.
Polymer electrolytes with charged groups covalently attached to their backbone have broad applications in fuel cells and batteries,1−6 clean-water-related technologies,7−9 and medicine.10−17 Within the realm of medical applications, there are many excellent studies on the development of polymers for drug delivery and controlled release.10−22 These applications require sophisticated polymer design as the drug must remain bound to a carrier until it is located near the target, and the drug must maintain its functionality upon release. In contrast, relatively simple polymers are needed for an emerging application that we call “drug capture”. These polymers lie at the heart of a new class of biomedical devices aimed at increasing the efficacy of chemotherapy-based cancer treatment. We propose that the device, which we refer to as ChemoFilter, will be used in conjunction with transarterial chemoembolization (TACE), a clinical standard treatment for hepatocellular carcinoma,23−26 shown in Scheme 1. In this therapy, the drug is introduced at the artery feeding the tumor in the liver, and the ChemoFilter membrane is placed at the draining vein of the tumor. In a version of the device reported in ref (23), the membrane was attached to a Nitinol frame that was initially compressed, pushed into position using a catheter, and expanded when it was in the position of interest. When this device is deployed in the human body, this step will be performed just before chemotherapy is started. As blood flows over the membrane, excess drug that is not absorbed by the tumor (and other surrounding tissue) is captured as it diffuses into the membrane. We anticipate leaving the device in the body while chemotherapy is administered (for 0.5–3 h) and then it will be contracted and retracted using the catheter. The ideal polymer would capture all the drug that passes the liver before it enters systemic circulation. This minimally invasive therapy will decrease the systemic toxicities of chemotherapy agents.
Scheme 1. Schematic of the ChemoFilter Device That Incorporates a Block Copolymer Membrane That Captures Target Drugs In Situ.
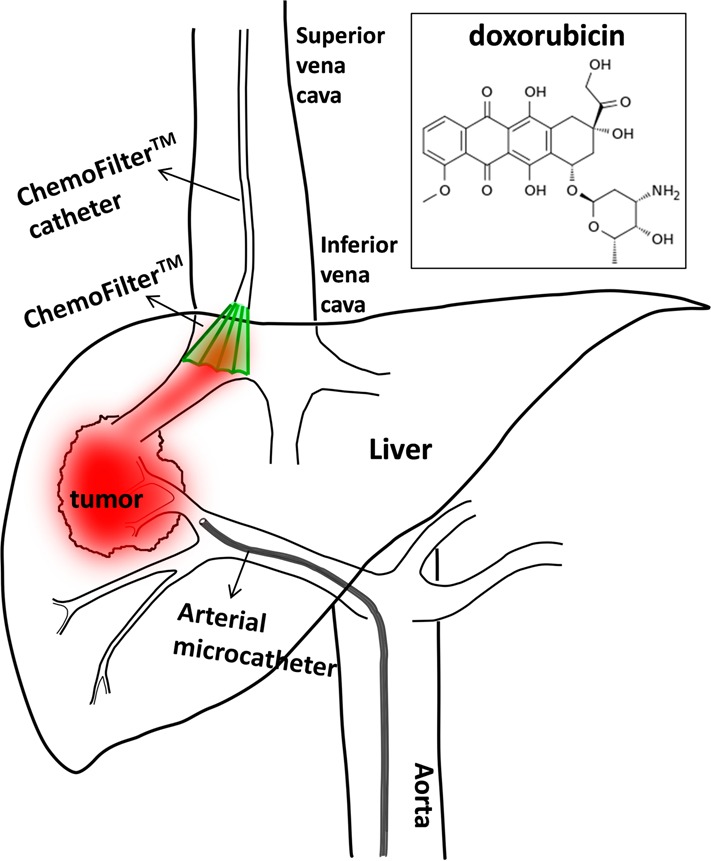
The drug (doxorubicin) is administered through the arterial microcatheter. The ChemoFilter device is put in place by maneuvering the ChemoFilter catheter using minimallly invasive surgery. The ChemoFilter is removed after use. Inset, molecular structure of doxorubicin.
In a recent report, we conducted an in vivo study in a pig model and showed that a polystyrenesulfonate-block-polyethylene-block-polystyrenesulfonate (S-SES) triblock copolymer membrane served as a promising candidate for doxorubicin removal from the bloodstream.23 Doxorubicin is a drug currently used to treat hepatocellular carcinoma, and current treatments suffer limitations due to deleterious interactions between the unused drug molecules and human tissue.27,28 The molecular structure of doxorubicin is shown in the inset of Scheme 1. The hydrophilic polystyrenesulfonate microphase is responsible for doxorubicin capture, while the polyethylene microphase provides the membrane with mechanical integrity necessary for operation. In this work, we focus on the relationship between morphology of the S-SES membranes and efficacy of doxorubicin capture measured in vitro. We show that rapid doxorubicin capture is associated with the presence of water-rich channels in the lamella-forming S-SES membranes in an aqueous environment.
We fabricated three S-SES membranes to systematically examine their doxorubicin binding capabilities. The membrane fabrication process follows a procedure reported in ref (29). Briefly, we fabricated a membrane comprising a mixture of homopolymer polystyrene (hPS) and a polystyrene-b-polyethylene-b-polystyrene (SES) triblock copolymer. We define ϕv as the volume fraction of hPS in the hPS/SES blend membrane. Homopolymer PS was then selectively removed from the blend membrane. The membrane was finally sulfonated to give an S-SES block copolymer electrolyte membrane with hydrophilic polystyrenesulfonate (PSS) domains containing negatively charged SO3– groups and H+ as the counterion.
We refer to the three S-SES membranes used in this work S-SESA, S-SESB, and S-SESC, respectively, as shown in Table 1. Chemically, S-SESA, S-SESB, and S-SESC differ only slightly in sulfonation level (SL), ranging from 46.5% to 57.2%. SL is defined as the mole fraction of sulfonated styrene monomers over the total styrene (sulfonated + unsulfonated) monomers. Difference in SL leads to slightly different ion exchange capacity (IEC) values of the S-SES membranes. IEC is defined as the milliequivalents of SO3– groups per dry gram of membrane (mmol g–1).
Table 1. Membranes Used in This Work.
| sample code | ϕv | IECa (mmol g–1) | SLb (%) | WUc (%) |
|---|---|---|---|---|
| S-SESA | 0 | 1.16 ± 0.02 | 46.5 ± 0.8 | 52.4 ± 3.6 |
| S-SESB | 0.2 | 1.40 ± 0.04 | 57.2 ± 1.9 | 109.2 ± 7.5 |
| S-SESC | 0.4 | 1.40 ± 0.01 | 57.1 ± 0.1 | 154.0 ± 6.2 |
Ion exchange capacity (IEC), defined as the milliequivalents of sulfonic acid groups per dry gram of membrane (mmol g–1).
Sulfonation level (SL) is equal to the mole fraction of sulfonated styrene monomers over the total styrene (sulfonated + unsulfonated) monomers.
With increasing ϕv values, water uptake (WU) of the membranes increases (Table 1). WU is defined by eq 1,
| 1 |
where Wwet is the wet weight of the hydrated membranes equilibrated in liquid water and Wdry is the dry weight of the membranes. The reason for increased WU of the membranes with increasing ϕv values is likely 3-fold: (1) increased number of microscopic pores in the PSS phase in S-SES membranes in the dry state, (2) change in the distribution of SO3– groups in the PSS phase, (3) change in membrane morphology. We did not find any mesoscale pores (>1 nm in diameter) in dry S-SES membranes.29
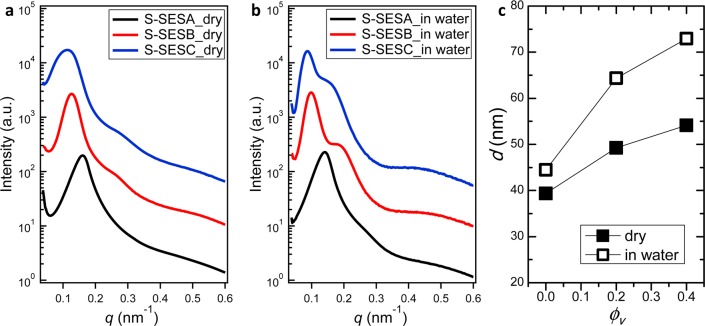
Figure 1 shows synchrotron small-angle X-ray scattering (SAXS) results of dry and hydrated S-SESA, B, and C membranes. SAXS intensity as a function of the magnitude of the scattering wave vector, q, of dry S-SESA exhibited a single broad peak at q = q*Adry = 0.160 nm–1 (Figure 1a). No higher order peaks are observed for dry S-SESA. This indicates that dry S-SESA may have a periodic structure with limited long-range order. SAXS profile of dry S-SESB membrane shows two peaks, a primary peak at q*Bdry = 0.128 nm–1 and a weak secondary peak at q = 0.265 nm–1, close to 2.1q*Bdry (Figure 1a). This indicates that dry S-SESB membrane may have a lamellar morphology. Similarly, SAXS profile of dry S-SESC membrane also shows two peaks, a broad primary peak at q*Cdry = 0.123 nm–1 and a weak secondary peak at q = 0.272 nm–1, close to 2.2q*Cdry (Figure 1a). This indicates that dry S-SESC membrane may also have a lamellar morphology.
Figure 1.
SAXS intensity as a function of the magnitude of scattering vector, q, for dry S-SES membranes (a) and hydrated S-SES membranes (b). Scattering profiles are vertically shifted for clarity. Black, red, and blue profiles in (a) and (b) represent S-SESA, S-SESB, and S-SESC, respectively. (c) Domain spacing, d, of dry and hydrated S-SES membranes as a function of ϕv.
Fully hydrated S-SES membranes were also examined by SAXS, and the results are shown in Figure 1b. SAXS profile of hydrated S-SESA membrane shows a single broad peak at q*Awet = 0.141 nm–1 (Figure 1b), similar to that of dry S-SESA. SAXS profile of hydrated S-SESB membrane shows two peaks, a primary peak at q*Bwet = 0.100 nm–1, and a strong secondary peak at q = 0.188 nm–1, close to 1.9q*Bwet. The relative intensity of the secondary peak to that of the primary peak, I(qsec)/I(q*) of hydrated S-SESB increased by over 200% compared to I(qsec)/I(q*) of dry S-SESB. SAXS profile of hydrated S-SESC membrane also shows two peaks, a primary peak at q*Cwet = 0.088 nm–1 and a strong secondary peak at q = 0.158 nm–1, close to 1.8q*Cwet. The intensity of the secondary peak is even stronger than that of hydrated S-SESB. I(qsec)/I(q*) of hydrated S-SESC is almost 8-fold larger than that of dry S-SESC. It is evident that the morphologies of the wet and dry S-SESB and S-SESC are qualitatively different.
The domain spacing of S-SES membranes, d, is given by d = 2π/q*. Based on the q* values, d of dry and hydrated S-SESA, B and C membranes are calculated and plotted as a function of ϕv, shown in Figure 1c. For dry membranes, d increased from 39.4 nm at ϕv = 0 to 54.2 nm at ϕv = 0.4. The increase in d as a function of ϕv is more dramatic in hydrated membranes than in dry membranes, from 44.5 nm at ϕv = 0 to 72.9 nm at ϕv = 0.4.
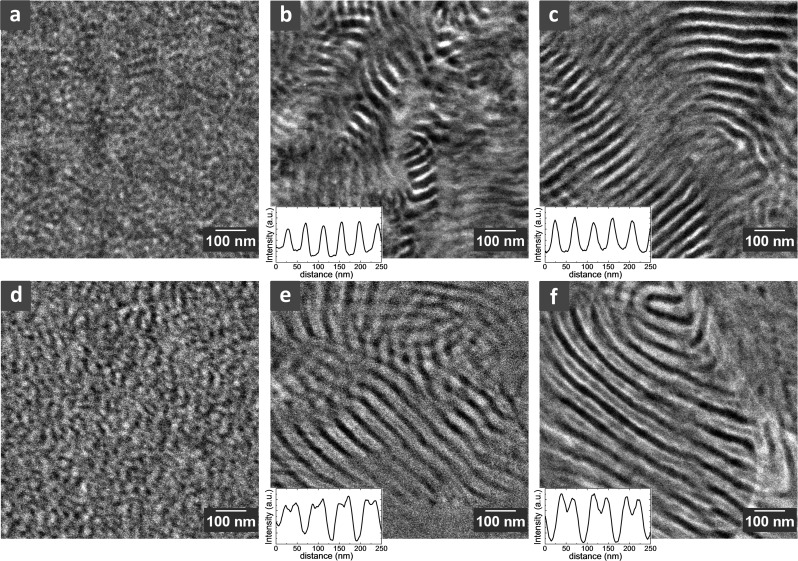
To compliment SAXS results, we examined the morphologies of S-SESA, B, and C by cryogenic scanning transmission electron microscopy (cryo-STEM) using a high angle annular dark field (HAADF) detector, and the results are shown in Figure 2. The dry membrane morphologies are shown in Figure 2a–c. The contrast of the STEM images collected on the HAADF detector reflects variations in the atomic number of the atoms in the sample (z-contrast). Note that all of the STEM samples used in this work were unstained. Therefore, the bright regions on the images represent sulfur-rich (hence, PSS-rich) regions; sulfur is the heaviest atom in our system. The dark regions on the STEM images represent PE-rich regions. Dry S-SESA shows a phase-separated morphology with poorly ordered grainy domains (Figure 2a). This is consistent with our SAXS data. Dry S-SESB and S-SESC show lamellar morphologies (Figure 2b,c), also consistent with SAXS results.
Figure 2.
Morphologies of dry and hydrated S-SES membranes by cryogenic scanning transmission electron microscopy (cryo-STEM). All the samples were unstained. (a–c) STEM images of dry S-SESA, S-SESB, and S-SESC, respectively. Typical line scan results through the alternating lamellae in S-SESB and S-SESC are shown as insets of (b) and (c), respectively. (d–f) Cryo-STEM images of hydrated S-SESA, S-SESB, and S-SESC, respectively. Typical line scans of hydrated S-SESB and S-SESC are shown as insets of (e) and (f), respectively. The large white feature on the righthand side of (f) is the lacey carbon support.
We used line scans to determine the lamellar thickness of S-SESB and S-SESC. Representative line scan profiles are shown as the insets of Figure 2b,c. Lines were drawn on the lamellae that are oriented perpendicular to the image plane. The average thickness of the PSS-rich lamellae of dry S-SESB membrane, dPSS_Bdry and that of PE-rich lamellae, dPE_Bdry, are 16.1 and 26.0 nm, respectively. The domain spacing of dry S-SESB, dBdry = dPSS_Bdry + dPE_Bdry = 42.1 nm, smaller than the value obtained from SAXS profile (49.3 nm). Such discrepancies are likely to arise due to differences in sample preparation. Based on the domain thicknesses we calculated the volume fractions of PSS and PE domains in dry S-SESB to be 0.38 and 0.62, respectively. Similarly, the average thicknesses of PSS-rich and PE-rich lamellae of dry S-SESC, dPSS_Cdry and dPE_Cdry, are 17.4 and 30.5 nm, respectively. The domain spacing of dry S-SESC, dCdry = 47.9 nm. The volume fractions of PSS and PE domains in dry S-SESC are 0.36 and 0.64, respectively. Comparing dry S-SESB and S-SESC membranes, we observed that they have similar morphologies and volume fractions of PSS-rich and PE-rich domains. S-SESC has a larger domain spacing and better long-range order. This may be due to the membrane fabrication protocol: increased amount of hPS blended with and subsequently extracted from SES may have plasticized the polymer during the membrane casting step, leading to better long-range order.
Figure 2d–f show the morphologies of hydrated S-SES membranes. Hydrated S-SESA remained a phase-separated morphology with poorly ordered grainy domains (Figure 2d). The hydrated PSS domains appear to be enlarged compared to the dry PSS domains in Figure 2a. Hydrated S-SESB and S-SESC show lamellar morphologies (Figure 2e,f). Line scans of S-SESB revealed an interesting feature: the hydrated PSS-rich lamellae are not homogeneous in intensity. The intensity of the center of the PSS-rich lamellae is lower than that of the edge but much higher than that of the PE-rich lamellae (inset of Figure 2e). Looking at the micrograph (Figure 2e), we observed that the contrast of the hydrated PSS lamellae is not homogeneous; instead, we see two bright stripes sandwiching a gray stripe in the center of the PSS lamellae. In a previous work we have thoroughly examined the origin of this feature:30 when S-SESB is equilibrated in water, a new water-rich microphase emerged in the center of the PSS microphase, which we refer to as water channels. The presence of water channels in hydrated S-SESB gave rise to the strong secondary peak in the corresponding SAXS profile (Figure 1b, red profile).30 Line scan results of hydrated S-SESB gave the thickness of PE-rich lamellae dPE_Bwet = 25.0 nm, the thickness of the water channels, dwater_Bwet = 12.4 nm, and the thickness of the PSS-rich brushes, dPSSb_Bwet = 16.3 nm. Therefore, the domain spacing of hydrated S-SESB dBwet = dPE_Bwet + dwater_Bwet + 2dPSSb_Bwet = 69.7 nm, in reasonably good agreement with SAXS results (64.4 nm).
Hydrated S-SESC presented a similar morphology to hydrated S-SESB. Clear water channels can be seen in the center of the PSS domains (Figure 2f). The contrast of water channels relative to hydrated PSS brushes is more pronounced in S-SESC than that in S-SESB (inset of Figure 2f). Correspondingly, in SAXS we observed higher secondary peak intensity for S-SESC. This is due to increased lamellar domain spacing, increased long-rang ordering as well as increased water uptake in S-SESC. Line scan results of hydrated S-SESC show that the thickness of PE-rich lamellae, dPE_Cwet = 23.5 nm, the thickness of water channels, dwater_Cwet = 15.8 nm, and the thickness of PSS-rich brushes, dPSSb_Cwet = 17.9 nm. The domain spacing of hydrated S-SESC dCwet = 75.0 nm, again consistent with SAXS results (72.9 nm).
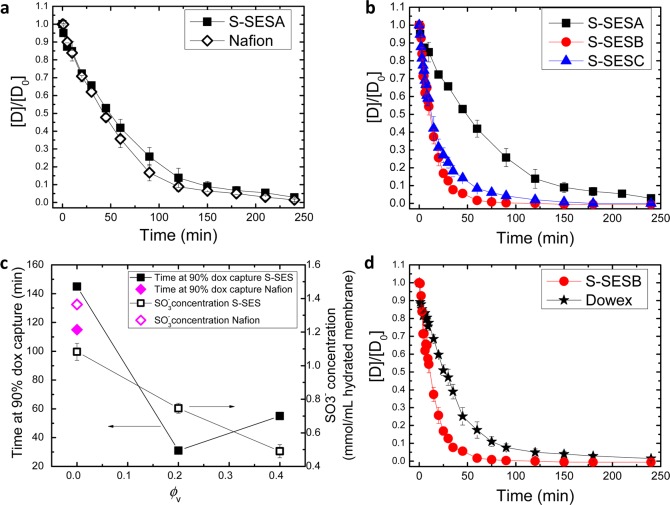
We conducted in vitro experiments to examine doxorubicin capture rate of S-SES membranes. The detailed procedure is described in the Supporting Information. The concentration of doxorubicin at a given time, [D], normalized by the initial concentration of doxorubicin, [D0] = 0.05 mg mL–1, as a function of capture time for S-SESA is shown by the solid squares in Figure 3a. To evaluate the capture kinetics of S-SESA, we also tested doxorubicin capture in a commercial membrane containing sulfonic acid groups, Nafion 117 membrane (open diamonds in Figure 3a). The membrane area was held constant in all of the experiments reported here. Nafion 117 membrane is a random copolymer comprising a tetrafluoroethylene backbone and perfluorinated sufonic acid groups on the side chains. Nafion 117 has an IEC of 0.9 mmol g–1, lower than that of S-SESA, 1.16 mmol g–1, but with a much higher hydrated thickness, 210 μm compared to the thickness of hydrated S-SESA, 65 μm. In spite of these differences, the kinetics of doxorubicin capture in S-SESA and Nafion are very similar. Capture of 50% of doxorubicin occurred at 49 and 42 min for S-SESA and Nafion, respectively. Capture of 90% of doxorubicin occurred at 145 and 115 min for S-SESA and Nafion, respectively.
Figure 3.
(a, b) Concentration of doxorubicin at a given time, [D], normalized by the initial concentration of doxorubicin, [D0] = 0.05 mg mL–1, as a function of capture time. Open diamonds in (a) represent Nafion. Solid squares in (a) and (b) represent S-SESA. Red circles and blue triangles in (b) represent S-SESB and S-SESC, respectively. (c) Time at 90% doxorubicin capture (solid data points) and SO3– concentration (open data points) as a function of ϕv. Squares represent S-SES membranes. Diamonds represent Nafion. (d) [D]/[D0] as a function of capture time for S-SESB (circles) and Dowex ion-exchange resin (stars).
Drug capture rates of S-SESB and C membranes are compared with S-SESA in Figure 3b. It is evident that capture of doxorubicin by S-SESB and S-SESC was substantially faster than S-SESA. A total of 50% of doxorubicin capture occurred at 12 min in both S-SESB and S-SESC, and 90% of doxorubicin capture occurred at 31 and 55 min in S-SESB and S-SESC, respectively, compared to 145 min in S-SESA (Figure 3c, solid squares). Note that S-SESA, B, and C membranes have the same chemical composition (with slightly different sulfonation levels). By tuning the morphology of the block copolymer electrolytes, we obtained almost 5-fold increase in doxorubicin capture rate (assuming a target of 90% capture).
The concentration of SO3– groups in hydrated S-SESA and Nafion was 1.08 and 1.36 mmol per mL of hydrated membrane, respectively (Figure 3c). The similar capture kinetics of S-SESA and Nafion, albeit their differences in chemical composition, thickness and concentration of SO3–, indicates that capture kinetics of dense membranes like S-SESA and Nafion is surface-limited. The SO3– concentrations in S-SESB and S-SESC are 0.75 and 0.49 mmol per mL of hydrated membrane, respectively. The SO3– concentration in S-SES membranes decreases with increasing ϕv (Figure 3c, open squares), which is a direct result of increased water uptake with increasing ϕv. Despite the lower SO3– concentration, S-SESB exhibited dramatically faster doxorubicin capture rate, relative to S-SESA (Figure 3c, solid squares). The difference between S-SESA and S-SESB is in their morphologies: hydrated S-SESA has poorly ordered grainy domains with no evidence for a separate phase of water channels, whereas S-SESB has relatively well-ordered lamellar domains with a separate phase of water channels in the center of the PSS domains. The thickness of the water channels is 12.4 nm, much larger than the molecular dimension of doxorubicin (0.8 × 1.5 nm). This may facilitate diffusion of doxorubicin molecules into the interior of the membrane. S-SESC has a similar morphology to S-SESB, but 90% doxorubicin capture time is 1.8× that of S-SESB. This suggests that SO3– concentration also affects drug capture rate; SO3– concentration in the hydrated S-SESB membrane is 1.5× that in hydrated S-SESC.
In Figure 3d, we compare S-SESB with Dowex ion-exchange resin (Dowex 50 × 2, 50–100 mesh), which is cross-linked polystyrene beads with SO3– groups on the surface. This resin was used in our previous study.23 For this comparison we used the same weight (0.14 g) of S-SESB and Dowex. A 90% doxorubicin capture occurred at 80 min for Dowex. Block copolymer electrolyte membrane S-SESB outperformed Dowex remarkably.
In conclusion, we fabricated a systematic series of block copolymer electrolyte membranes, S-SESA, S-SESB, and S-SESC, to study the relationship between membrane morphology and drug capture rate. These membranes have the same nominal chemical composition. We found that doxorubicin capture rates for S-SESB and S-SESC are substantially faster than that of S-SESA. The morphological underpinnings of this observation were revealed by SAXS and cryogenic STEM experiments. S-SESA presented ill-defined grainy microphases, whereas S-SESB and S-SESC presented well-defined lamellar microphases. We also noted the presence of water-rich channels with thicknesses of 12–15 nm in hydrated S-SESB and S-SESC membranes. The time required to remove 90% of the drug in the optimal membrane, S-SESB, is 31 min. This is comparable to the time required for a chemotherapeutic drug to leach out of the liver if it is given with embolic beads. Of course, more work is needed to design efficacious membranes for the ChemoFilter device. Interactions between the membrane and components of the blood (blood cells, proteins, etc.) need to be examined carefully before the optimal composition of the membrane is arrived at. Our work is but one step toward the design of membranes for efficient capture of chemotherapeutic drugs in the ChemoFilter device.
Acknowledgments
Primary funding for the work was provided by the Electron Microscopy of Soft Matter Program from the Office of Basic Energy Sciences of the U.S. Department of Energy under Contract No. DE-AC02-05CH11231. The work of J.F.Y., J.K.Y., A.S.P., and S.W.H. on the in vitro experiments was supported by National Institutes of Health (NIH) under Grant Nos. 1R01CA194533 and 1R41CA183327. SAXS experiments were performed at the Advanced Light Source (ALS) and Stanford Synchrotron Radiation Lightsource (SSRL). The STEM experiments were performed as user projects at the National Center for Electron Microscopy, Molecular Foundry.
Supporting Information Available
The Supporting Information is available free of charge on the ACS Publications website at DOI: 10.1021/acsmacrolett.6b00459.
Experimental details of this work (PDF).
The authors declare no competing financial interest.
Supplementary Material
References
- Park C. H.; Lee C. H.; Guiver M. D.; Lee Y. M. Prog. Polym. Sci. 2011, 36, 1443–1498. 10.1016/j.progpolymsci.2011.06.001. [DOI] [Google Scholar]
- Elabd Y. A.; Hickner M. A. Macromolecules 2011, 44, 1–11. 10.1021/ma101247c. [DOI] [Google Scholar]
- Hickner M. A.; Herring A. M.; Coughlin E. B. J. Polym. Sci., Part B: Polym. Phys. 2013, 51, 1727–1735. 10.1002/polb.23395. [DOI] [Google Scholar]
- Bouchet R.; Maria S.; Meziane R.; Aboulaich A.; Lienafa L.; Bonnet J.-P.; Phan T. N. T.; Bertin D.; Gigmes D.; Devaux D.; Denoyel R.; Armand M. Nat. Mater. 2013, 12, 452–457. 10.1038/nmat3602. [DOI] [PubMed] [Google Scholar]
- Inceoglu S.; Rojas A. A.; Devaux D.; Chen X. C.; Stone G. M.; Balsara N. P. ACS Macro Lett. 2014, 3, 510–514. 10.1021/mz5001948. [DOI] [PubMed] [Google Scholar]
- Villaluenga I.; Wujcik K. H.; Tong W.; Devaux D.; Wong D. H. C.; DeSimone J. M.; Balsara N. P. Proc. Natl. Acad. Sci. U. S. A. 2016, 113, 52–57. 10.1073/pnas.1520394112. [DOI] [PMC free article] [PubMed] [Google Scholar]
- Geise G. M.; Park H. B.; Sagle A. C.; Freeman B. D.; McGrath J. E. J. Membr. Sci. 2011, 369, 130–138. 10.1016/j.memsci.2010.11.054. [DOI] [Google Scholar]
- Lee K. P.; Arnot T. C.; Mattia D. J. Membr. Sci. 2011, 370, 1–22. 10.1016/j.memsci.2010.12.036. [DOI] [Google Scholar]
- Park H. B.; Freeman B. D.; Zhang Z.-B.; Sankir M.; McGrath J. E. Angew. Chem., Int. Ed. 2008, 47, 6019–6024. 10.1002/anie.200800454. [DOI] [PubMed] [Google Scholar]
- Anand V.; Kandarapu R.; Garg S. Drug Discovery Today 2001, 6, 905–914. 10.1016/S1359-6446(01)01922-5. [DOI] [PubMed] [Google Scholar]
- Bae Y.; Fukushima S.; Harada A.; Kataoka K. Angew. Chem., Int. Ed. 2003, 42, 4640–4643. 10.1002/anie.200250653. [DOI] [PubMed] [Google Scholar]
- Soppimath K. S.; Aminabhavi T. M.; Kulkarni A. R.; Rudzinski W. E. J. Controlled Release 2001, 70, 1–20. 10.1016/S0168-3659(00)00339-4. [DOI] [PubMed] [Google Scholar]
- Jeong B.; Bae Y. H.; Lee D. S.; Kim S. W. Nature 1997, 388, 860–862. 10.1038/42218. [DOI] [PubMed] [Google Scholar]
- Shi J.; Votruba A. R.; Farokhzad O. C.; Langer R. Nano Lett. 2010, 10, 3223–3230. 10.1021/nl102184c. [DOI] [PMC free article] [PubMed] [Google Scholar]
- Åkerman S.; Åkerman K.; Karppi J.; Koivu P.; Sundell A.; Paronen P.; Järvinen K. Eur. J. Pharm. Sci. 1999, 9, 137–143. 10.1016/S0928-0987(99)00055-X. [DOI] [PubMed] [Google Scholar]
- Dong L.; Hoffman A. S. J. Controlled Release 1991, 15, 141–152. 10.1016/0168-3659(91)90072-L. [DOI] [Google Scholar]
- Hosseinkhani H.; Hosseinkhani M.; Khademhosseini A.; Kobayashi H.; Tabata Y. Biomaterials 2006, 27, 5836–5844. 10.1016/j.biomaterials.2006.08.003. [DOI] [PubMed] [Google Scholar]
- Nasongkla N.; Bey E.; Ren J.; Ai H.; Khemtong C.; Guthi J. S.; Chin S.-F.; Sherry A. D.; Boothman D. A.; Gao J. Nano Lett. 2006, 6, 2427–2430. 10.1021/nl061412u. [DOI] [PubMed] [Google Scholar]
- Dube N.; Shu J. Y.; Dong H.; Seo J. W.; Ingham E.; Kheirolomoom A.; Chen P.-Y.; Forsayeth J.; Bankiewicz K.; Ferrara K. W.; Xu T. Biomacromolecules 2013, 14, 3697–3705. 10.1021/bm4010518. [DOI] [PMC free article] [PubMed] [Google Scholar]
- Barth R. F.; Adams D. M.; Soloway A. H.; Alam F.; Darby M. V. Bioconjugate Chem. 1994, 5, 58–66. 10.1021/bc00025a008. [DOI] [PubMed] [Google Scholar]
- Gillies E. R.; Fréchet J. M. J. Drug Discovery Today 2005, 10, 35–43. 10.1016/S1359-6446(04)03276-3. [DOI] [PubMed] [Google Scholar]
- Hoare T.; Santamaria J.; Goya G. F.; Irusta S.; Lin D.; Lau S.; Padera R.; Langer R.; Kohane D. S. Nano Lett. 2009, 9, 3651–3657. 10.1021/nl9018935. [DOI] [PMC free article] [PubMed] [Google Scholar]
- Patel A. S.; Saeed M.; Yee E. J.; Yang J. K.; Lam G.; Losey A. D.; Lillaney P.; Thorne B.; Chin A.; Malik S.; Wilson M.; Chen X. C.; Balsara N. P.; Hetts S. Journal of Medical Devices 2014, 8, 041008. 10.1115/1.4027444. [DOI] [PMC free article] [PubMed] [Google Scholar]
- Chen X. C.; Yang J. K.; Chin A.; Patel A. S.; Hetts S. W.; Balsara N. P. U.S. Patent Application Serial No. 14/880,925, Regents of the University of California, 2014.
- Vogl T. J.; Naguib N. N. N.; Nour-Eldin N.-E. A.; Rao P.; Emami A. H.; Zangos S.; Nabil M.; Abdelkader A. Eur. J. Radiol. 2009, 72, 505–516. 10.1016/j.ejrad.2008.08.007. [DOI] [PubMed] [Google Scholar]
- Roche A.; Girish B. V.; de Baère T.; Baudin E.; Boige V.; Elias D.; Lasser P.; Schlumberger M.; Ducreux M. Eur. J. Radiol. 2003, 13, 136–140. [DOI] [PubMed] [Google Scholar]
- Buijs M.; Vossen J. A.; Frangakis C.; Hong K.; Georgiades C. S.; Chen Y.; Liapi E.; Geschwind J.-F. H. Radiology 2008, 249, 346–354. 10.1148/radiol.2483071902. [DOI] [PMC free article] [PubMed] [Google Scholar]
- Von Hoff D. D.; Layard M. W.; Basa P.; Davis J. H. L.; Von Hoff A. L.; Rozencweig M.; Muggia F. M. Ann. Intern. Med. 1979, 91, 710–717. 10.7326/0003-4819-91-5-710. [DOI] [PubMed] [Google Scholar]
- Chen X. C.; Kortright J. B.; Balsara N. P. Macromolecules 2015, 48, 5648–5655. 10.1021/acs.macromol.5b00950. [DOI] [Google Scholar]
- Chen X. C.; Wong D. T.; Yakovlev S.; Beers K. M.; Downing K. H.; Balsara N. P. Nano Lett. 2014, 14, 4058–4064. 10.1021/nl501537p. [DOI] [PMC free article] [PubMed] [Google Scholar]
Associated Data
This section collects any data citations, data availability statements, or supplementary materials included in this article.


