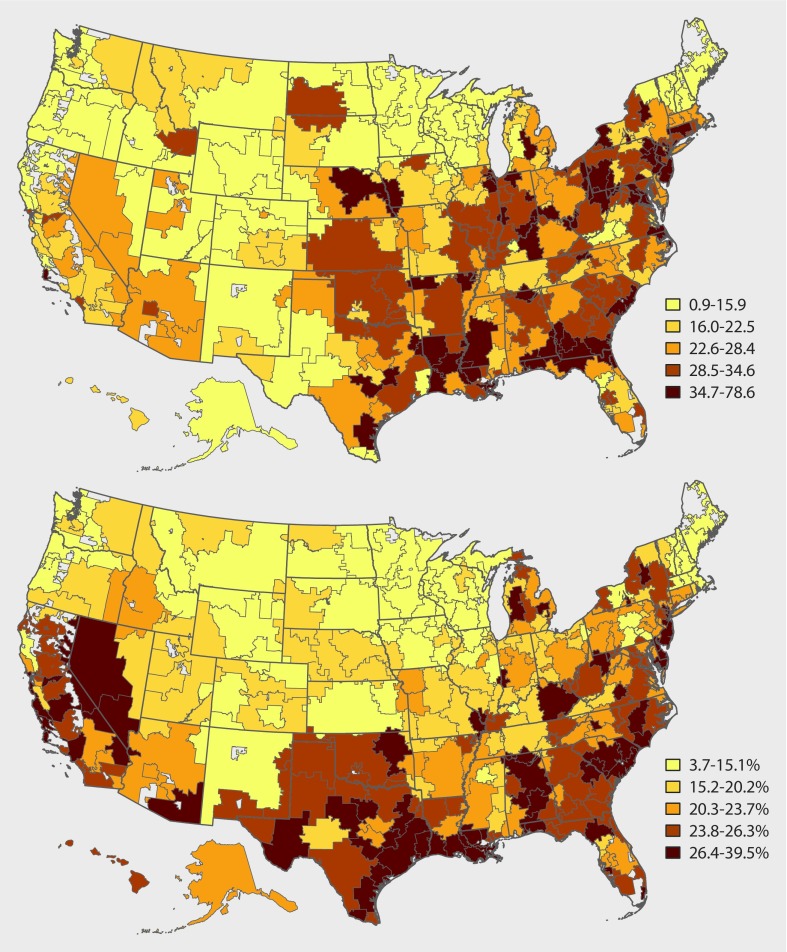
Fig 1 Distribution of payments by pharmaceutical manufacturers to physicians, and physician prescribing of marketed drugs among Medicare Part D beneficiaries for oral anticoagulants, by hospital referral region. Payments per 1000 person years of Part D coverage for oral anticoagulants (top panel); market share (%) of marketed oral anticoagulants (bottom panel)

An official website of the United States government
Here's how you know
Official websites use .gov
A
.gov website belongs to an official
government organization in the United States.
Secure .gov websites use HTTPS
A lock (
) or https:// means you've safely
connected to the .gov website. Share sensitive
information only on official, secure websites.
