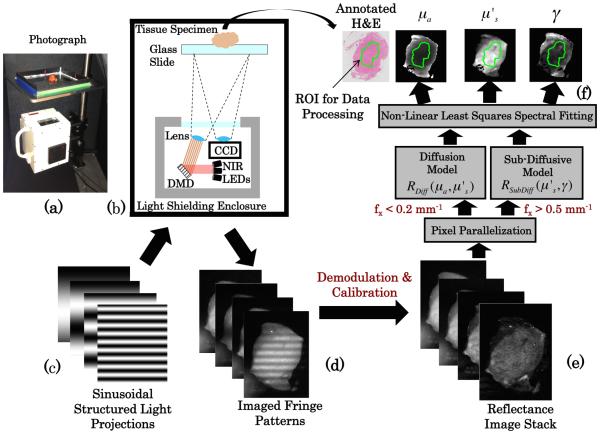
Fig. 2.
(a) Photograph of sub-diffusive spatial frequency domain imaging system and (b) diagram of major system components. Sinusoidal intensity patterns (c) are sent to the digital micromirror device and projected on the tissue, with the remitted fringe pattern imaged (d). The stack of fringe patterns over multiple spatial frequencies and wavelengths were demodulated and calibrated to a reference standard yielding a reflectance map stack (e), which was then used to calculate optical property maps (f ).

