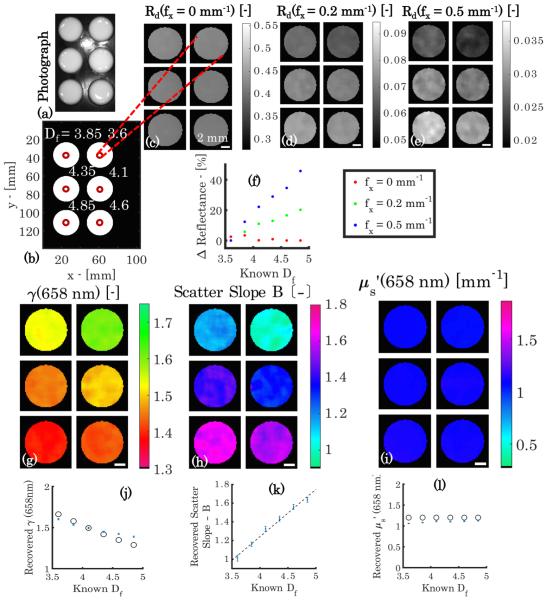
Fig. 3.
Phantoms with held constant with γ variation. (a) Photograph, (b) annotated Df , and (c)–(e) demodulated reflectance images at λ = 658 nm and f x = [0; 0.2; 0.5] mm . (f ) Normalized plot of percentage change in reflectance versus Df for each spatial frequency. Recovered maps of γ(658 nm), scatter slope B, and (658 nm) are shown in (g), (h), and (i), respectively. Below are plots of recovered optical property values versus Df in (j), (k), and (l), where the blue error bars represent recovered mean values ± one standard deviation, the black circles represent the Mie theory-predicted γ(658 nm) and (658 nm) values, and the black dotted line represents a regression of scatter slope B versus Df (r = 0.993). Scale bar is 2 mm.

