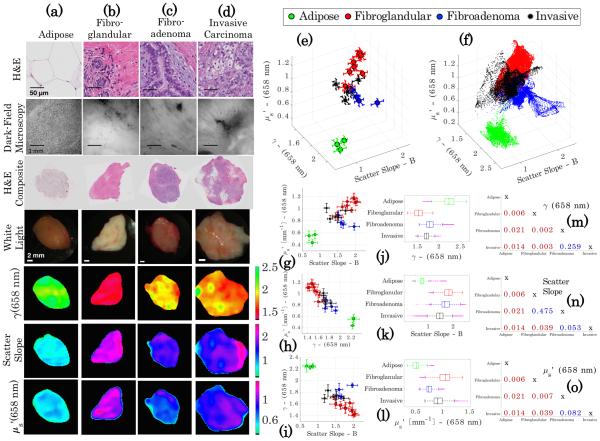
Fig. 5.
Clustering of optical scatter parameters of homogeneous breast tissue of known diagnoses of (a) adipose, (b) fibroglandular, (c) benign fibroadenoma, and (d) invasive carcinoma. The first row of images shows high-magnification H&E stained histology slides of a representative area of each tissue type, and below is a corresponding representative dark-field microscopy image in the second row. In the third row, a scanned co-registered composite histology slide appears with a white-light photograph (below in the following row). The final three rows contain the three optical scatter parameter maps, γ [−], scatter slope B [−], and [mm−1]. Three-dimensional clustering plots are shown for the means ± one standard deviation and for all pixels for each specimen in (e) and (f ). (g)–(i) Show two-dimensional clustering of the specimen means ± one standard deviation for each pair of optical scatter parameters. (j)–(l) Show box and whisker plots for all points used in the cluster analysis for each scatter parameter. (m)–(o) Show two-sample Kolmogorov–Smirnov p-values for each pairwise combination of tissue diagnoses with each scatter parameter as the tested distribution.

