Abstract
Purpose: The outlines of primary lung cancers are more complicated than those of metastatic lung tumors on computed tomography (CT) images. This feature is useful for clarifying the diagnosis of pulmonary nodules before surgery. We applied fast Fourier transform (FFT) analysis for quantification of complexity of tumor outline.
Methods: Sequential cases of 72 primary lung cancers (Group PL) and 54 metastatic lung tumors (Group MT) were included. The outline of each tumor on chest CT images was described using polar coordinates, and converted to rectangular coordinates, yielding wave data of the tumor outline. The FFT was then used to analyze the wave data. The complexity index (Cxi) was defined as the sum of the amplitude of all harmonics over a fundamental frequency.
Results: The Cxi was higher (P <0.0001) for group PL (10.3 ± 6.7 mm) than for group MT (3.2 ± 2.4 mm), and it was correlated with tumor diameter in both groups. The cut-off equation “Cxi = 0.127 DT + 2.23” provided the highest diagnostic accuracy for distinguishing Group PL from Group MT such as a sensitivity of 95.8%, a specificity of 81.5%, and an accuracy of 89.7%.
Conclusion: FFT analysis appears useful for quantification of complexity of the tumor outline.
Keywords: fast Fourier transform, computed tomography, primary lung cancer, metastatic lung tumor, quantitative evaluation
Introduction
Primary lung cancer is still a leading cause of cancer death in the world.1,2) Major population of lung cancer detected as solitary pulmonary nodule on computed tomography (CT) image are resectable early stage diseases.3,4) There were several diseases other than lung cancer that present solitary pulmonary nodules, such as benign pulmonary tumors, old inflammation, and metastatic lung tumor.
Metastatic lung tumor is another candidate for surgical resection. Registry of the Japanese Association for Thoracic Surgery reported 32801 primary lung cancers and 6748 metastatic lung cancers were resected in 2010.5)
Standard surgical procedure is different between primary lung cancer and metastatic lung tumor. Lobectomy is applied for primary lung cancer, and partial resection for metastatic lung tumor. Differential diagnosis before surgery is important. However, histological diagnosis using bronchofiberscopy is often difficult in these small peripheral lung nodules. It appears to be useful to diagnose pulmonary nodules using chest CT.
As already known, primary lung cancer presents complicated appearance in chest CT. Contour of primary lung cancer is expressed using the words such as undulated, irregular, and speculated.6,7) Contrary, metastatic lung tumor usually shows simple round shadow. These characteristics are used for the differential diagnosis of tumors. However, we often meet tumors with borderline complexity that we are not able to clearly classify.
Chest CT finding is expressed by words at the diagnosis. Therefore, it is difficult to standardize or compare the diagnostic properties. Numerical evaluation of complexity of tumor outline results in the quantitative evaluation of tumor shape and may help the standardization of diagnosis of pulmonary nodules on chest CT.
Malignant pulmonary tumors basically show round appearance. Therefore, complexity of tumor outline is to be expressed by the deviation from a circle. And the extent of deviation can be expressed numerically. The array data set of the deviation is to be regarded as the composition of various kinds of waves. Fast Fourier transform (FFT) analysis8) is suitable to evaluate these components of the wave data.
In this study, we performed the quantitative analysis for the complexity of tumor outline of both primary lung cancer and metastatic lung tumor utilizing FFT analysis. And then we evaluated the usefulness and adequacy of our evaluation method.
Patients and Methods
Patients
Sequential cases of 72 histologically proven primary lung cancers (Group PL) and 54 metastatic lung tumors (Group MT) were included in the study. Patients in Group PL were underwent surgical resection from 2011 to 2012, and those in Group MT from 2010 to 2012 in our institute. Tumor shadow with ground glass opacity was not included in this study. Tumors that attached mediastinum, pleura, or chest wall were not also included because contour of the tumor cannot be accurately determined.
Group PL included 37 adenocarcinomas, 24 squamous cell carcinomas, six adenosquamous carcinomas, three large cell neuroendocrine carcinomas, and two other histological types. The metastases in Group MT originated from 22 colorectal cancer, eight head and neck cancer, six renal cancer, six hepatic cancer, four esophageal cancer, four breast cancer, and four from the other organs. The diameter of tumor (DT) was 18.9 ± 7.4 mm in Group PL, and 12.2 ± 6.1 mm in Group MT. Average DT was significantly larger (P <0.0001) in Group PL than in Group MT.
Fast Fourier transform analysis
Chest CT was obtained as the thin-slice CT image. The slice that provided the largest tumor diameter was used. The contour of each tumor was defined as the pixels whose density was 64 bits lower from the center of the tumor in the provided window level for the diagnosis in each patient.
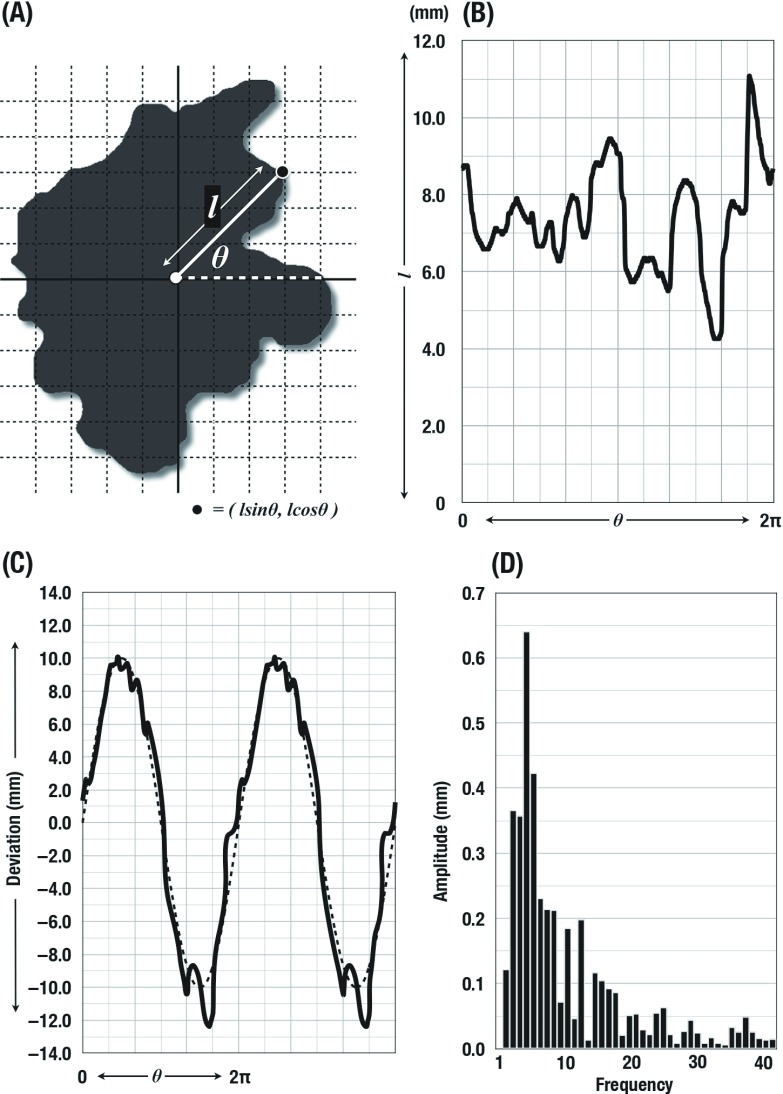
For the measurements, the contour of each tumor on chest CT images was described using polar coordinates by π/360 pitch. The data were converted to rectangular coordinates, yielding wave data of the tumor outline. The wave data were combined to the reference standard sine curve that has the identical phase and wavelength. After that continuous wave was constructed by the repetition of the single combined wave data. The yielded continuous wave data were then applied to the FFT analysis. The FFT analysis was performed using the wave analysis application (Igor Pro 6.03; WaveMetrics, Oregon, USA). Results of the FFT analysis were described as the spectrum of amplitude in each harmonics. Harmonics at the frequency of 2 to 359 times per cycle were calculated in each tumor (Fig. 1).
Fig. 1.
Fast Fourier transform (FFT) analysis for the contour of tumor. Initially the outline of each tumor on chest computed tomography images was described using polar coordinates (A). Then the data were converted to rectangular coordinates (B). The wave data were combined to the reference standard sine curve and repeated data were constructed (C). Harmonics at the frequency of 2 to 359 times per cycle were calculated in each tumor using FFT analysis. In this figure, only initial 40 harmonics were presented (D).
Validation for the impression of thoracic surgeons
The validation study was designed to reveal how the results of FFT analysis reflected the impression of thoracic surgeons. Tumor outline was presented randomly to four thoracic surgeons in our institute who were not informed which mass was primary lung cancer or metastatic lung tumor. They were forced to categorize the tumors to Group PL or MT according only on their impression. Results of the diagnosis were compared with the results of FFT analysis.
Statistical Analysis
All values were reported as means ± SD. The χ2 test and unpaired t-test were employed to evaluate significance of differences between the groups. Linear regression analysis were used the correlation of two parameters. P values less than 0.05 indicated statistical significance.
Results
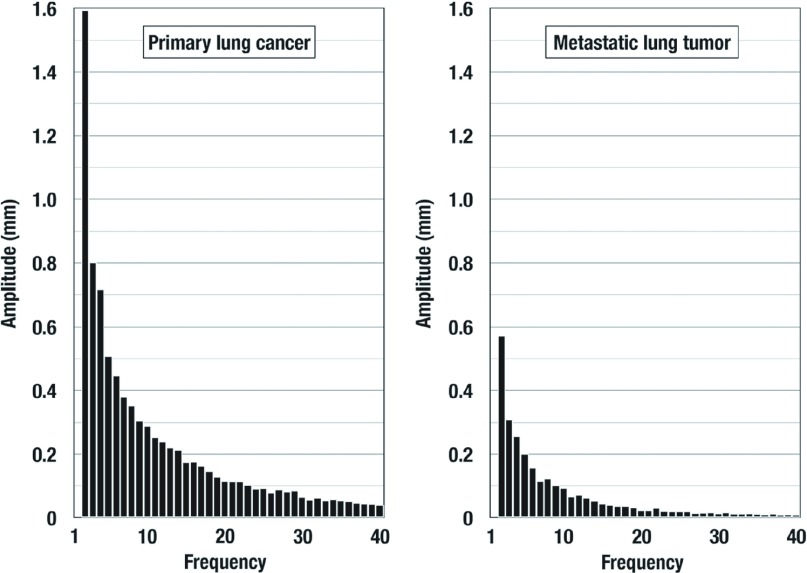
The average amplitudes of each harmonics in Groups PL and MT were illustrated in Fig. 2. The amplitude was gradually decreased in both two groups as the frequency increased. The amplitude was higher in Group PL than Group MT in all 358 harmonics (P <0.0001). There appeared to be no specific harmonics that was suitable to distinguish two groups. Then the complexity index (Cxi) that represents the complexity of tumor outline was defined as the sum of the amplitude of all harmonics. The Cxi was significantly (P <0.0001) higher for group PL (10.3 ± 6.7 mm) than for group MT (3.2 ± 2.4 mm). The Cxi was significantly correlated with DT in both groups: PL (r = 0.667, P <0.0001) and MT (r = 0.809, P <0.0001). The regression coefficient was significantly (P <0.0001) higher for group PL (0.608) than for group MT (0.317). The complexity of the tumor outline increased with increased tumor size more steeply in Group PL than in Group MT.
Fig. 2.
The average amplitudes of each harmonics in Groups primary lung cancer (PL) and metastatic lung tumor (MT). The amplitude was gradually decreased in both two groups as the frequency increased. In this figure, only initial 40 harmonics were presented in each group. The amplitude was higher in Group PL than Group MT in all 358 harmonics (P <0.0001).
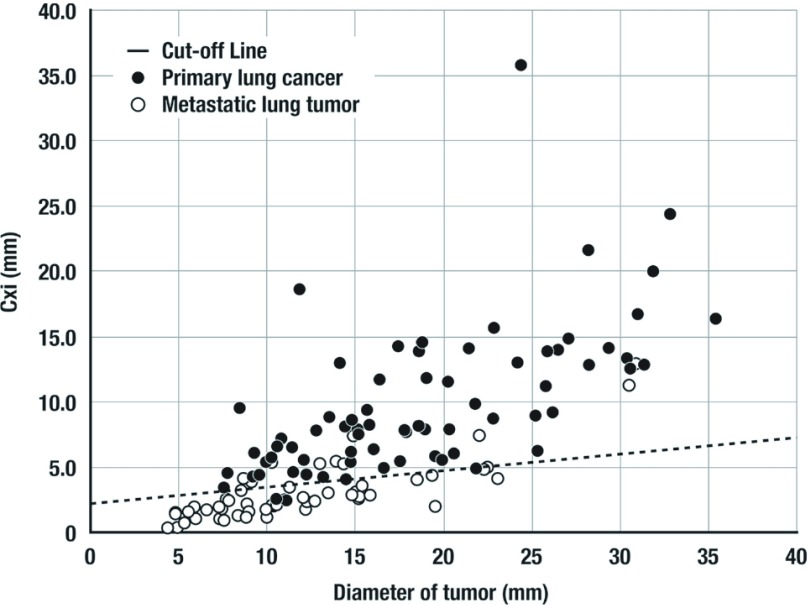
Because Cxi was correlated with DT in both of the groups, not a cut-off value but a cut-off line for Cxi should be determined relative to DT. Therefore, receiver operating characteristic (ROC) analysis for distinguishing primary lung cancers from metastatic lung tumors was performed adopting individual cut-off line that provided the highest sensitivity in each point of specificity. AUC of this ROC curve was 0.937 (P <0.0001). Cut-off line that yielded the highest accuracy was described as “Cut-off of Cxi = 0.127 DT + 2.23” (Fig. 3). There were 69 tumors above and 3 patients below cut-off line in Group PL. There were 44 tumors below and 10 tumors above cut-off line in Group MT. Then this cut-off line provided a sensitivity of 95.8%, a specificity of 81.5%, and an accuracy of 89.7%. Ten tumors with Cxi above cut-off line in Group MT were consisted of 8 colorectal cancers, 1 breast cancer, and 1 pancreatic cancer. In Group MT, population above cut-off line was significantly (P = 0.010) larger in colorectal cancer than the other tumors form the other organs.
Fig. 3.
Cut-off line for distinguishing primary lung cancers from metastatic lung tumors. The equation “Cutoff of Cxi = 0.127 DT + 2.23” provided a sensitivity of 95.8%, a specificity of 81.5%, and an accuracy of 89.7%.
Diagnostic properties of the validation study in our thoracic surgeons were summarized in Table 1. The average of sensitivity, specificity, and accuracy were 97.7%, 57.9%, and 80.8%, respectively. Average sensitivity was higher and specificity was lower than those of the FFT analysis. Our thoracic surgeons appeared to be afraid to misjudge primary lung cancer.
Table 1.
Diagnostic properties
| Doctors | Sensitivity (%) | Specificity (%) | Accuracy (%) |
|---|---|---|---|
| A | 94.6 | 75.9 | 86.5 |
| B | 98.7 | 75.9 | 88.9 |
| C | 98.7 | 31.5 | 69.9 |
| D | 100.0 | 48.2 | 77.8 |
| Average | 97.7 | 57.9 | 80.8 |
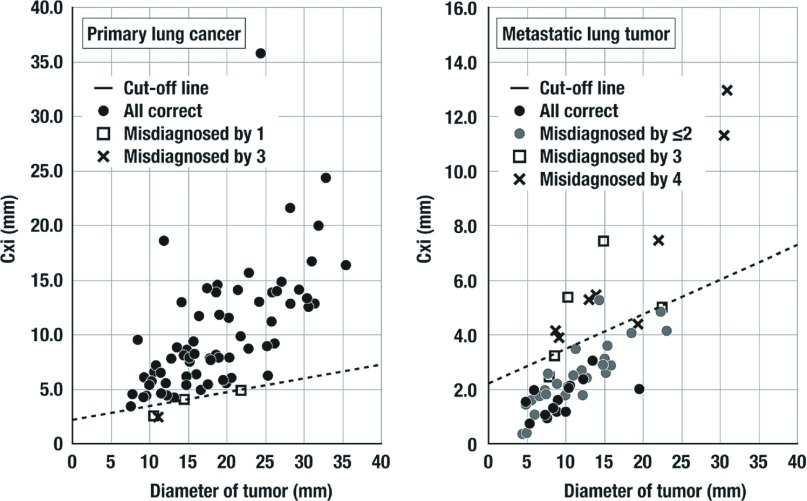
Figure 4 shows the correlation of thoracic surgeon’s impression and the results of FFT analysis. In Group PL, four tumors were classified as Group MT at least one thoracic surgeons. Three of them were under the cut-off line, and one was just above and nearby the cut-off line. Specificity for metastatic lung tumor was surprisingly low. Only 14 tumors were correctly classified into Group MT by all doctors. Seventeen tumors were misdiagnosed by one or two surgeons, and four ones by three surgeons and seven ones by all surgeons.
Fig. 4.
The correlation of thoracic surgeon’s impression and the results of fast Fourier transform (FFT) analysis. This cut-off line appeared to represent the thoracic surgeons impressions in our institute. Specificity was lower in thoracic surgeons than Cxi.
All of 10 metastatic tumors above cut-off line were misdiagnosed by at least three thoracic surgeons. Among them, seven ones were misdiagnosed by the all surgeons, and the other by three surgeons. This cut-off line appeared to represent the thoracic surgeons impressions in our institute.
Discussion
Fourier tansform (FT) is a kind of mathematical procedure that transforms a mathematical function into another function. Using this process, mathematical functions are transformed into the function of frequency spectrum. So FT is called as frequency domain representation.9) Discrete Fourier transform (DFT) is an application of FT to the discrete numbers. FFT is an algorithm for the DFT on the computer system.8,9) It is widely used in the digital signal processing. For example, CT image itself is a result of FFT analysis.
In this study, we hypothesized that complexity of tumor outline can be evaluated by two elements. One is the how high it undulates, and another is how frequent it does. When the contour of tumor was regarded as a wave, these two factors correspond to the amplitude and the frequency of waveform. Standing on a basis that the primitive shape of tumor is a circle, contour of tumor is expressed mathematically as the composition of a circle and multiple waveforms that have various amplitudes and frequencies. FFT analysis enables us to know the amplitude of the waves in each frequency. In this study, we described the shape of tumor using polar coordinates, and then it was converted to rectangular coordinates. This process enabled us to apply FFT analysis for the contour of tumor.
Wavelength was in direct proportion to tumor diameter because we determined that 2p is one cycle in each tumor. Larger tumor have longer outline, and it results in the relatively higher resolution image about the shape of the tumor. Therefore, Cxi was dependent on the diameter of tumor. It is easily acceptable that the complexity of tumor becomes higher as the diameter of tumor becomes larger. Cxi appeared to be suitable to represent our impression of complexity of the tumor contour.
It is widely known that primary lung cancer shows more complicated appearance than metastatic lung tumor in chest CT image.6,7,10) They are often described as the words spiculated mass. Pathologically, spiculation is related to desmoplastic reaction.11) Spiculation may also be the result of infiltration of interstitial planes and lymphatics by tumor. On the other hand, metastatic lung tumor is thought to be less invasive to surrounding lung tissues. These characteristics appear to be expressed as the complexity of tumor contour. However, there has been no quantitative evaluation method for the complexity of pulmonary nodules. Spiculation is often observed as a small and fine undulation, and its frequencies look high. Therefore, we speculated that there were specific frequencies suitable to distinguish primary lung cancer and metastatic lung tumor. Against our expectation, Amplitude was higher in all harmonics in primary lung cancer than metastatic lung tumor. So the complexity index (Cxi) that represents the complexity of tumor outline was defined as the sum of the amplitude of all harmonics.
Diagnostic properties of Cxi were excellent. It appears useful to distinguish primary lung cancer and metastatic lung tumor. ROC analysis revealed that accuracy of Cxi was 89.7%. Sensitivity was higher in thoracic surgeons than cut-off line, but specificity was strikingly lower in thoracic surgeons than cut-off line. Our thoracic surgeons seemed to be afraid of misdiagnosing primary lung cancer. Surgery for the metastatic lung cancer is usually less invasive than primary lung cancer. They might intentionally avoid converting surgical procedures into more invasive methods. The impression of each investigator is difficult to compare, evaluate, or standardize. To improve diagnostic accuracies, it seems good to introduce quantitative evaluation of impression of the image.
Average accuracy of our thoracic surgeons was 80.7%, and inferior to that of Cxi. This was the result of the restricted situation. However, chest CT image usually provides us more information than size and contour of tumor, such as the location and internal density distribution. We suppose that diagnostic properties using actual CT image is higher than those in this study.
There were 10 tumors with Cxi above cut-off line in Group MT. Eight of them were colorectal cancers. Our result suggests that colorectal cancer has the tendency to show more complicated outline than tumor from the other organs.
We are aware that differential diagnosis of malignant tumor and benign lung nodules is more important than distinguishing primary lung cancer and metastatic lung tumor. Most of benign pulmonary tumor was hamartoma.12) It appears simple round or polygonal shape with clear sharp margin. It resembles metastatic lung tumor. Benign inflammatory lesions show various appearances. They are sometimes small round and sometimes irregular. Our analytical method is based on the hypothesis that malignant tumors are essentially round. Therefore, Cxi is not suitable to the benign inflammatory lesions that are not essentially round.
Similarly, tumors attached to the mediastinum, pleura, or chest wall were not round. Therefore, such tumors were excluded in this study. Our quantitative analytical method does not seem to have sufficient ability for these features. Additional analytical approach should be employed.
In conclusion, complexity of outline of the pulmonary nodules can be evaluated quantitatively using FFT analysis. This analytical procedure was designed from the beginning as it can be equipped on the graphic workstation, and we are now starting to develop it. This analytical method will help the diagnosis of primary lung cancer.
Disclosure Statement
The authors report to Annals of Thoracic and Cardio-vascular Surgery that no potential conflicts of interest exist with any companies/organizations whose products or services may be discussed in this article.
References
- 1).Siegel R, Naishadham D, Jemal A. Cancer statistics, 2012. CA Cancer J Clin 2012; 62: 10-29. [DOI] [PubMed] [Google Scholar]
- 2).Ferlay J, Shin HR, Bray F, et al. Estimates of worldwide burden of cancer in 2008: GLOBOCAN 2008. Int J Cancer 2010; 127: 2893-917. [DOI] [PubMed] [Google Scholar]
- 3).National Lung Screening Trial Research Team. Aberle DR, Adams AM, et al. Reduced lung-cancer mortality with low-dose computed tomographic screening. N Engl J Med 2011; 365: 395-409. [DOI] [PMC free article] [PubMed] [Google Scholar]
- 4).Sawabata N, Miyaoka E, Asamura H, et al. Japanese lung cancer registry study of 11,663 surgical cases in 2004: demographic and prognosis changes over decade. J Thorac Oncol 2011; 6: 1229-35. [DOI] [PubMed] [Google Scholar]
- 5).Kuwano H, Amano J, Yokomise H. Thoracic and cardiovascular surgery in Japan during 2010: annual report by The Japanese Association for Thoracic Surgery. Gen Thorac Cardiovasc Surg 2012; 60: 680-708. [DOI] [PubMed] [Google Scholar]
- 6).Swensen SJ, Silverstein MD, Edell ES, et al. Solitary pulmonary nodules: clinical prediction model versus physicians. Mayo Clin Proc 1999; 74: 319-29. [DOI] [PubMed] [Google Scholar]
- 7).Yonemori K, Tateishi U, Uno H, et al. Development and validation of diagnostic prediction model for solitary pulmonary nodules. Respirology 2007; 12: 856-62. [DOI] [PubMed] [Google Scholar]
- 8).Cooley JW, Turkey JW. An algorithm for the machine calculation of complex Fourier series. Math Comput 1965; 19: 297-301. [Google Scholar]
- 9).Broughton SA, Bryan K. Discrete Fourier Analysis and Wavelets: Applications to Signal and Image Processing. New York: Wiley, 2008; p 72. [Google Scholar]
- 10).Hirakata K, Nakata H, Haratake J. Appearance of pulmonary metastases on high-resolution CT scans: comparison with histopathologic findings from autopsy specimens. AJR Am J Roentgenol 1993; 161: 37-43. [DOI] [PubMed] [Google Scholar]
- 11).Gaeta M, Pandolfo I, Volta S, et al. Bronchus sign on CT in peripheral carcinoma of the lung: value in predicting results of transbronchial biopsy. AJR Am J Roentgenol 1991; 157: 1181-5. [DOI] [PubMed] [Google Scholar]
- 12).Radosavljevic V, Gardijan V, Brajkovic M, et al. Lung hamartoma—diagnosis and treatment. Med Arh 2012; 66: 281-2. [DOI] [PubMed] [Google Scholar]


