

Abstract
Elevated cerebrospinal fluid (CSF) levels of the glia-derived N-methyl-D-aspartic acid receptor antagonist kynurenic acid (KYNA) have consistently been implicated in schizophrenia and bipolar disorder. Here, we conducted a genome-wide association study based on CSF KYNA in bipolar disorder and found support for an association with a common variant within 1p21.3. After replication in an independent cohort, we linked this genetic variant—associated with reduced SNX7 expression—to positive psychotic symptoms and executive function deficits in bipolar disorder. A series of post-mortem brain tissue and in vitro experiments suggested SNX7 downregulation to result in a caspase-8-driven activation of interleukin-1β and a subsequent induction of the brain kynurenine pathway. The current study demonstrates the potential of using biomarkers in genetic studies of psychiatric disorders, and may help to identify novel drug targets in bipolar disorder.
INTRODUCTION
Elevation of brain kynurenic acid (KYNA) is a consistently found biochemical aberration in schizophrenia and bipolar disorder (BD).1–7 Brain KYNA is mainly produced in astrocytes as an end-metabolite of the kynurenine pathway of tryptophan metabolism. This pathway is highly inducible by inflammatory stimuli,8 and we have previously reported that cerebrospinal fluid (CSF) levels of the proinflammatory cytokine interleukin (IL)-1β are markedly increased in patients with BD or schizophrenia, although the majority of other cytokines measured in this study were undetectable.9,10
KYNA is a neuroactive metabolite that antagonizes the glycine co-agonist site of the N-methyl-D-aspartic acid receptor (NMDAR).8 Administration of synthetic NMDAR antagonists causes psychotic symptoms in healthy individuals,11 and exacerbates psychotic features in patients with schizophrenia.12 Psychotic symptoms are core features of schizophrenia, and more than half of patients with BD will experience psychosis in their lifetime.13 Supporting that KYNA might be specifically involved in the pathophysiology underlying psychotic symptoms, we have found higher levels of CSF KYNA in BD-I patients with a history of psychosis compared with those who had never experienced psychosis.14 KYNA also noncompetitively antagonizes the cholinergic α7 nicotinic receptor, and animal studies indicate that increased brain KYNA might cause cognitive deficits.8 In rats, increased brain KYNA causes behavioral responses analogous to impaired set-shifting in humans,15 an index of executive function. Set-shifting dysfunction as measured by the trail making test (TMT) is indeed a feature of schizophrenia and euthymic BD,16,17 especially in BD patients with a history of psychosis.18
Family history is the strongest risk factor for BD, but an important obstacle for progress in psychiatric genetics is that psychiatric syndromes—based solely on symptom clustering—do not necessarily reflect specific underlying biological dysfunctions and may be insufficient to delineate heritable phenotypes.19 Indeed, epidemiological and molecular genetic studies have blurred the diagnostic boundary between schizophrenia and BD by demonstrating that these disorders have partly shared genetic causes.20,21 Complementary approaches to unearth causal genetic mutations are therefore needed. One approach is to focus on biomarkers, that is, measurable key components in biological pathways between genotype and disease.22 For this purpose, the use of CSF KYNA may be particularly rewarding given its biological links to distinct subdomains of pathology present in both BD and schizophrenia.
In this study of euthymic BD patients, we found CSF IL-1β and KYNA to be associated with a history of psychosis and set-shifting impairment. CSF levels of KYNA were also strongly associated with the dopamine metabolite homovanillic acid (HVA). We conducted a genome-wide association study (GWAS) against CSF levels of KYNA in BD that revealed a genome-wide significant association with the single-nucleotide polymorphism (SNP) rs10158645 within 1p21.3, a finding that was replicated in an independent cohort of BD patients. Furthermore, we analyzed this SNP in relation to CSF HVA, a history of psychosis (followed by a replication in a large data set of 565 BD patients) and set-shifting ability. As the minor allele in rs10158645 was associated with decreased expression of sorting nexin 7 (SNX7), we attempted to decipher the biochemical chain of events using a multipronged approach including causal inference analyses of clinical data, post-mortem data and cell culture studies. These experiments converged on the proposal that decreased SNX7 expression is linked to increased CSF KYNA concentration and ultimately psychosis and set-shifting difficulties in BD through caspase-8-driven activation of IL-1β.
MATERIALS AND METHODS
The study was approved by the institutional review board of the Karolinska Institutet. Informed consent was obtained from all included subjects.
Clinical data sets (I–IV)
All patient data were collected from Swedish euthymic BD patients in a long-term follow-up program. The diagnostic procedure has been outlined in detail previously.3 In addition to the collected research data, we also performed medical chart reviews for the patients in data sets I, II and III, and in some cases interviews with the treating physician, to assure the diagnostic accuracy (see Supplementary Information). If not specified in the Supplementary Information, all analyses included all subjects for whom data were available (the numbers vary because not all patients volunteered to undertake all investigations). The general population controls were randomly selected by Statistics Sweden (except for the controls used in the analyses of CSF IL-1β who were healthy volunteers collected at Linköping University Hospital in Sweden). Further descriptions of the data sets, as well as details of CSF collection and analyses, are provided in the Supplementary Information. The Supplementary Information also contains a table describing the main analyses in relation to the different cohorts (Supplementary Table S1). Experienced psychologists performed the neuropsychological assessments, using Delis–Kaplan Executive Function System. To obtain a sensitive measure of set-shifting, we employed TMT of Delis–Kaplan Executive Function System and extracted the total time taken for Combined Letter/Number Switching minus the Combined Number Sequencing+Letter Sequencing, that is, ‘switching cost’. Raw contrast scores were transformed into age-corrected scaled contrast scores based on normative data in which an achievement score of 10 represents the mean in each age group.23
Genotyping and quality control
Whole-genome genotyping in data set II, as well as in controls, was done on the Affymetrix 6.0 array (Santa Clara, CA, USA) at the Broad Institute in Boston, MA, USA. Subjects in sample IV were genome-wide genotyped using the Affymetrix 6.0 chip or the Illumina OmniExpress chip (Illumina, Inc., San Diego, CA, USA). Procedures for genotyping and quality control have been provided in prior publications.24 Patients in sample III were genotyped for rs10158645 on a 7900HT Fast Real-Time PCR System Instrument by using allele-specific TaqMan MGB probes labeled with fluorescent dyes FAM and VIC (Applied Biosystems, Foster City, CA, USA) according to the manufacturer’s protocols. Allelic discrimination was performed with the ABI PRISM 7900HT SDS and the SDS 2.2.1 program (Applied Biosystems) in 384-well format with 9 negative controls distributed in each plate. The rs10158645 genotype distribution did not depart from Hardy–Weinberg equilibrium. Ten percent of the samples were run in duplicate to verify genotyping results.
Expression quantitative trait data and coexpression patterns (data sets V–IX)
Data set V was based on fibroblast data from the MuTHER resource and assessed through the Genevar database (GENe Expression VARiation, The Wellcome Trust Sanger Institute; http://www.sanger.ac.uk/resources/software/genevar). The replication data set (VI) was based on lymphoblastoid cell lines from all unrelated subjects of the HapMap3 population (SNPexp v1.2; http://app3.titan.uio.no/biotools/help.php?app=snpexp). For the lncRNA (RP5-896L10.1) and SNX7 coexpression analysis (data set VII), we used a sample from the Functional Genomics Laboratory at University of California, Irvine (MPV) in which RNA-sequencing analyses for both coding and noncoding transcripts were assayed from 32 dorsolateral prefrontal cortex samples obtained from healthy volunteers. To study coexpression of SNX7, CASP8, IL1B and TDO2 (data set VIII), we used a post-mortem brain tissue collection deposited in the Braincloud database (http://braincloud.jhmi.edu). Through an authorized access (MPV), we obtained data on 272 tissue homogenates of dorsolateral prefrontal cortex gray matter (BA46/9) from healthy donors. The sample and the methods have been previously described.25 Levels of dorsolateral prefrontal cortex (BA46) CASP8 mRNA in relation to psychosis in BD (data set IX) were studied using data obtained from the Stanley Medical Research Institute database (www.stanleygenomics.org).
Human astrocyte cultures
Human embryonic primary cortical astrocytes were purchased from ScienCell Research Laboratories (Carlsbad, CA, USA) and cultured according to the manufacturer’s recommendations. Before experiments, characterization of the cells was performed to rule out the presence of microglia or neurons in the culture. All experiments were performed on cells in passage 4. Cells were serum starved (0.02% fetal bovine serum and 0.01% growth supplement mix) for 24 h before experiments. Cytokines and antibodies used in the cell studies are described in the Supplementary Information.
Quantitative real-time PCR
Total RNA was extracted using Trizol Reagent (Invitrogen, Carlsbad, CA, USA) according to the manufacturer’s protocol. Quantitative PCR was performed using the Fast Real-Time PCR System (Applied Biosystems). See Supplementary Information for a complete description of used methods.
Western blot analyses
Total protein was extracted using ice-cold lysis buffer. The membrane was incubated with primary antibody against tryptophan 2,3-dioxygenase-2 (TDO2; 1:2000) or indoleamine 2,3-dioxygenase 1 (IDO1; 1:1000) overnight, and then incubated with secondary antibody for 1 h in room temperature. Protein levels were normalized to β-actin (1:5000) and blots were analyzed using Quantity One 1-D Analysis Software (Bio-Rad, Hercules, CA, USA). See Supplementary Information for further details.
Analysis of KYNA in cell culture supernatants
Cell culture supernatants were collected and immediately frozen on dry ice and kept in − 20 °C until analysis. Analyses of KYNA are described in Supplementary Information.
Statistics
The primary analysis in the GWAS was a linear regression of CSF KYNA residuals on single-SNP allele dosage. ‘Genome-wide significance’ was set to P<5 × 10⁻⁸. Additional analyses with the first four multidimensional scaling components as covariates to control for population substructure were also performed. In the correlation analyses, ‘r’ refers to Pearson’s correlation coefficient if not otherwise specified. The sample size chosen in the replication of the GWAS was based on a power of 95%. The assumptions of each test were checked. All reported P-values are two sided. All analyses were done using the statistical software programs R (R Development Core Team, Vienna, Austria), IBM SPSS Statistics 20.0 (IBM SPSS, Chicago, IL, USA), the script PROCESS for SPSS (percentile bootstrap = 20 000) and Graph-Pad prism 6.0 (http://www.graphpad.com/).
RESULTS
CSF biomarkers and clinical endophenotypes in BD
CSF IL-1β concentrations in male euthymic BD patients (N = 27) were derived from data set I. Patients with a history of psychosis (N = 16) had significantly increased CSF IL-1β concentrations compared with patients without (N = 11), but both groups displayed increased IL-1β levels compared with healthy controls (N = 30; Figure 1a). The control group was significantly younger than the patient groups but CSF IL-1β concentration was not associated with age, and adjusted analyses gave similar results (data not shown). Body mass index, smoking status and weekly alcohol consumption were also independent of CSF IL-1β concentration (data not shown). Comparison of pharmacological treatments between psychotic and nonpsychotic bipolar patients suggested an equal distribution (Supplementary Table S2), and no significant effects of any pharmacological treatment on IL-1β concentration could be detected (data not shown).
Figure 1.
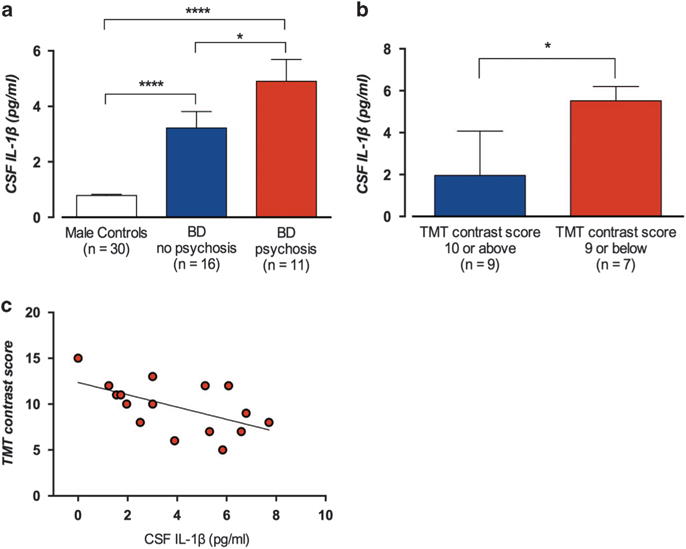
Cerebrospinal fluid (CSF) concentrations of interleukin-1β (IL-1β) in male euthymic bipolar disorder patients (data set I) and healthy controls. (a) Mean CSF IL-1β concentration (± s.e.m.) in 30 healthy male volunteers (0.79 ±0.044 pg ml−1), 16 bipolar disorder patients without a history of psychosis (3.06 ± 0.58 pg ml−1) and 11 bipolar patients with a history of psychosis 5.35 ± 0.71 pg ml−1. One-way analysis of variance (ANOVA) with Tukey’s post hoc tests, P<1 × 10⁻⁶; post hoc tests: controls vs nonpsychotic bipolar patients, P = 6 × 10⁻⁵; controls vs psychotic bipolar patients, P<1 × 10⁻⁶; and nonpsychotic bipolar vs psychotic bipolar patients, P = 0.020. (b) Of these patients, 16 carried out the trail making test (TMT). Nine patients scored ≥ 10 (mean standard score) and 7 scored <10. The median CSF IL-1β concentration was higher in the group with more difficulties in set-shifting (5.84 ± 2.89 pg ml−1 (median ± interquartile range)) compared with the group that scored ≥ 10 (1.96 ± 2.68 pg ml−1, Mann–Whitney U-test, P = 0.012). (c) A possible confounding effect of peripheral inflammation was assessed with correlation analyses. Increasing CSF IL-1β concentration was associated with difficulties in set-shifting (rs (Spearman) = − 0.53, P = 0.034), also when adjusting for high-sensitivity C-reactive protein (hsCRP) concentration (rs = − 0.59, P = 0.021). Error bars represent mean ± s.e.m. in (a) and in (b) median with third quartile. Two-sided P-values, statistical significance set to P<0.05. *P<0.05, ****P<0.0001.
In conjunction with the lumbar puncture, 16 of the 27 BD patients volunteered for cognitive testing with TMT to evaluate executive functions in terms of set-shifting ability. The median CSF IL-1β concentration was significantly higher in patients who scored below the mean standard score of 10 on TMT (Switching vs Combined Number Letter Sequencing) compared with patients scoring ≥ 10 (Figure 1b). As a putative influx of peripheral IL-1β to the brain may influence central levels of IL-1β, we tested for a possible confounding effect of peripheral inflammation by measuring serum high-sensitivity C-reactive protein in these patients. High-sensitivity C-reactive protein covaries with serum concentration of IL-1β,26 and is associated with cognitive impairment.27 Nevertheless, a significant negative correlation between CSF IL-1β concentration and set-shifting ability remained, even after a partial correlation analyses with high-sensitivity C-reactive protein as covariate (Figure 1c).
We measured CSF KYNA concentrations in a cohort of genotyped euthymic BD patients (N = 76, data set II) and randomly selected controls from the general population (N = 46). An effect of age on CSF KYNA concentration was observed in patients as well as in controls (β (unstandardized coefficient) = 0.025, P = 2 × 10⁻³, β = 0.031, P = 7 × 10⁻⁶, respectively). To account for potential age confounding, we henceforth used the residuals from a linear regression of age vs CSF KYNA when age was indicated as a potential confounder. In patients, CSF KYNA concentration was independent of bipolar subtype (P = 0.63). Nor did age-adjusted CSF KYNA concentration correlate to lifetime number of mood episodes (P = 0.54), body mass index, smoking status or weekly alcohol consumption (data not shown). The 36 patients with a history of psychosis but not the 40 patients without such a history had a significantly increased mean CSF KYNA concentration compared with the control group. Moreover, patients with a history of psychosis had significantly higher CSF KYNA concentration than patients without a history of psychosis (Figure 2a). Comparing pharmacological treatments between these groups, only lithium use was more common in the group with a history of psychosis (Fisher’s exact test; P = 0.034). However, the use of lithium was not associated with CSF KYNA concentration (P = 0.75). For a complete list of ongoing pharmacological treatments in data set II, see Supplementary Table S3.
Figure 2.
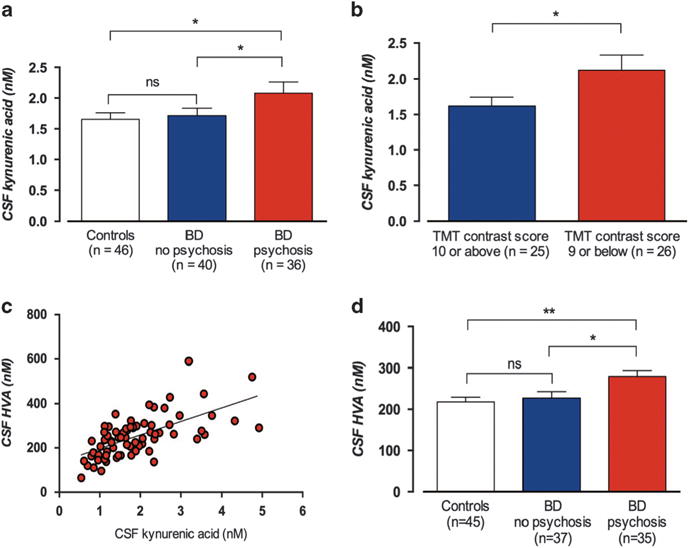
Cerebrospinal fluid (CSF) concentrations of kynurenic acid (KYNA) in euthymic bipolar disorder (BD) patients (data set II) and healthy controls. (a) Mean CSF KYNA concentration (± s.e.m.) in 46 healthy controls (1.60 ±0.10 nM), 40 bipolar patients without a history of psychosis (1.72 ± 0.12 nM) and 36 bipolar patients with a history of psychosis (2.08 ± 0.18 nM). One-way analysis of variance (ANOVA) with Tukey’s post hoc tests (using residuals from a linear regression of age vs CSF KYNA); P = 9 × 10⁻³; post hoc tests: controls vs nonpsychotic bipolar patients, P = 0.99; controls vs psychotic bipolar patients, P = 0.015; and nonpsychotic bipolar vs psychotic bipolar patients, P = 0.026. (b) CSF KYNA (nM) in the 51 bipolar patients who underwent trail making test (TMT) from Delis–Kaplan Executive Function System (D-KEFS). The mean CSF KYNA concentration was significantly higher in patients who scored below the mean standard score (<10, N = 26; 2.12 ± 0.12 nM) compared with patients scoring average or higher (≥10, N = 25; 1.62 ± 0.21 nM, t-test: P = 0.048, Pearson’s r = 0.28; P = 0.045). (c) The correlation between CSF KYNA and CSF homovanillic acid (HVA) (nM) in 72 of these 76 patients. Pearson’s r = 0.67; P = 9 × 10⁻¹¹. (d) CSF HVA (nM) concentration in 72 bipolar patients with or without a history of psychosis in comparison with CSH HVA levels in 45 healthy controls. One-way ANOVA followed by Tukey’s post hoc tests revealed that the psychotic group had a significantly higher mean CSF HVA concentration (280 ± 14.4 nM) compared with controls (216 ± 10.6 nM, P = 3 × 10⁻³) and nonpsychotic patients (227 ± 15.6 nM, P = 0.024), whereas no significant different in CSF HVA concentration was seen between controls and nonpsychotic patients (P = 0.81). CSF KYNA concentration was independent of BD subtype (BD-I: M = 1.97 ± 0.17 nM, N = 40; BD-II: M = 1.80 ± 0.13 nM, N = 36, P = 0.43), and did not differ by sex (M = 1.93 ± 0.15 nM among females (N = 46), and M = 1.82 ± 0.15 nM among males (N = 30), respectively, P = 0.63). All error bars represent s.e.m. Two-sided P-values, statistical significance set to P<0.05. *P<0.05, **P<0.01, NS, not significant.
Of the 76 euthymic bipolar patients in data set II, 51 volunteered for cognitive testing with TMT. In line with the findings regarding IL-1β, the mean CSF KYNA concentration was significantly higher in patients who scored <10 (N = 26) compared with patients scoring ≥ 10 (N = 25; Figure 2b). Comparison of pharmacological treatments between the groups suggested an equal distribution (data not shown).
CSF concentration of HVA was successfully determined in 72 of the 76 patients in data set II and in 45 of the 46 controls. A strong positive correlation to CSF KYNA was observed in patients (Figure 2c). Similar to the analysis of CSF KYNA, patients with a history of psychosis had a significantly higher mean CSF HVA concentration than healthy controls or nonpsychotic BD patients, where no significant difference in CSF HVA concentration was seen (Figure 2d).
Common genetic variants and CSF biomarkers in BD
To elucidate the genetic variability underlying individual levels of CSF KYNA in BD, we conducted a GWAS against CSF KYNA concentrations using data set II. Despite the modest sample size (N = 76), one SNP (rs10158645), located within 1p21.3, reached genome-wide statistical significance in relation to CSF KYNA (β = 1.07, r = 0.58, P = 2.6 × 10⁻⁸, minor allele frequency = 0.15; Supplementary Figure S1A (MH-plot), Supplementary Figure S1B (QQ-plot), Supplementary Figures S1C–E). Background characteristics were similar between carriers and noncarriers of the minor allele in rs10158645 (Supplementary Table S4). Neither the total number of mood episodes nor the number of depressive episodes were associated with rs10158645 genotype (data not shown). To control for population substructure, we also analyzed the association using the first four multidimensional scaling components as covariates. In line with a low grade of genetic diversity (all subjects and their parents were born in Sweden), this yielded a similar result as the unadjusted analysis (β = 1.08, P = 4.3 × 10⁻⁸; for multidimensional scaling plots see Supplementary Figures S2A and B.
We then measured CSF concentrations of KYNA and genotyped rs10158645 (minor allele frequency = 0.15) in an independent cohort of 18 female and 12 male Swedish BD patients (data set III; median age 39 years, interquartile range = 22). In this data set, 13 patients had a BD-I diagnosis and 17 a BD-II diagnosis. Similar to the analysis in data set II, we observed a strong positive correlation between the minor G allele in rs10158645 and CSF KYNA concentration (Table 1 and Supplementary Figure S3).
Table 1.
Associations between the minor G allele in rs10158645, CSF concentration of KYNA, HVA and a history of psychosis in euthymic BD patients
| Data set | rs10158645 MAF |
CSF KYNA (nM)
|
CSF HVA (nM)
|
Psychosis
|
||||||||
|---|---|---|---|---|---|---|---|---|---|---|---|---|
| N | r | P | IEa | N | r | P | IEb | N | OR (95% CI) | P | ||
| II | 0.15 | 76 | 0.58 | 3 × 10⁻⁸ | 65 (36–101)c | 72 | 0.54 | 7 × 10⁻⁷ | 0.71 (0.15–1.8)c | 76 | 4.0 (1.4–12) | 0.011 |
| III | 0.15 | 30 | 0.48d | 7 × 10⁻³ | ||||||||
| IV | 0.18 | 565 | 1.5 (1.1–2.0) 6.5 (1.5–28)e |
0.020 0.013e |
||||||||
| II+IV | 0.17 | 641 | 1.6 (1.2–2.2) 7.3 (1.7–32)e |
2 × 10⁻³ 8 × 10⁻³ |
||||||||
Abbreviations: BD, bipolar disorder; CI, confidence interval; CSF, cerebrospinal fluid; HVA, homovanillic acid; IE, indirect effect; KYNA, kynurenic acid; MAF, minor allele frequency; OR, odds ratio. All reported P-values are two sided.
IE = indirect effect for mediation. Non-parametric bootstrap method, the PROCESS script for SPSS (see http://afhayes.com/spss-sas-and-mplus-macros-and-code.html). Causal variable = allele frequency in rs10158645, mediator = CSF KYNA concentration and outcome variable = CSF HVA concentration. Direct effect = 43 (−0.53 to 86).
Causal variable = CSF KYNA concentration, mediator = CSF HVA concentration and outcome variable = psychosis (0/1). Direct effect = 0.15 (−0.61to 0.90).
95% Bootstrap CI (percentile bootstrap = 20 000).
Spearman’s coefficient.
In sample I, only one patient was homozygous for the minor G allele in rs1018645 and the analysis was performed under an additive model. In sample II, 21 patients were homozygous for the minor G allele (18 with psychosis) and additional analyses under a recessive model was performed in sample II and the combined sample (I+II).
Analogous to results in BD patients, a significant effect of the minor G allele of rs10158645 on CSF KYNA concentration was also seen in the 46 healthy controls (β = 0.43, r = 0.31, P = 0.036; Supplementary Figure S4), although none of the controls carried the G/G genotype. Including an adjustment for population stratification gave a similar result (β = 0.50, P = 0.021). The allele distribution in rs10158645 did not differ when comparing all BD patients with controls (N = 123, odds ratio = 1.60, 95% confidence interval: 0.68–3.72; P = 0.30), but the risk allele was significantly overrepresented in bipolar subjects with psychosis compared with controls (N = 83, odds ratio = 2.83, 95% confidence interval: 1.10–7.23; P = 0.031).
Follow-up studies of rs10158645: psychosis and set-shifting ability
The minor allele of rs10158645 was associated with psychotic symptoms in data set II (odds ratio = 3.98, P = 0.011; Table 1). We then studied the effect of rs1018645 genotype on psychosis using an independent data set of 565 BD patients without CSF data (data set IV). Again, we tested the effect of the rs10158645 genotype on risk of psychosis and observed an increased risk of psychosis for patients carrying the minor G allele (odds ratio = 1.50, P = 0.020; Table 1).
To achieve sufficient power, we tested the effect of rs10158645 on set-shifting ability combining all patients in data sets II and IV with TMT data (N = 89). Carriers of the minor allele scored lower than the mean standard score of 10 (N = 29, M = 8.93 ± 0.47), whereas noncarriers scored close to 10 (N = 60, M = 10.1 ± 0.30; P = 0.035), indicating diminished cognitive flexibility in carriers of the minor allele.
Causal mediation analyses
The minor allele in rs10158645 was associated with increased CSF HVA concentration in data set II (β = 0.54, P = 7.3 × 10⁻⁷; Table 1). As previous experimental studies showed that elevation of rat brain KYNA levels is associated with activation of midbrain dopamine firing,28 we applied a statistical mediational model with rs10158645 allele frequency as the causal variable, CSF KYNA as the mediator and CSF HVA as the outcome variable. The same cases (N = 72) were used in all analyses, and the same covariate (age) were used in all equations. Using a nonparametric bootstrap method,29 the indirect effect that estimates the amount of mediation was significant, whereas the direct effect was smaller and nonsignificant (Table 1). To study possible reverse causal effects we interchanged the mediator and outcome variable. This also suggested a significant indirect effect but now with a significant and larger direct effect, hereby suggesting a better fit of the first model. Thus, these mediation analyses propose that the causal minor allele in rs10158645 increases CSF HVA via KYNA, in agreement with previous experimental studies.
To study whether the association of KYNA on psychosis in BD was driven by an effect on dopaminergic transmission, we tested a mediation model in which CSF KYNA was the causal variable, CSF HVA the mediator and psychosis the outcome variable. Again, we included age as a covariate, and used the same 72 subjects. This model gave a significant indirect effect with a nonsignificant direct effect (Table 1), suggesting that the increased risk of psychosis caused by elevated levels of KYNA was mediated by dopamine neurotransmission.
The identified genetic locus and variation in gene expression
We searched the MuTHER resource30 (fibroblast data, data set V) regarding the effect of rs10158645 genotype on gene expression (the search by default set to a search of +/− 1 Mb, that is, cis-effects). The strongest association was found between the minor allele in rs10158645 and a decreased expression of the nearby gene SNX7 (P = 2.0 × 10⁻⁴). We then studied the effect of rs10158645 genotype on SNX7 expression in a replication data set (N = 198, data set VI), based on data from another cell type (lymphoblastoid cell lines) and again observed a significant and similar association (P = 9.6 × 10⁻³).
rs10158645 is located in an intron of RP5-896L10.1, a long noncoding RNA (lncRNA) gene that is predominately expressed in the brain, and ~ 2 kB from a predicted enhancer region. Although sparsely studied, lncRNA has recently been shown to regulate the expression of nearby genes, that is, cis-effects.31 Utilizing tissue from 32 post-mortem human brains (data set VII), we found an inverse coexpression of RP5-896L10.1 and SNX7 (r = − 0.23; P = 0.030), suggesting that the observed cis-effect of rs10158645 on SNX7 was mediated by increased RP5-896L10 expression. Against this background, we deemed that the most likely functionality of the identified locus was to regulate SNX7 expression.
SNX7 downstream signaling and KYNA synthesis
The SNX family proteins function in diverse intracellular trafficking and signaling processes.32 Although SNX7 is rarely studied, a recent report showed that a downregulation of SNX7 increases caspase-8 protein levels in hepatocytes, most likely by inducing the degradation of the short form of c-FLIP at the riboptosome platform.33 Caspase-8 has a pivotal role for microglia activation by cleaving pro-IL-1β into its biologically active structure,34,35 and the brain kynurenine pathway almost exclusively plays out in microglia and astrocytes. The first step of the pathway, that is, the conversion of tryptophan to N-formylkynurenine by the enzyme IDO1 or the complementary enzyme TDO2, are proposed to be critically regulated by immune signaling.8
First, we investigated whether IL-1β induces TDO2 and/or IDO1 in human astrocytes, the main producer of KYNA in the brain. Stimulation with IL-1β increased the expression of both IDO1 and TDO2 mRNA, but only increased protein levels of TDO2. Cells stimulated with IL-1β also showed 4 times higher KYNA concentrations compared with vehicle-treated cells (see Figure 3 and Supplementary Figures S5–S9 for details). Our results, suggesting IL-1β-driven TDO2 upregulation to increase KYNA synthesis, are in line with a recent report showing a similar mechanism in human endometrioma stromal cells.36
Figure 3.
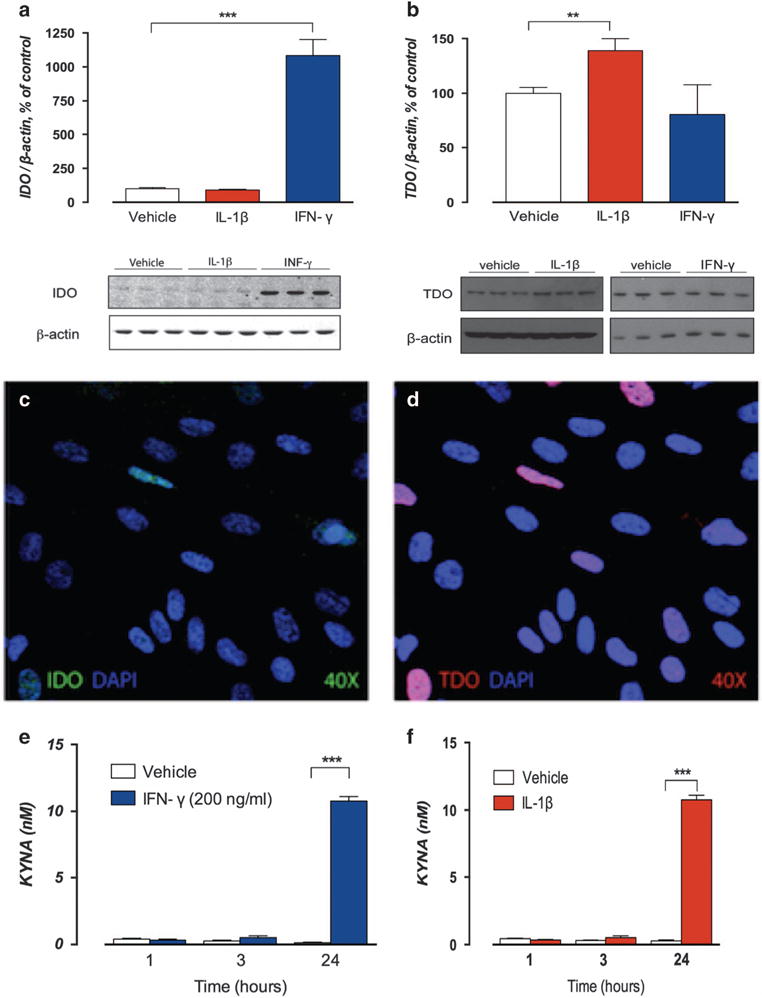
Stimulation of fetal human cortical astrocytes with interleukin-1β (IL-1β) and interferon-γ (IFN-γ). Fetal cultured human cortical astrocytes stimulated with recombinant human IL-1β (10 ng ml−1) and IFN-γ (200 ng ml−1), a prototypical indoleamine 2,3-dioxygenase 1 (IDO1) activator, as positive control. Protein levels of IDO1 and tryptophan 2,3-dioxygenase-2 (TDO2) analyzed at baseline and after exposure to IL-1β or IFN-γ for 48 h. IDO and TDO immunopositive bands are normalized to β-actin. Bar graphs here represent IDO1 and TDO2 protein levels expressed as % of vehicle-treated control cultures. All cells were analyzed for kynurenic acid (KYNA) at time points 1, 3 and 24 h. Bar graphs here represent % of vehicle (t = 1 h) at these time points. All data are reported as mean ± s.e.m. All experiments were performed in triplicate and repeated twice. Representative western blots of IDO1 and TDO2 are shown below each bar graph (see Supplementary Figures S7–S9 for full size western blots). (a) Low levels of IDO1 protein expression were detected in unstimulated cells, but despite the marked increase of IDO1 mRNA levels following IL-1β stimulation, no changes in protein levels were observed after 48 h of IL-1β exposure (90 ± 5.13% vs 100 ± 7.85%, P = 0.41). Stimulation with IFN-γ was associated with a marked increase in protein levels of IDO1 (1084 ± 117% vs 100 ± 7.85%, P = 0.001). (b) Stimulation with IL-1β for 48 h increased protein levels of TDO2 compared with vehicle-treated cells (139 ± 11.1% vs 100 ± 2.70%, P = 0.006), whereas stimulation with IFN-γ did not affect protein levels of TDO2 (90 ± 11.2% vs 100 ± 8.70% P = 0.21). Immunofluorescent staining of IDO1 (c) protein visualized in green and TDO2 (d) protein visualized in red following 48 h of IL-1β stimulation confirmed low levels of IDO protein in most cells and scattered cells expressing high levels of TDO2. Images captured at × 40 magnification. Nuclear staining was performed using 4′,6-diamidino-2-phenylindole (DAPI). (e) At 24 h, cells stimulated with IFN-γ had more than 85 times higher KYNA concentrations (10.8 ± 0.34 nM) than vehicle-treated cells (0.14 ± 0.04 nM, P<0.0001). (f) At 24 h, cells stimulated with IL-1β showed 4 times higher KYNA concentrations (mean ± s.e.m.: 1.70 ± 0.11 nM) than vehicle-treated cells (0.42 ± 0.10 nM, p<0.0001). Two-sided P-values, statistical significance set to P<0.05, **P<0.01, ***P<0.001.
We performed analyses of human brain mRNA coexpression data to further evaluate the importance of SNX7 downregulation for IL-1β-driven induction of TDO2. In a sample of 272 tissue homogenates of prefrontal gray matter from healthy donors (data set VIII), we observed a strong inverse correlation between SNX7 and TDO2 expression (r = − 0.56; P = 1 × 10⁻²³; Supplementary Figure S10A). In concordance with previous results from hepatocytes, we further found a strong inverse coexpression of SNX7 and CASP8 (r = − 0.44; P = 2 × 10⁻¹⁴; Supplementary Figure S10B). Notably, we also found that CASP8 expression was significantly increased in BD with psychotic features compared with BD without psychotic features (fold change = 1.15; 99% confidence interval: 1.04–1.20) using mRNA expression in a post-mortem sample of 105 BD patients (data set IX). Furthermore, consistent with our in vitro data from human astrocytes, we observed a strong correlation between IL-1β and TDO2 expression (r = 0.44; P = 5 × 10⁻¹⁴; Supplementary Figure S10C). This accords previous studies showing that TDO2 mRNA and protein levels are increased in schizophrenia and in BD patients with psychotic symptoms, whereas IDO1 levels are unaltered.37
DISCUSSION
This is to the best of our knowledge the first study of a heritable psychiatric disorder that at a molecular level attempts to link a GWAS finding, biochemical aberrations and clinical presentation. Our results suggest that a risk allele within 1p21.3 gives rise to a series of immune-related cascades that elevate brain KYNA levels and contribute to psychotic symptoms as well as persistent executive function deficits in BD. Our results align with previous experimental and clinical studies suggesting that KYNA, sharing both pharmacological and neurobehavioral effects with ketamine and phencyclidine, induces psychotomimetic effects and cognitive deficits.1,2,8
The role of KYNA in psychosis converges with multiple lines of evidence implicating an increased dopaminergic drive in mania and psychosis.38 Experimental studies have shown that elevation of rat brain KYNA levels with the same order of magnitude as observed in BD is associated with increased firing of midbrain dopaminergic neurons.28,39,40 These experimental findings corroborate our present results, showing higher levels of CSF HVA in psychotic BD patients compared with nonpsychotic BD patients, as well as a positive correlation between CSF KYNA and HVA. The KYNA-driven activation of dopamine transmission, also supported by our statistical causal mediation analyses, validates the classical view that dopamine contributes to psychotic symptoms in BD.
Persistent cognitive impairment is increasingly recognized as an important and heritable feature of BD.41 NMDAR as well as cholinergic α7 nicotinic receptor have an established role in cognitive functions.15,42,43 The present study demonstrates for the first time in humans that KYNA, an endogenous antagonist at both receptors, is associated with impaired cognitive flexibility in terms of decreased set-shifting ability. In support of a more generalized action of brain KYNA, cognitive enhancers such as D-serine/glycine transporter inhibitors or galantamine target the glycine site of the NMDAR or the cholinergic α7 nicotinic receptor, respectively. Indeed, mice with reduced glycine affinity of the NMDAR display behavioral set-shifting impairments that can be reversed by D-serine,43 and blockade of glycine transporters promotes set-shifting tasks in rats.44 In addition, KYNA-induced impairment in set-shifting ability in rats is reversed by galantamine.15 This suggests that D-serine/glycine transporter inhibitors or galantamine might prove principally useful to counteract cognitive dysfunction associated with high levels of KYNA.
In the present study, the genetic variation within 1p21.3 was also associated with increased risk of psychosis and cognitive impairments in BD. Gene expression data suggested that this genetic risk allele results in decreased expression of the SNX7. Our post-mortem and in vitro data point toward a caspase-8-driven activation of IL-1β that, through TDO2 induction, increases the astrocytic production of KYNA, eventually giving rise to psychotic symptoms and cognitive dysfunction in BD (Figure 4). It remains to be investigated whether this pertains to BD only or is a phenomenon shared with other psychiatric disorders. Clearly, glia plays an important role in a broad range of central nervous system pathologies,45,46 and under several of these conditions a dysregulation of the kynurenine pathway has been observed.8
Figure 4.
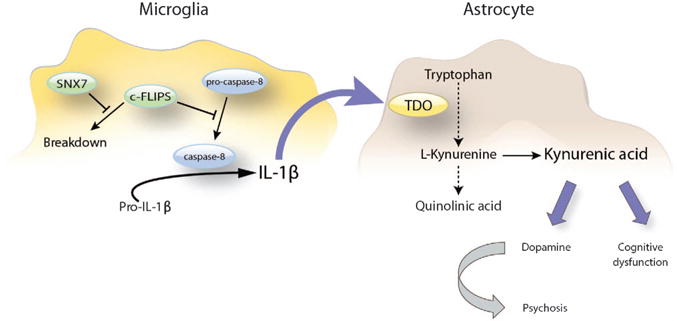
Overview of the proposed sorting nexin 7 (SNX7)-mediated induction of the kynurenine pathway in bipolar disorder (BD). Downregulation of SNX7 induces the degradation of the short form of c-FLIP that competitively inhibits the autocatalytic processing of pro-caspase-8 at the ripoptosome. This leads to increased levels of active caspase-8, resulting in the processing and secretion of interleukin-1β (IL-1β). IL-1β subsequently induces the rate-limiting enzyme tryptophan 2,3-dioxygenase-2 (TDO2) in the kynurenine pathway, causing an elevation in brain kynurenic acid (KYNA) that, according to our clinical association data, leads to a persistent set-shifting impairment as well as to a dopaminergic dysregulation that evoke vulnerability for psychosis in bipolar disorder.
This study has some important limitations. First, as we use high-resolution phenotypic data, for example, CSF biomarkers from a meticulously clinically characterized BD cohort with a low grade of genetic diversity, our sample sizes are inevitably much smaller than in conventional psychiatric multicenter case–control GWAS. However, the successful replications, together with the results of the complementary cell and post-mortem experiments, suggest that our findings in the discovery cohort are robust. Moreover, it has been repeatedly shown that biomarkers, in comparison with clusters of co-occurring symptoms, are under more direct genetic control, and thus more tractable traits in GWAS paradigms.47–49 Hence, genetic studies of biomarkers might be an alternative strategy for highly needed mechanistic studies of neuropsychiatric disorders, and the current study demonstrates the potential of such an approach. Second, although we demonstrate several consistent associations between molecular and clinical components, we lack conclusive data that directly tie together these individual associations to a signaling pathway that is causally related to psychosis and cognitive deficits. More specifically, we do not demonstrate a direct link between the genetic risk variant and CSF IL-β levels or between CSF levels of IL-1β and KYNA. Third, the analyses of SNX7 downstream signaling were performed on post-mortem tissue or using in vitro data. Studies using genetic editing in living brain cells are warranted to verify these mechanisms.
To conclude, this study offers evidence for a genetic risk allele that contributes to vulnerability for psychosis and cognitive deficits in BD through increased KYNA production. The proposed mechanism of an aberrant SNX7/caspase-8/IL-1β signaling, the induction of TDO2 enzyme activity and eventually enhanced KYNA synthesis may help to identify novel drug targets for the prevention of psychotic symptoms and cognitive dysfunction in BD.
Supplementary Material
Acknowledgments
We thank the patients who contributed to this study. We also thank clinical collaborators and facilitators for help with recruitment of participants. We are grateful to Pascal Borgström for assistance with the cognitive assessment and to Emil Rhenberg for statistical support. This work was supported by grants from the Swedish Medical Research Council (to Landén: K2014-62X-14647-12-51 and K2010-61P-21568-01-4; to Engberg: 2009–3068 and 2011–4789; to Erhardt: 2009–7053 and 2013–2838; to Schalling: 2011–4807 and 2013–6652; and to Svensson: 2009–3068), the Swedish foundation for Strategic Research (KF10–0039), the Swedish Brain foundation, Petrus och Augusta Hedlunds Stiftelse, Åhlén-stiftelsen, the AstraZeneca-Karolinska Institutet Joint Research Program in Translational Science, the regional agreement on medical training and clinical research between Stockholm County Council and the Karolinska Institutet (ALF 20100305 and KID) and the Broad Institute.
Footnotes
CONFLICT OF INTEREST
The authors declare no conflict of interest.
Supplementary Information accompanies the paper on the Molecular Psychiatry website (http://www.nature.com/mp)
References
- 1.Erhardt S, Blennow K, Nordin C, Skogh E, Lindstrom LH, Engberg G. Kynurenic acid levels are elevated in the cerebrospinal fluid of patients with schizophrenia. Neurosci Lett. 2001;313:96–98. doi: 10.1016/s0304-3940(01)02242-x. [DOI] [PubMed] [Google Scholar]
- 2.Schwarcz R, Rassoulpour A, Wu HQ, Medoff D, Tamminga CA, Roberts RC. Increased cortical kynurenate content in schizophrenia. Biol Psychiatry. 2001;50:521–530. doi: 10.1016/s0006-3223(01)01078-2. [DOI] [PubMed] [Google Scholar]
- 3.Olsson SK, Samuelsson M, Saetre P, Lindstrom L, Jonsson EG, Nordin C, et al. Elevated levels of kynurenic acid in the cerebrospinal fluid of patients with bipolar disorder. J Psychiatry Neurosci. 2010;35:195–199. doi: 10.1503/jpn.090180. [DOI] [PMC free article] [PubMed] [Google Scholar]
- 4.Olsson SK, Larsson MK, Erhardt S. Subchronic elevation of brain kynurenic acid augments amphetamine-induced locomotor response in mice. J Neural Transm. 2012;119:155–163. doi: 10.1007/s00702-011-0706-6. [DOI] [PubMed] [Google Scholar]
- 5.Linderholm KR, Skogh E, Olsson SK, Dahl ML, Holtze M, Engberg G, et al. Increased levels of kynurenine and kynurenic acid in the CSF of patients with schizophrenia. Schizophr Bull. 2012;38:426–432. doi: 10.1093/schbul/sbq086. [DOI] [PMC free article] [PubMed] [Google Scholar]
- 6.Wonodi I, Stine OC, Sathyasaikumar KV, Roberts RC, Mitchell BD, Hong LE, et al. Downregulated kynurenine 3-monooxygenase gene expression and enzyme activity in schizophrenia and genetic association with schizophrenia endophenotypes. Arch Gen Psychiatry. 2011;68:665–674. doi: 10.1001/archgenpsychiatry.2011.71. [DOI] [PMC free article] [PubMed] [Google Scholar]
- 7.Lavebratt C, Olsson S, Backlund L, Frisen L, Sellgren C, Priebe L, et al. The KMO allele encoding Arg452 is associated with psychotic features in bipolar disorder type 1, and with increased CSF KYNA level and reduced KMO expression. Mol Psychiatry. 2014;19:334–341. doi: 10.1038/mp.2013.11. [DOI] [PMC free article] [PubMed] [Google Scholar]
- 8.Schwarcz R, Bruno JP, Muchowski PJ, Wu HQ. Kynurenines in the mammalian brain: when physiology meets pathology. Nat Rev Neurosci. 2012;13:465–477. doi: 10.1038/nrn3257. [DOI] [PMC free article] [PubMed] [Google Scholar]
- 9.Soderlund J, Olsson SK, Samuelsson M, Walther-Jallow L, Johansson C, Erhardt S, et al. Elevation of cerebrospinal fluid interleukin-1ss in bipolar disorder. J Psychiatry Neurosci. 2011;36:114–118. doi: 10.1503/jpn.100080. [DOI] [PMC free article] [PubMed] [Google Scholar]
- 10.Soderlund J, Schroder J, Nordin C, Samuelsson M, Walther-Jallow L, Karlsson H, et al. Activation of brain interleukin-1beta in schizophrenia. Mol Psychiatry. 2009;14:1069–1071. doi: 10.1038/mp.2009.52. [DOI] [PMC free article] [PubMed] [Google Scholar]
- 11.Krystal JH, Karper LP, Seibyl JP, Freeman GK, Delaney R, Bremner JD, et al. Sub-anesthetic effects of the noncompetitive NMDA antagonist, ketamine, in humans. Psychotomimetic, perceptual, cognitive, and neuroendocrine responses. Arch Gen Psychiatry. 1994;51:199–214. doi: 10.1001/archpsyc.1994.03950030035004. [DOI] [PubMed] [Google Scholar]
- 12.Lahti AC, Koffel B, LaPorte D, Tamminga CA. Subanesthetic doses of ketamine stimulate psychosis in schizophrenia. Neuropsychopharmacology. 1995;13:9–19. doi: 10.1016/0893-133X(94)00131-I. [DOI] [PubMed] [Google Scholar]
- 13.Dunayevich E, Keck PE., Jr Prevalence and description of psychotic features in bipolar mania. Curr Psychiatry Rep. 2000;2:286–290. doi: 10.1007/s11920-000-0069-4. [DOI] [PubMed] [Google Scholar]
- 14.Olsson SK, Sellgren C, Engberg G, Landen M, Erhardt S. Cerebrospinal fluid kynurenic acid is associated with manic and psychotic features in patients with bipolar I disorder. Bipolar Disord. 2012;14:719–726. doi: 10.1111/bdi.12009. [DOI] [PubMed] [Google Scholar]
- 15.Alexander KS, Wu HQ, Schwarcz R, Bruno JP. Acute elevations of brain kynurenic acid impair cognitive flexibility: normalization by the alpha7 positive modulator galantamine. Psychopharmacology. 2012;220:627–637. doi: 10.1007/s00213-011-2539-2. [DOI] [PMC free article] [PubMed] [Google Scholar]
- 16.Perianez JA, Rios-Lago M, Rodriguez-Sanchez JM, Adrover-Roig D, Sanchez-Cubillo I, Crespo-Facorro B, et al. Trail Making Test in traumatic brain injury, schizophrenia, and normal ageing: sample comparisons and normative data. Arch Clin Neuropsychol. 2007;22:433–447. doi: 10.1016/j.acn.2007.01.022. [DOI] [PubMed] [Google Scholar]
- 17.Yatham LN, Torres IJ, Malhi GS, Frangou S, Glahn DC, Bearden CE, et al. The International Society for Bipolar Disorders-Battery for Assessment of Neurocognition (ISBD-BANC) Bipolar Disord. 2010;12:351–363. doi: 10.1111/j.1399-5618.2010.00830.x. [DOI] [PubMed] [Google Scholar]
- 18.Bora E, Yucel M, Pantelis C. Neurocognitive markers of psychosis in bipolar disorder: a meta-analytic study. J Affect Disord. 2010;127:1–9. doi: 10.1016/j.jad.2010.02.117. [DOI] [PubMed] [Google Scholar]
- 19.Szatmari P, Maziade M, Zwaigenbaum L, Merette C, Roy MA, Joober R, et al. Informative phenotypes for genetic studies of psychiatric disorders. Am J Med Genet B Neuropsychiatr Genet. 2007;144B:581–588. doi: 10.1002/ajmg.b.30426. [DOI] [PubMed] [Google Scholar]
- 20.Lichtenstein P, Yip BH, Bjork C, Pawitan Y, Cannon TD, Sullivan PF, et al. Common genetic determinants of schizophrenia and bipolar disorder in Swedish families: a population-based study. Lancet. 2009;373:234–239. doi: 10.1016/S0140-6736(09)60072-6. [DOI] [PMC free article] [PubMed] [Google Scholar]
- 21.Cross-Disorder Group of the Psychiatric Genomics C. Lee SH, Ripke S, Neale BM, Faraone SV, Purcell SM, et al. Genetic relationship between five psychiatric disorders estimated from genome-wide SNPs. Nat Genet. 2013;45:984–994. doi: 10.1038/ng.2711. [DOI] [PMC free article] [PubMed] [Google Scholar]
- 22.Gottesman II, Gould TD. The endophenotype concept in psychiatry: etymology and strategic intentions. Am J Psychiatry. 2003;160:636–645. doi: 10.1176/appi.ajp.160.4.636. [DOI] [PubMed] [Google Scholar]
- 23.Homack S, Lee D, Riccio CA. Test review: Delis-Kaplan executive function system. J Clin Exp Neuropsychol. 2005;27:599–609. doi: 10.1080/13803390490918444. [DOI] [PubMed] [Google Scholar]
- 24.Bergen SE, O’Dushlaine CT, Ripke S, Lee PH, Ruderfer DM, Akterin S, et al. Genome-wide association study in a Swedish population yields support for greater CNV and MHC involvement in schizophrenia compared with bipolar disorder. Mol Psychiatry. 2012;17:880–886. doi: 10.1038/mp.2012.73. [DOI] [PMC free article] [PubMed] [Google Scholar]
- 25.Colantuoni C, Lipska BK, Ye T, Hyde TM, Tao R, Leek JT, et al. Temporal dynamics and genetic control of transcription in the human prefrontal cortex. Nature. 2011;478:519–523. doi: 10.1038/nature10524. [DOI] [PMC free article] [PubMed] [Google Scholar]
- 26.Hung AM, Ellis CD, Shintani A, Booker C, Ikizler TA. IL-1beta receptor antagonist reduces inflammation in hemodialysis patients. J Am Soc Nephrol. 2011;22:437–442. doi: 10.1681/ASN.2010070760. [DOI] [PMC free article] [PubMed] [Google Scholar]
- 27.Hoshi T, Yamagami H, Furukado S, Miwa K, Tanaka M, Sakaguchi M, et al. Serum inflammatory proteins and frontal lobe dysfunction in patients with cardiovascular risk factors. Eur J Neurol. 2010;17:1134–1140. doi: 10.1111/j.1468-1331.2010.02990.x. [DOI] [PubMed] [Google Scholar]
- 28.Erhardt S, Engberg G. Increased phasic activity of dopaminergic neurones in the rat ventral tegmental area following pharmacologically elevated levels of endogenous kynurenic acid. Acta Physiol Scand. 2002;175:45–53. doi: 10.1046/j.1365-201X.2002.00962.x. [DOI] [PubMed] [Google Scholar]
- 29.Hayes AF, Preacher KJ. Statistical mediation analysis with a multicategorical independent variable. Br J Math Stat Psychol. 2013;67:451–470. doi: 10.1111/bmsp.12028. [DOI] [PubMed] [Google Scholar]
- 30.Nica AC, Parts L, Glass D, Nisbet J, Barrett A, Sekowska M, et al. The architecture of gene regulatory variation across multiple human tissues: the MuTHER study. PLoS Genet. 2011;7:e1002003. doi: 10.1371/journal.pgen.1002003. [DOI] [PMC free article] [PubMed] [Google Scholar]
- 31.Lai F, Orom UA, Cesaroni M, Beringer M, Taatjes DJ, Blobel GA, et al. Activating RNAs associate with Mediator to enhance chromatin architecture and transcription. Nature. 2013;494:497–501. doi: 10.1038/nature11884. [DOI] [PMC free article] [PubMed] [Google Scholar]
- 32.Teasdale RD, Collins BM. Insights into the PX (phox-homology) domain and SNX (sorting nexin) protein families: structures, functions and roles in disease. Biochem J. 2012;441:39–59. doi: 10.1042/BJ20111226. [DOI] [PubMed] [Google Scholar]
- 33.Xu L, Yin W, Xia J, Peng M, Li S, Lin S, et al. An antiapoptotic role of sorting nexin 7 is required for liver development in zebrafish. Hepatology. 2012;55:1985–1993. doi: 10.1002/hep.25560. [DOI] [PubMed] [Google Scholar]
- 34.Burguillos MA, Deierborg T, Kavanagh E, Persson A, Hajji N, Garcia-Quintanilla A, et al. Caspase signalling controls microglia activation and neurotoxicity. Nature. 2011;472:319–324. doi: 10.1038/nature09788. [DOI] [PubMed] [Google Scholar]
- 35.Dupaul-Chicoine J, Saleh M. A new path to IL-1beta production controlled by caspase-8. Nat Immunol. 2012;13:211–212. doi: 10.1038/ni.2241. [DOI] [PubMed] [Google Scholar]
- 36.Urata Y, Koga K, Hirota Y, Akiyama I, Izumi G, Takamura M, et al. IL-1beta increases expression of tryptophan 2,3-dioxygenase and stimulates tryptophan catabolism in endometrioma stromal cells. Am J Reprod Immunol. 2014;72:496–503. doi: 10.1111/aji.12282. [DOI] [PubMed] [Google Scholar]
- 37.Miller CL, Llenos IC, Dulay JR, Weis S. Upregulation of the initiating step of the kynurenine pathway in postmortem anterior cingulate cortex from individuals with schizophrenia and bipolar disorder. Brain Res. 2006;1073–1074:25–37. doi: 10.1016/j.brainres.2005.12.056. [DOI] [PubMed] [Google Scholar]
- 38.Cousins DA, Butts K, Young AH. The role of dopamine in bipolar disorder. Bipolar Disord. 2009;11:787–806. doi: 10.1111/j.1399-5618.2009.00760.x. [DOI] [PubMed] [Google Scholar]
- 39.Erhardt S, Oberg H, Mathe JM, Engberg G. Pharmacological elevation of endogenous kynurenic acid levels activates nigral dopamine neurons. Amino Acids. 2001;20:353–362. doi: 10.1007/s007260170032. [DOI] [PubMed] [Google Scholar]
- 40.Olsson SK, Andersson AS, Linderholm KR, Holtze M, Nilsson-Todd LK, Schwieler L, et al. Elevated levels of kynurenic acid change the dopaminergic response to amphetamine: implications for schizophrenia. Int J Neuropsychopharmacol. 2009;12:501–512. doi: 10.1017/S1461145708009383. [DOI] [PubMed] [Google Scholar]
- 41.Arts B, Jabben N, Krabbendam L, van Os J. Meta-analyses of cognitive functioning in euthymic bipolar patients and their first-degree relatives. Psychol Med. 2008;38:771–785. doi: 10.1017/S0033291707001675. [DOI] [PubMed] [Google Scholar]
- 42.Ibrahim HM, Tamminga CA. Treating impaired cognition in schizophrenia. Curr Pharm Biotechnol. 2012;13:1587–1594. doi: 10.2174/138920112800784772. [DOI] [PubMed] [Google Scholar]
- 43.Labrie V, Lipina T, Roder JC. Mice with reduced NMDA receptor glycine affinity model some of the negative and cognitive symptoms of schizophrenia. Psychopharmacology. 2008;200:217–230. doi: 10.1007/s00213-008-1196-6. [DOI] [PubMed] [Google Scholar]
- 44.Nikiforuk A, Kos T, Rafa D, Behl B, Bespalov A, Popik P. Blockade of glycine transporter 1 by SSR-504734 promotes cognitive flexibility in glycine/NMDA receptor-dependent manner. Neuropharmacology. 2011;61:262–267. doi: 10.1016/j.neuropharm.2011.04.010. [DOI] [PubMed] [Google Scholar]
- 45.Aguzzi A, Barres BA, Bennett ML. Microglia: scapegoat, saboteur, or something else? Science. 2013;339:156–161. doi: 10.1126/science.1227901. [DOI] [PMC free article] [PubMed] [Google Scholar]
- 46.Sloan SA, Barres BA. Mechanisms of astrocyte development and their contributions to neurodevelopmental disorders. Curr Opin Neurobiol. 2014;27:75–81. doi: 10.1016/j.conb.2014.03.005. [DOI] [PMC free article] [PubMed] [Google Scholar]
- 47.Suhre K, Shin SY, Petersen AK, Mohney RP, Meredith D, Wagele B, et al. Human metabolic individuality in biomedical and pharmaceutical research. Nature. 2011;477:54–60. doi: 10.1038/nature10354. [DOI] [PMC free article] [PubMed] [Google Scholar]
- 48.Solovieff N, Milton JN, Hartley SW, Sherva R, Sebastiani P, Dworkis DA, et al. Fetal hemoglobin in sickle cell anemia: genome-wide association studies suggest a regulatory region in the 5′ olfactory receptor gene cluster. Blood. 2010;115:1815–1822. doi: 10.1182/blood-2009-08-239517. [DOI] [PMC free article] [PubMed] [Google Scholar]
- 49.Shin SY, Fauman EB, Petersen AK, Krumsiek J, Santos R, Huang J, et al. An atlas of genetic influences on human blood metabolites. Nat Genet. 2014;46:543–550. doi: 10.1038/ng.2982. [DOI] [PMC free article] [PubMed] [Google Scholar]
Associated Data
This section collects any data citations, data availability statements, or supplementary materials included in this article.