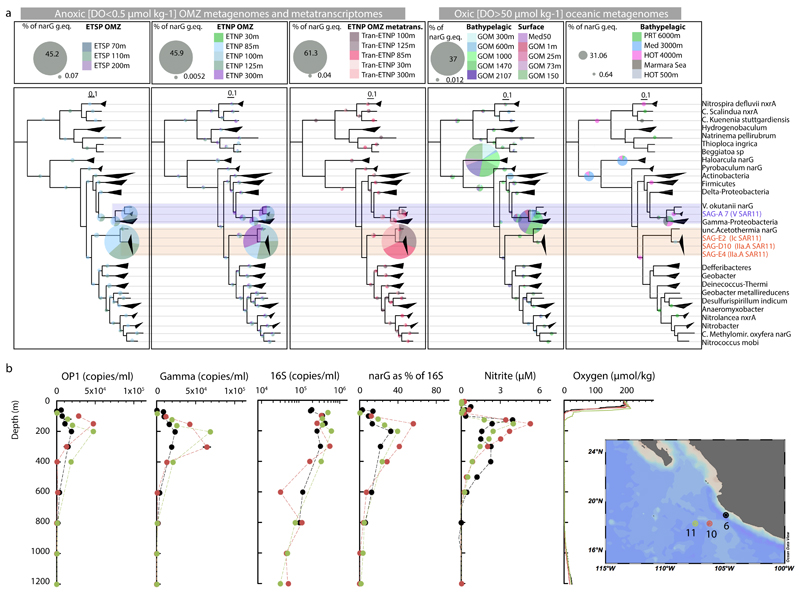
Extended Data Figure 6. Relative abundance of narG variants in ETNP OMZ metagenomes and metatranscriptomes and various other ocean metagenomes.
a, Relative abundance and diversity of NarG/NxrA enzymes as revealed by phylogenetic placement of identified narG metagenomic reads (colored pies). All identified short metagenomic narG reads from various oceanic metagenomes were placed within a reconstructed reference NarG tree in order to estimate the abundance of the different narG variants. The results of the placement are presented in 5 separate trees, based on the origin of the analyzed metagenomic reads (ETSP metagenomes, ETNP metagenomes and metatranscriptomes, oxic bathypelagic and oxic surface metagenomes) for clarity. In each of the 5 trees, the colored pies represent the abundance (normalized for dataset size) of the short metagenomic reads clustering in the respective node. Specifically, the pie radius reflects read abundance as a percentage of the total narG genome equivalents identified (i.e., number of narG reads compared to number of rpoB reads, normalized for gene length and total number of reads in each metagenome), with the size of grey pies in the legends representing the highest and lowest relative abundance, respectively. The reference tree is the same as in Figure 3a. Scale bars represent substitutions per amino acid. Notice that the two narG variants affiliated with the SAR11 SAGs (highlighted in orange for the OP1 type and blue for the Gamma type) are only abundant in the metagenomes and metatranscriptomes from the OMZ, where they comprise more than 70% of the total narG read pool, as can also be observed in Figure 3b and c. The number of narG reads of the OP1 or Gamma type are also given in Supplementary Table 1. b, qPCR-based abundance of SAR11 affiliated narG genes in the ETNP OMZ relative to nitrite, nitrate, and oxygen concentrations OMZ and qPCR-based counts of 16S rRNA. Counts of total bacterial 16S rRNA, OP1-type narG, and Gamma-type narG genes at three stations (map on legend) west of Manzanillo, Mexico in May 2014. Map was created with Ocean Data View (Schlitzer, R., odv.awi.de, 2015). All assays were performed in triplicates, and the bars represent standard errors. Note: counts of OP1 and Gamma-type narG variants are likely underestimates given the observed microdiversity in the community (Extended Data Fig. 2 and 7), and therefore the possibility that our primers did not match all OP1 and Gamma-type variants.

