Abstract
The mechanical properties of tissues can provide valuable information about tissue integrity and health and can assist in detecting and monitoring the progression of diseases such as keratoconus. Optical coherence elastography (OCE) is a rapidly emerging technique, which can assess localized mechanical contrast in tissues with micrometer spatial resolution. In this work we present a noncontact method of optical coherence elastography to evaluate the changes in the mechanical properties of the cornea after UV-induced collagen cross-linking. A focused air-pulse induced a low amplitude (μm scale) elastic wave, which then propagated radially and was imaged in three dimensions by a phase-stabilized swept source optical coherence tomography (PhS-SSOCT) system. The elastic wave velocity was translated to Young’s modulus in agar phantoms of various concentrations. Additionally, the speed of the elastic wave significantly changed in porcine cornea before and after UV-induced corneal collagen cross-linking (CXL). Moreover, different layers of the cornea, such as the anterior stroma, posterior stroma, and inner region, could be discerned from the phase velocities of the elastic wave. Therefore, because of noncontact excitation and imaging, this method may be useful for in vivo detection of ocular diseases such as keratoconus and evaluation of therapeutic interventions such as CXL.
Index Terms: Biomechanical properties, cornea, elasticity, optical coherence elastography
I. Introduction
ASSESSING the biomechanical properties of tissues can provide valuable information for detecting the onset and progression of several diseases such as fibrosis [1], atherosclerosis [2], and cancer [3]. Various elastographic techniques have been developed to achieve this task, such as magnetic resonance elastography (MRE) [4] and ultrasound elastography (USE) [5]. MRE and USE utilize the corresponding imaging modality (MRI and US, respectively) to measure externally induced displacements. By combining these measurements with mechanical models, tissue biomechanical properties can be quantitatively characterized. MRE and USE have proven to be extremely valuable in many clinical applications, such as for detecting liver [1] and thyroid [6] diseases. However, MRE and USE cannot provide micrometer scale mechanical contrast and require large displacements to produce a detectable signal. These limitations restrict their use in applications of small and thin samples such as the cornea and ocular sclera.
The cornea is a critical component of vision because it provides approximately 2/3 of the refracting power of the whole eye [7]. Diseases such as keratoconus [8] and corresponding therapeutic interventions, such as UV-induced collagen cross-linking (CXL) [9] and Laser-Assisted in situ Keratomileusis (LASIK) surgery [10], can change the biomechanical properties of the cornea, resulting in a reduction of vision quality. UV-induced collagen cross-linking is an emerging treatment, which increases the stiffness of the cornea to prevent or significantly slow further degradation from diseases such as keratoconus [11]. Currently, the standard CXL treatment is not customized for individual cases. An optimal CXL treatment would account for preexisting biomechanical properties as well as the changes in elasticity induced by the CXL treatment itself.
Assessing the biomechanical properties of the cornea can significantly improve the detection and severity classification of corneal degeneration caused by several diseases such as keratoconus [12]. Characterizing corneal biomechanical properties has led to the development of adaptive biomechanical modeling for optimization of individual laser ablation procedures [13] and management of CXL therapies [14]. Therefore, a noninvasive method, which can rapidly and quantitatively characterize the biomechanical properties of the cornea with micrometer scale spatial resolution would provide valuable insight into the changes to the cornea caused by diseases and therapeutic procedures and could provide critical information for the selection and timing of therapies.
Several techniques have been proposed to study the biomechanical properties of the cornea. Commercially available devices such as the Optical Response Analyzer (ORA) [15] and CorVis [16] can provide information about the mechanical response of the cornea to an air puff. However, these devices generate large-amplitude deformations, which may induce nonlinear responses, making accurate quantification of biomechanical parameters such as Young’s modulus difficult. Furthermore, the large amplitude displacements limit these techniques from characterizing the elasticity of the cornea with high spatial resolution, which can be useful for topographical mapping of the elastic properties of the cornea, such as during selective CXL treatments [17].
Brillouin microscopy is a noninvasive optical technique capable of providing a depth-resolved map of elasticity distribution of the cornea with micrometer scale spatial resolution [18],[19]. Brillouin microscopy has been utilized to study the depth-resolved micro-scale Brillouin shift of the human cornea in vivo [20], the effects of CXL on ex vivo porcine corneas [21], and the effects of keratoconus on the elasticity of human corneal buttons [22]. However, obtaining accurate quantitative measurements of elasticity from the Brillouin shift is still a challenge.
Optical coherence tomography (OCT) is a low coherence interferometric imaging technique, which provides images with micrometer scale spatial resolution [23]. While OCT has limited depth penetration of a few millimeters in scattering media such as tissue, imaging depth is not an issue for the majority of ophthalmological applications due to the relatively high transparency of the eye. Thus, OCT is rapidly becoming a staple in ophthalmology due to its noninvasive nature, rapid imaging speed, and high spatial resolutions in 3D [24],[25]. Recent developments in OCT source hardware such as Fourier Domain Mode Locked (FDML) lasers [26],[27], parallel scanning and acquisition techniques [28], and graphics processing unit (GPU) accelerated software [29] have enabled real-time video-rate 3D imaging.
OCT-based elastography, termed optical coherence elastography (OCE) [30], is specifically suitable for obtaining the biomechanical properties of ocular tissues with high spatial and temporal resolution [31]–[34]. Initially, OCE was used to measure the displacement amplitude after static compression loading of the cornea [35]. Ex vivo human corneas in the whole eye-globe configuration were compressed by a standard clinical gonioscopy lens that made contact with anterior surface of cornea. Using 2D cross-correlation of the OCT structural images, an elastogram based on the displacement amplitude was generated. The axial and lateral displacements were used to determine the heterogeneous mechanical properties within the stroma of the cornea. However, significant artifacts were generated when mapping the corneal biomechanical properties due to uneven distribution of compression stress due to non-uniform contact between the gonioscopy lens and the cornea. This technique was further utilized to investigate the effects of hydration and CXL on human corneas [36] and to characterize the changes in the biomechanical properties of rabbit corneas before and after various CXL techniques [37],[38]. While contact-based methods have provided valuable information about the mechanical properties of the cornea, noncontact excitation methods are preferable for minimizing patient discomfort in clinical ocular applications.
Consequently, OCE has been combined with noncontact air-puff excitation, similar to the ORA and CorVis, in an attempt to characterize the mechanical properties of the cornea. Quantitative parameters obtained from these spatio-temporally resolved deformations were used to characterize the biomechanical properties of human corneas in vivo [39]. Dorronsoro et al. investigated the use of air-puff OCE to detect changes in the mechanical properties of the cornea before and after CXL treatment of ex vivo porcine corneas in the whole eye-globe configuration [40]. However, due to the large displacement amplitude, these methods lacked the ability to spatially resolve the mechanical properties.
By reducing the amplitude of the excitation, the localized biomechanical properties of the cornea can be obtained by utilizing phase-sensitive OCT signal detection. Analyzing the phase of the complex OCT signal provides nanometer-scale displacement sensitivity [41], which has enabled ultra-sensitive OCE measurements [42]. Various contact and noncontact methods of stimulation have been utilized to induce micron or sub-micron scale displacements in the cornea [43]–[51]. For example, Li et al utilized a 532 nm pulsed laser to photothermally induce a surface acoustic wave which was imaged by a phase-sensitive OCE system, and this noncontact all optical method provided a quantitative assessment of Young’s modulus based on the velocity of the surface acoustic wave [44]. Manapuram et al investigated a contact-based phase-sensitive OCE method in vivo by utilizing a wire tip with a contact area of ~0.6 mm2 to study the elastic wave velocity and amplitude damping in mouse corneas to quantify how corneal stiffness increases with age [46]. Kling et al utilized sound to vibrate corneas and generated a map of the resonant frequency of the eye globe. By combining the resonant OCE measurements with numerical modeling, the elasticity of the various parts of the eye, including the cornea before and after CXL, was quantified [43].
In order to induce small amplitude displacements in the cornea by noncontact loading, we have developed a focused micro air-pulse stimulation technique capable of delivering a short duration pulse (≤1 ms) with adjustable pressure [52]. This excitation method has been used in combination with OCE to study the stiffness of the murine cornea in vivo [50] and for spatially mapping the elasticity of ex vivo rabbit corneas after CXL [17],[53]. This method was further developed by synchronizing the air-pulse stimulation with the OCT system, allowing for depth-resolved visualization and analysis of the elastic wave propagation in the cornea at a high equivalent frame rate [48]. The group velocity of the air-pulse induced elastic wave was used to quantify the Young’s modulus [45], and spectral analysis revealed the depth-wise micro-scale elasticity distribution of the various layers of the cornea [51]. Furthermore, the phase velocities obtained over the bandwidth of the air-pulse excitation were used in conjunction with a modified Rayleigh-Lamb Frequency Equation (RFLE) to provide a more robust assessment of corneal viscoelasticity [54] as compared to Young’s modulus quantifications based solely on the group velocity [55]. While these techniques have provided valuable information about the biomechanical properties of the cornea, they were predominantly focused on unidirectional investigations. It is well understood that the corneal mechanical properties are not homogeneous or isotropic [19],[56],[57]. Therefore, nidirectional assessments provide incomplete information about the biomechanical properties of the cornea.
In this study we have utilized a phase-stabilized swept source OCE (PhS-SSOCE) system, which was comprised of a phase-stabilized swept source OCT (PhS-SSOCT) system [58] and a focused air-pulse delivery device [52], to quantify the elasticity of agar phantoms and a porcine cornea before and after CXL in multiple radial directions. Because of the sub-micrometer scale displacement sensitivity of PhS-SSOCE, the focused air-pulse induced displacement amplitude was minimal (≤ 10 μm). The small force required to induce the displacements ensured that the structure and function of the delicate corneal tissue was preserved. The combination of noncontact air-pulse excitation and PhS-SSOCE measurement is potentially useful for studying the biomechanical properties of the cornea and other ocular tissues in vivo.
II. Materials and Methods
A. OCE Experimental Setup
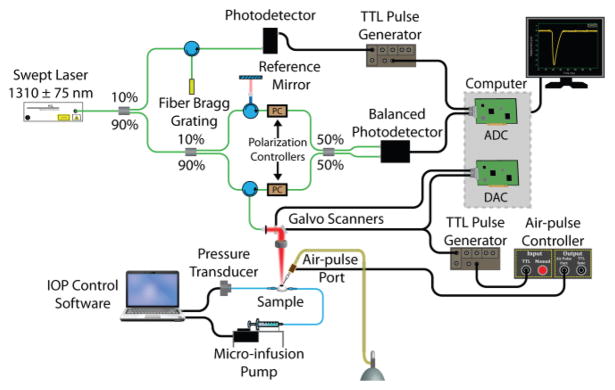
The PhS-SSOCE system was comprised of two primary subsystems: a home-built PhS-SSOCT system [58] and a focused air-pulse delivery device [52]. A schematic of the PhS-SSOCE experimental setup during the ocular experiments is shown in Fig. 1. The PhS-SSOCT system was composed of a broadband swept source laser (HSL2000, Santec, Inc., Torrance, CA) with a central wavelength of ~1310 nm, scan range of ~150 nm, A-scan rate of 30 kHz, and output power of ~36 mW. The output light was split into the imaging interferometer and a fiber-Bragg grating, which was utilized for A-scan triggering and phase stabilization. The interferometer was comprised of two arms: a reference arm and a sample arm. The OCT probe beam at the sample arm was scanned in two dimensions by a pair of galvanometer-controlled mirrors. The backscattered light from the sample arm was combined with the reflected light from the reference arm, and the subsequent interference pattern was detected by a balanced photodetector. An analog-to-digital converter (ADC) digitized the fringe, which was resampled into linear k-space. A single depth-resolved A-line was obtained by performing an FFT on the linear k-spaced fringe. The axial resolution of the OCT system was ~11 μm in air as calculated from point spread function of intensity peak from a mirror image, and the lateral resolution was ~16 μm as determined from an image of a US Air Force resolution target. The phase stability of the system was measured as ~16 milliradians, which corresponded to ~3 nm in air.
Fig. 1.
PhS-SSOCE experimental setup for ocular samples. ADC: analog-to-digital converter. DAC: digital-to-analog converter.
The home-built focused air-pulse delivery system induced the elastic waves in the samples by delivering a short duration (≤1 ms) air-pulse to the surface of the sample, which then propagated as an elastic wave [52]. The air-pulse delivery system was comprised of an electronic solenoid controlled air-pulse port and controller. The air source pressure was controlled from the air supply by a standard pressure gauge. The air-pulse was expelled through a cannula port with an inner diameter of ~150 μm and a flat edge. The air-pulse port was positioned precisely using a 3D micromanipulator. The port had an incidence angle of ~30° and was kept ~350 μm from the surface of the samples.
B. OCE Data Acquisition
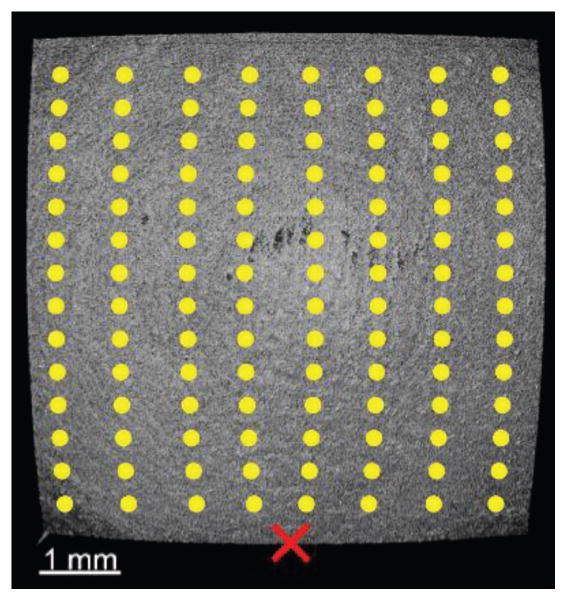
A 2D grid of M-mode scans (M-B mode) was captured as shown in Fig. 2. The acquisition grid was 101×101 points (7.2×6.1 mm) for the agar samples, and 51×51 points (8.3×6.1 mm) for the corneal samples. To ensure that the entire elastic wave propagation was captured, each M-mode acquisition consisted of 3000 A-lines, which corresponded to 100 ms (resulting in ~15 min total acquisition time for cornea). By synchronizing the M-mode frame trigger with the air-pulse delivery device, the OCT system effectively imaged the elastic wave propagation by utilizing phase information of the complex OCT signal [48],[59]. Phase data from the intensity values that were above 5 dB from the noise floor were used to track the displacements. The air-pulse port was aligned along the central longitudinal axis to provide an unobstructed 180º view of the elastic wave propagation.
Fig. 2.
En-face image of porcine cornea as imaged by the PhS-SSOCT system. The yellow dots are examples of the OCE measurement positions, the red “X” represents the air-pulse excitation location, and the center of the image is the apex of the cornea.
C. OCE Data Processing and Reconstruction
The OCT structural image was utilized to locate the sample surface for correction due to surface motion and refractive index mismatch between air and the sample [60]. The raw unwrapped vertical temporal phase profiles, φ(t), were converted into displacement profiles for the surface of the sample by [61]
| (1) |
and by
| (2) |
for inside the sample, where λ0 was the central wavelength of the OCT system and nsample was the refractive index of the sample (nsample = 1.35 for the agar phantoms and nsample = 1.376 [62] for the cornea). Phase unwrapping was performed by the in-built unwrap command in MATLAB with a phase shift tolerance of pi.
D. Velocity Calculations
For each sample, the elastic wave group velocity was calculated depth-wise for each possible radial angle originating at the excitation position. For a given depth and given OCE measurement position, cross-correlation was performed between normalized displacement profiles from that given position and a location near the excitation. The elastic wave propagation time delay was then obtained from the maximum of the resulting cross-correlation. The time delays were then linearly fitted to the corresponding propagation distances to obtain the elastic wave propagation velocity [63]. This procedure was then repeated for each depth and angle. During all calculations, the real propagation distances, as determined from the structural OCT image, were used to ensure accuracy of the elastic wave velocity calculation. This process was repeated for each imaged in-depth layer and also repeated for each radial angle.
The Young’s modulus was quantified by [33],[34],[45],[52],[55],[64]
| (3) |
where ρ was the density of the material (ρ=1000 kg/m3 for the agar phantoms and ρ=1062 kg/m3 for the cornea [65]), ν=0.49 was the Poisson’s ratio to account for the nearly incompressible nature of the phantoms and corneas [66], and cg was the elastic wave group velocity. Spectral analysis was utilized to provide depth-resolved elasticity mapping [51]. For each in-depth layer for all radial directions, an FFT was performed on the temporal phase profiles at each OCE measurement position to obtain a phase shift, Δθ, for each FFT frequency bin. The phase velocity, cp(f), at frequency, f, was obtained by linear fitting the phase shifts to the corresponding distances of the OCE measurement positions by cp(f)=2πfΔr/Δθ.
E. OCE Validation on Tissue-Mimicking Phantoms
Homogeneous tissue-mimicking phantoms (1% and 2%, w/w) were prepared by standard methods from powdered agar (AG110, Spectrum Chemical Manufacturing Corp., Gardena, CA). The agar phantoms were cast in standard culture dishes, with diameter of 50 mm and height of 11 mm. The phantoms were then refrigerated for 2 hours at 4ºC. Special care was taken to ensure no bubbles were formed. Before the OCE measurements, the phantoms were allowed to come to room temperature. During the OCE measurements, the agar phantoms were kept in their molds and excess water was removed from the surface. All OCE measurements were taken in the central region of the sample to minimize the influence of the boundaries. The agar phantoms were also tilted to reduce the presence of specular reflections and subsequent saturation artifacts.
To test the validity of the OCE technique on the agar phantoms, uniaxial mechanical testing (Model 5943, Instron Corp., MA, USA) was performed on the same phantoms immediately after the OCE experiments were concluded. The agar phantoms were pre-loaded with 0.04 N and compressed at a rate of 2 mm/min. Compression was stopped at strain=0.2 and the Young’s modulus was calculated automatically by the instrument software.
F. Porcine Cornea Samples
Whole juvenile porcine eyes were obtained fresh from Sioux-Preme Packing Co. (Sioux Center, IA). Extraneous tissues such as the epithelium and ocular muscles were removed before the samples were imaged. The porcine eye was placed in a custom-made eye holder in the whole eye-globe configuration during all OCE experiments. The eye holder had two holes to accommodate cannulation needles, which were used for artificial intraocular pressure (IOP) control [53]. One needle was connected via tubing to a pressure transducer, and the other needle was connected via tubing to a micro-infusion pump. The pressure transducer and pump formed the closed-loop artificial IOP control system, and a physiological IOP of 15 mmHg was maintained during all OCE experiments [49].
Riboflavin/UV-A corneal cross-linking (CXL) was performed as described in our previous work [53]. Briefly, a 0.1% riboflavin solution in 0.9% phosphate buffered saline without Dextran was applied to the corneal surface every 5 minutes for 30 minutes. After hydration, the cornea was irradiated by ultraviolet light (365 nm, 7 mm beam diameter, 3 mW/cm2 intensity) for 30 minutes. The riboflavin solution was reapplied every 5 minutes during the CXL irradiation process. Immediately after the CXL procedure was completed, the OCE measurements were repeated.
III. Results
A. Agar Phantoms
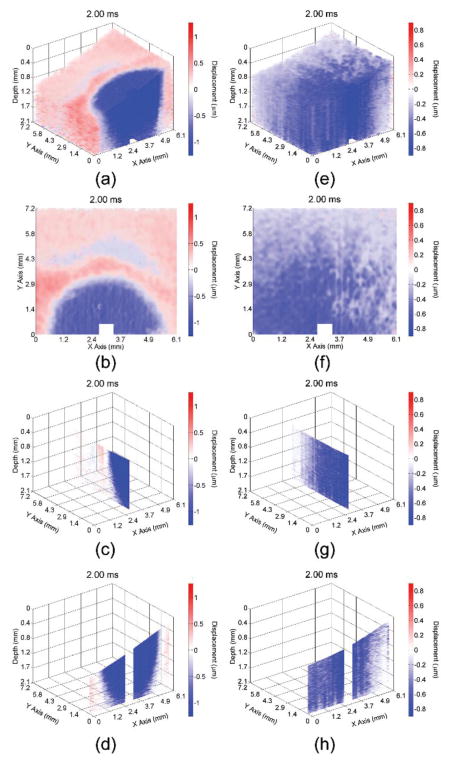
Video 1 shows the propagation of the elastic wave at 1000× slower than actual speed in the 1% (left) and 2% (right) agar phantoms with various views (3D, en-face, single plane aligned with the excitation, and single transverse plane near the excitation). Multiple views of the elastic wave propagating through the (a–d) 1% and (e–h) 2% phantoms at 2 ms after excitation are illustrated in Fig. 3. From the wavefront (shown by the shift between red and blue), the elastic wave propagated ~3 mm in the 1% agar phantom and greater than 7.2 mm (beyond the imaging field of view) in the 2% agar phantom. Please note that the color scales are not identical as the elastic wave amplitude was smaller in the 2% phantom as compared to the 1% phantom, and that the phase data immediately proximal to the excitation was removed due to phase unwrapping errors.
Fig. 3.
Propagation of the elastic wave in the 1% (a–d) and 2% (e–h) agar phantoms. Multiple views are shown, corresponding to a (a,e) 3D, (b,f) enface, (c,g) single longitudinal plane aligned with the excitation, and (d,h) single transverse plane near the excitation.
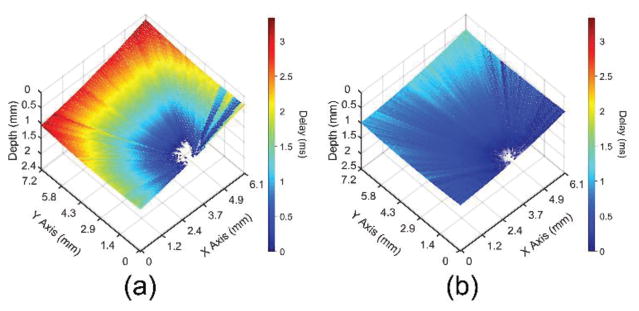
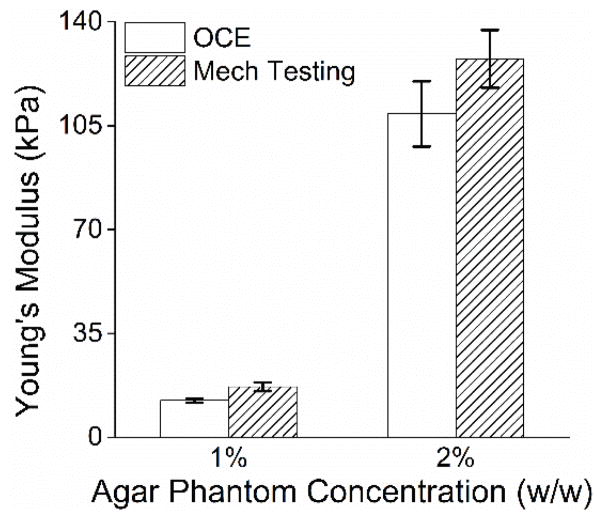
The elastic wave propagation time delay maps from a selected imaged in-depth layer for the 1% and 2% agar phantom are shown in Fig. 4. The color axes for the wave propagation delays are the same to provide a direct comparison between the elastic wave propagation delays in the 2% phantom as compared to the 1% phantom. From the wavefront, it can be seen that the elastic wave took ~3 ms to propagate ~7 mm in the 1% phantom, but took ~1 ms to propagate the same distance in the 2% phantom. Fig. 5 plots the depth-wise means of the elastic wave velocity for each radial angle for the 1% and 2% agar phantoms. The elastic wave group velocity was faster in the 2% phantom as compared to the 1% phantom, where the angle-wise mean group velocity in the 1% phantom was 1.9±0.1 m/s and was 5.8±0.3 m/s in the 2% phantom. Using (3), the Young’s modulus of the phantoms is plotted for each angle in Fig. 6. The mean elasticity as measured by OCE of the 1% and 2% agar phantoms was 12.4±0.7 kPa and 109.7±11.0 kPa, respectively. The elasticity of the agar phantoms measured by uniaxial mechanical testing was 17.5±1.5 kPa for the 1% phantom and 127.5±9.7 kPa for the 2% phantom. A comparison of the elasticity as assessed by OCE and as measured by mechanical testing is plotted in Fig. 7.
Fig. 4.
Elastic wave propagation delay map for a selected depth layer for the (a) 1% and (b) 2% agar phantoms with the same color scale.
Fig. 5.
Elastic wave velocity as a function of propagation angle for the (a) 1% and (b) 2% agar phantoms as compared to the mean from all angles for that sample.
Fig. 6.
Young’s modulus quantified by (3) as a function of propagation angle for the (a) 1% and (b) 2% agar phantoms as compared to the mean from all angles for that sample.
Fig. 7.
Elasticity of the agar phantoms as measured by OCE (n=151 propagation angles and averaged from all angles) and as measured by uniaxial mechanical testing (n=3 samples). The error bars for OCE indicate inter-angle standard deviation, and the error bars for mechanical testing indicate inter-sample standard deviation.
B. Porcine Corneas
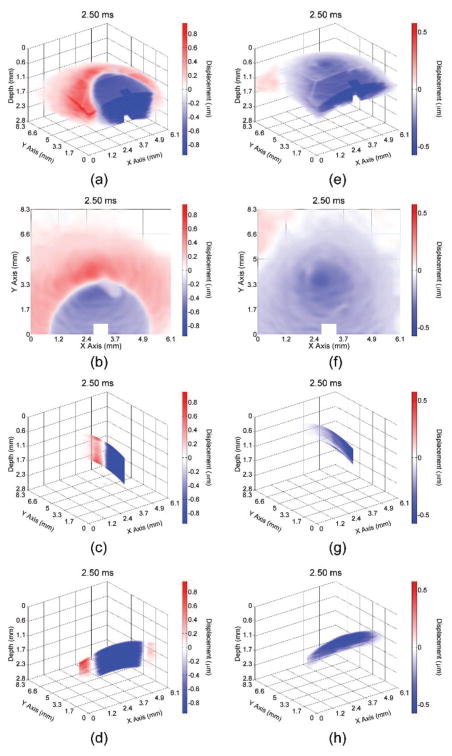
Video 2 shows the elastic wave propagating through the porcine cornea before (left) and after (right) CXL treatment with different views (3D, en-face, single longitudinal plane aligned with the excitation, and single transverse plane near the excitation) at 1000× slower than the actual speed. From the wavefront (shown by the boundary between the red and blue), it can be seen that the elastic wave propagated ~3.3 mm in the untreated cornea at 2.5 ms after excitation. In contrast, the elastic wave propagated ~8.3 mm in the cornea after the CXL treatment, demonstrating that the elastic wave is significantly faster in the CXL cornea. Fig. 8 shows the elastic wave propagation in the (a–d) untreated and (e–h) CXL porcine cornea 2.5 ms after excitation. Please note that the color scales are not the same because the elastic wave amplitude was smaller in the cornea after CXL. Similar to the agar phantoms, the phase data near the excitation was removed due to phase unwrapping errors.
Fig. 8.
Propagation of the elastic wave in the porcine cornea (a–d) before and (e–h) after CXL treatment. Multiple views are shown, corresponding to a (a,e) 3D, (b,f) en-face, (c,g) single longitudinal plane aligned with the excitation, and (d,h) single transverse plane near the excitation.
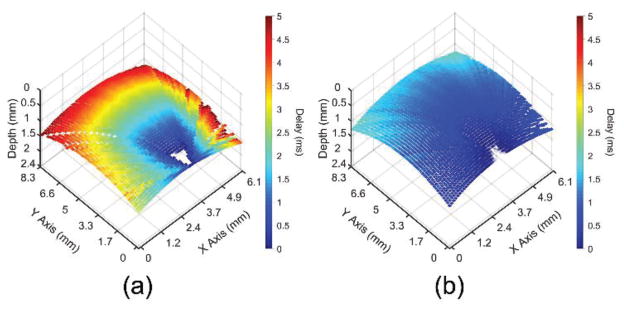
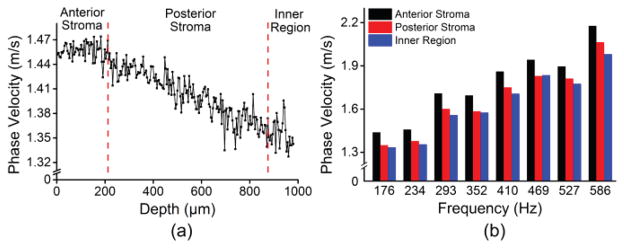
The elastic wave propagation delay maps obtained by cross-correlation analysis for a selected imaged depth layer of the porcine cornea before and after CXL are shown in Fig. 9 The velocity of the elastic wave at each radial angle is plotted in Fig. 10. The angle-wise mean of the elastic wave velocity was 1.3±0.1 m/s before the CXL treatment and 3.5±0.1 m/s after the CXL treatment. Fig. 11 shows the Young’s modulus versus propagation angle for the porcine cornea (a) before and (b) after CXL. The Young’s modulus of the porcine cornea as quantified by (3) was 5.9±0.6 kPa and 43.9±3.5 kPa before and after the CXL treatment, respectively. Utilizing the phase velocities, three major regions of the cornea could be discerned: anterior stroma, posterior stroma, and inner region, as plotted in Fig. 12. Fig. 12(a) shows the phase velocity at 234 Hz versus depth in the porcine cornea and the three major discernable regions. Fig 12(b) shows the phase velocities of the untreated porcine cornea for the three regions at selected frequencies corresponding to the predominant spectral components of the elastic wave.
Fig. 9.
Elastic wave propagation delay map for a single depth layer of the porcine cornea (a) before and (b) after CXL treatment with the same color scale.
Fig. 10.
Elastic wave velocity as a function of propagation angle for the porcine cornea (a) before and (b) after CXL treatment as compared to the mean from all angles for that sample.
Fig. 11.
Young’s modulus quantified by (3) as a function of propagation angle for the cornea (a) before and (b) after CXL treatment as compared to the mean from all angles for that sample.
Fig. 12.
(a) Depth-wise phase velocities of the elastic wave at 234 Hz for a single radial angle. (b) Phase velocities over a span of frequencies corresponding to the predominant spectral components of the elastic wave in the cornea for each discernable region of the porcine cornea.
IV. Discussion
In this work, we have shown a noncontact method of OCE by imaging the propagation of an elastic wave in radial directions. The group velocity of the elastic wave was utilized to quantify Young’s modulus in tissue-mimicking phantoms of various concentrations. Depth-resolved characterization of elastic wave was obtained via spectral analysis in ex vivo porcine cornea in the whole eye globe configuration before and after CXL. The results show that PhS-SSOCE is capable of quantifying the changes in the elasticity of the cornea after CXL and characterizing the micro-scale depth-resolved elasticity distribution of the porcine cornea.
The sensitivity of the method for Young modulus calculations relies on the OCE ability to resolve small changes in the elastic wave velocity. Specifically, the smallest Young’s modulus this method can resolve is governed by minimum wave velocity that could be measured and it depends on how long the frame data could be acquired. The highest stiffness that the system can measure is, however, affected by the A-scan rate, the range of OCT B-mode image acquisition, and elastic wave propagation distance. Thus, assuming an elastic wave propagation distance of 6 mm, a sample material density of 1062 kg/m3 [65], and a Poisson’s ratio of 0.49 for cornea, the dynamic range of the Young’s modulus will be ~17 Pa to ~6 MPa for these measurements. However, there is a tradeoff between acquisition time and dynamic range of the measurements due to M-B mode imaging. The accuracy of the Young’s modulus quantification depends on SNR of the system and OCT image, temporal resolution of the system, and displacement amplitude. For example, as shown in Figs. 5–7, increase on the elastic wave velocity decreased number of data points available for quantification of its velocity (due to fixed temporal resolution of the system) thus decreasing the accuracy. Again, improving the frame rate of OCT system, reducing phase noise, and increasing amplitude of deformations will increase the accuracy of the Young’s modulus quantification.
In this work, an air-pulse stimulation was required for each OCE measurement position to image the elastic wave propagation in multiple radial directions. However, due to the small pressure required to induce the displacements (~4 Pa), the corneas incurred no detectable damage, but a notable downside was the extended acquisition time. Further optimization of the acquisition software would enable an acquisition time of less than 10 milliseconds for each OCE measurement position, but would still require an excitation for each OCE measurement position, which results in an intrinsic tradeoff between lateral spatial resolution and acquisition time.
The described technique of M-B mode of signal acquisition results in relatively long measurements times to quantify elastic wave velocity in multiple radial directions (up to 15 min in cornea samples). Recently, we have introduced a phase-sensitive OCE technique at a ~1.5 MHz A-scan rate where only a single stimulation was required [67]. The elastic wave was directly imaged in tissue-mimicking phantoms and an ex vivo porcine cornea at various IOPs in the whole eye-globe configuration, and the total acquisition time was only ~30 ms. Here, successive B-scans were acquired over a region (B-M mode) to obtain elasticity assessment in a single direction. By extrapolating the B-M scanning to image the elastic wave propagation in radial directions, performing spectral analysis, and utilizing GPU accelerated OCE [68], a 3D elastogram could be generated in less than a second.
Other methods of excitation such as acoustic radiation force loading or mechanical stimulation could be utilized to produce harmonic waves of adjustable wavelength, increasing the spatial elasticity resolution [59],[69]. However, for clinical ocular applications of OCE, noncontact excitation methods would be preferable as they minimize patient discomfort.
The results shown in Fig. 7 demonstrate that the elasticity of the agar phantoms was underestimated by equation (3) as compared to mechanical testing. This may be due to the fact that equation (3) relies on a half-infinite depth assumption [70],[71]. The elastic wave velocity should be slower in a thin plate as compared to infinite half-space, resulting in an underestimation of elasticity as compared to mechanical testing. The phantom thickness was 11 mm, which does not strictly satisfy the infinite depth restriction. Nevertheless, equation (3) was still able to provide a rapid first order elasticity approximation of tissue-mimicking agar phantoms with reasonable error. However, the geometry and boundary conditions for the cornea might further deviate from these requirements and more robust mechanical models are required to correctly quantify its elasticity.
In addition to changes in elasticity, the corneal thickness shrank from ~1 mm before the CXL treatment to ~0.6 mm after the CXL treatment. We have recently demonstrated using finite element modeling (FEM) coupled with OCE experiments that the group velocity changes with change in thickness, when all other parameters are kept constant [66]. Therefore, the effects of thickness on the measured elasticity will need to be decoupled or integrated in order to obtain an accurate elasticity assessment of the cornea.
We have previously developed a method of obtaining the viscoelasticity of the cornea by utilizing a modified Rayleigh Lamb Frequency Equation (RLFE), which was adjusted to include the effects of the solid-fluid boundary at the corneal posterior surface [54]. While this model incorporated the thickness of the cornea, it neglected the curvature of the cornea by assuming the cornea was a thin plate in infinite half-space. Most recently, we have also demonstrated that the curvature of the cornea can affect the measured group velocity [66]. As the phase velocities are merely spectral decompositions of the group velocity, the phase velocities would similarly be affected. Developing a robust model, which can incorporate the true geometry of the cornea, is the subject of our current investigation.
The stress-strain curve for the agar phantoms has a characteristic non-linear “J” shape [55]. Therefore, the elasticity will vary depending on which strain is chosen to calculate Young’s modulus. To test this, we have calculated the stiffness of the agar samples at various strains (0.01, 0.05, 0.1, and automatically provided by the instrument software, data not shown). The Young’s moduli that were provided automatically by the instrument (17.5±1.5 kPa and 127.5±9.7 kPa for the 1% and 2% phantoms, respectively) were similar to the measurements at strain=0.1. However, the range of Young’s moduli over the aforementioned strains were quite large. For example, the mean Young’s moduli at strain=0.01 were 13.7±8.1 kPa and 29±8.7 kPa for the 1% and 2% phantoms, respectively. In contrast, at strain=0.1, the Young’s moduli for the 1% and 2% phantoms were 27.3±8.5 kPa and 122.5±0.7 kPa, respectively. Our previous work has shown that (3) underestimates the elasticity of agar phantoms when compared to measurements provided by uniaxial mechanical testing [55]. Similar to the agar phantoms, the cornea also has non-linear biomechanical properties [11],[72],[73]. Consequently, the values for the Young’s modulus of the cornea reported in the literature span a wide range–from less than 1 kPa to greater than 1 MPa depending on the measurement method and the test conditions [11],[72],[73],[74].
The small variation in measured elastic wave velocities between the anterior and posterior cornea as measured by OCE in situ (Fig. 12) is similar to in situ measurements made by Brillouin spectroscopy [19]–[22]. Direct mechanical testing of different isolated layers of the cornea has shown that there is a large variation in mechanical properties between the anterior and posterior sections of the cornea [75],[76]. However, mechanical tests cannot be directly compared to the presented in situ tests as, for example, the “equivalent” IOP during uniaxial mechanical test is significantly higher [77].
Quantitative depth-resolved elasticity maps of the cornea currently could not be obtained directly from in-depth distribution of the phase velocities. Extrapolating our previously developed modified RLFE [54] to a multi-layered geometry would produce more unknowns than equations making the system unsolvable. Development of a multi-layered model that correctly incorporates the boundary conditions between the layers of the cornea yielding depth-resolved viscoelastic quantifications is currently in progress.
The presented technique may be able to reveal the mechanical anisotropy of the cornea, which has been shown previously [56],[78],[79]. In the untreated cornea at 15 mmHg IOP, the mechanical anisotropy of the cornea was not evident using the current approach. Similarly, supersonic shear wave imaging has shown that the anisotropy of the cornea is minimal at lower IOPs, but becomes apparent once the IOP is raised above the physiological range [56]. After CXL, some elastic anisotropy can be seen. As shown in Figs. 10(b) and 11(b), the elastic wave velocity and Young’s modulus in the transverse directions are slightly larger than in the longitudinal direction. Future work will further investigate alternative methods to assess tissue anisotropy and the effects of IOP and CXL on the mechanical anisotropy of the cornea.
V. Conclusion
In this study we have shown a noncontact OCE method, which was able to image the propagation of an elastic wave in multiple radial directions. The elasticity of tissue-mimicking phantoms of various concentrations and an ex vivo porcine cornea before and after CXL treatment was quantified. The 2% tissue-mimicking agar phantom was ~9× stiffer than the 1% phantom, which was validated by uniaxial mechanical testing. The Young’s modulus of the cornea increased ~7.4× after the CXL treatment. Although depth-wise variations in elasticity of the porcine cornea could not be resolved from the group velocity, spectral analysis revealed the layers of the corneal superstructure. Due to the noncontact excitation and imaging, this method may be useful for studying the biomechanical properties of soft tissues in three dimensions in vivo.
Acknowledgments
This work was supported in part by the U.S. NIH grants 1R01EY022362, 1R01HL120140, and U54HG006348 and PRJ PRJ71TN from DOD/NAVSEA.
Biographies
 Manmohan Singh was born in New
Delhi, India in 1986. He received his B.S. degree in Biomedical Engineering from the
University of Houston in 2014. He is currently pursuing his Ph.D. in the Department
of Biomedical Engineering, also at the University of Houston. Since the fall of
2010, Manmohan has been with Dr. Kirill Larin’s Biomedical Optics
Laboratory. His research interests include utilizing biomedical imaging for the
detection and monitoring of diseases and utilizing and developing new elastographic
methods for investigating the biomechanical properties of tissues.
 Jiasong Li was born in Dalian,
China, in 1983. He received his B.S. degree in Biomedical Engineering from
Northeastern University, Shenyang, Liaoning, China, in 2007. He became a graduate
student at the Huazhong University of Science and Technology, Wuhan, Hubei, China,
in 2008. He is currently a Ph.D. candidate at the Biomedical Optics Laboratory with
the Department of Biomedical Engineering at the University of Houston. His current
research is focused on development and applications of Optical Coherence Tomography
(Elastography) systems, in which he has published more than 15 peer-reviewed journal
articles.
 Srilatha Vantipalli was born in
Visakhapatnam, Andhra Pradesh, India, in 1988. She received the B.S. degrees in
Optometry from the Birla Institute of Technology, Pilani, India in 2010 and is
currently pursuing the Ph.D. degree in Physiological Optics and Vision Science from
the University Of Houston College Of Optometry, Houston, TX, since 2011.
From 2011 to 2012, she was a Teaching Assistant with the Ophthalmic Optics and Geometric Optics Laboratory. Since 2012, she has been a Research Assistant with Dr. Michael Twa’s laboratory at the University Of Houston College Of Optometry. She is the co-author of 4 peer reviewed publications. Her research interests include biomechanical properties of the cornea, effects of corneal crosslinking, corneal ectatic disease, e.g. Keratoconus.
Ms Vantipalli was a recipient of the University of Houston Presidential Fellowship in 2012 and World Health Organization’s Scholarship for Academic Excellence in 2008 and 2009.
 Dr. Shang Wang is currently a
postdoctoral associate at Baylor College of Medicine in Houston, TX. He received his
Bachelor’s degree in Optoelectronic Information Engineering in 2010 from
Harbin Institute of Technology, China, and his Ph.D. degree in Biomedical
Engineering from the University of Houston in 2014. His research lies in the
intersection among optics, engineering, and biomedicine, focusing on the development
of functional optical imaging techniques to study the biomechanics and the dynamic
processes of tissues in several areas, including cardiovascular biology,
reproductive biology, and ophthalmology.
 Dr. Zhaolong Han was born in
Tianjin, China, in 1983. He received the B.S. and Ph.D. degrees in engineering from
Shanghai Jiao Tong University, Shanghai, China in 2005 and 2013, respectively. Since
2014, he is a post-doctoral fellow in the department of Biomedical Engineering in
University of Houston. His research interests include computational mechanics, eye
biomechanics, fluid-structure interaction, and optical coherence elastography.
 Achuth Nair was born in Anderson,
Indiana in 1993. He is working towards a B.S. degree in biomedical engineering from
the University of Houston, and is expected to graduate in the spring of 2016. He
hopes to attend medical school following graduation with the aim of becoming a
surgeon.
Achuth has been a Research Assistant at the Biomedical Optics Laboratory at the University of Houston since 2014. He is a co-author of three papers, and his research interests include OCT embryonic imaging and assessment of biomechanical properties of tissues using OCE.
 Dr. Salavat Aglyamov received the
B.S. and M.S. degrees in applied mathematics in 1991 and 1993, respectively, from
Moscow State University, Moscow, Russia. He received the Ph.D. degree in biophysics
in 1999 from the Institute of Theoretical and Experimental Biophysics, Pushchino,
Moscow region, Russia. From 2001 to 2002 he worked in the Biomedical Ultrasonics Lab
at the University of Michigan, Ann Arbor, as a postdoctoral fellow, where he was
engaged in mathematical modeling of behavior of the soft biological tissue under
externally applied loading. He is currently a research associate in the Department
of Biomedical Engineering at the University of Texas at Austin. He has authored more
than 50 peer-reviewed publications and chapters in two books. His research interests
are in the areas of tissue biomechanics, elasticity imaging, applied mathematics,
and photoacoustics.
 Dr. Michael D Twa completed a
Bachelor of Science degree in Biology at the University of California, San Diego and
received a clinical doctorate degree in Optometry from the University of California
at Berkeley in 1990. In 2006 he received a PhD in Vision Science from the Ohio State
University. From 2007 to 2014 he was on faculty at the University of Houston as an
Associate Professor in Optometry with a joint appointment in Biomedical Engineering.
Dr. Twa is currently a Professor and the Associate Dean for Research and Graduate
Studies in Optometry at the University of Alabama at Birmingham with joint
appointments in Ophthalmology and Biomedical Engineering. Dr. Twa’s research
focus is biomedical imaging and structural degeneration of tissues in ocular disease
with more than 80 peer reviewed publications that include topics in machine
learning, pattern recognition, bio-physics, signal processing, biomedical image
analysis, ocular surgery, and clinical outcomes research. Dr. Twa is a Fellow of the
American Academy of Optometry and the current Associate Editor of Optometry and
Vision Science.
 Dr. Kirill V. Larin is a Professor
of Biomedical Engineering at the University of Houston. He received his first M.S.
in Laser Physics and Mathematics from the Saratov State University (1995), his
second M.S. in Cellular Physiology and Molecular Biophysics (2001) and Ph.D. in
Biomedical Engineering (2002) from the University of Texas Medical Branch in
Galveston. Dr. Larin’s research contributions are in Biomedical Optics and
Biophotonics and development and application of various optical methods for
noninvasive and nondestructive imaging and diagnostics of tissues and cells He has
authored more than 80 peer-reviewed publications and chapters in six books on
Biomedical Optics. Dr. Larin has received numerous awards including Presidential
Award from Russian President Boris Yeltsin, Wallace Coulter Young Investigator
Translation Award, Office of Naval Research Young Investigator Award, Outstanding
Young Investigator Award from the Houston Society for Engineers in Medicine and
Biology, Herbert Allen Award from American Society for Mechanical Engineers, and UH
Research Excellence Award. He is SPIE and OSA Fellow. Dr. Larin is also Short Course
Instructor on Tissue Optics and Biophotonics for the SPIE, OSA, and IEEE.
Contributor Information
Manmohan Singh, Email: msingh@swbell.net, Department of Biomedical Engineering at the University of Houston, Houston, TX 77204 USA.
Jiasong Li, Email: songshan311@gmail.com, Department of Biomedical Engineering at the University of Houston, Houston, TX 77204 USA.
Srilatha Vantipalli, Email: srilatha.opt@gmail.com, College of Optometry at the University of Houston, Houston, TX 77204 USA.
Shang Wang, Email: wangshang1218@hotmail.com, Department of Molecular Physiology and Biophysics at Baylor College of Medicine, One Baylor Plaza, Houston, TX 77030 USA.
Zhaolong Han, Email: han.arkey@gmail.com, Department of Biomedical Engineering at the University of Houston, Houston, TX 77204 USA.
Achuth Nair, Email: achuth.md@gmail.com, Department of Biomedical Engineering at the University of Houston, Houston, TX 77004 USA.
Salavat R. Aglyamov, Email: Salavat.Aglyamov@engr.utexas.edu, Department of Biomedical Engineering, University of Texas at Austin, Austin, TX 78731 USA
Michael D. Twa, Email: mtwa@uab.edu, School of Optometry at the University of Alabama at Birmingham, Birmingham, AL 35924
Kirill V. Larin, Email: klarin@uh.edu, Department of Biomedical Engineering at the University of Houston, Houston, TX 77004 USA and and the Interdisciplinary Laboratory of Biophotonics, Tomsk State University, Tomsk 634050, Russia, phone: 832-842-8834; fax: 713-743-0226
References
- 1.Yin M, Talwalkar JA, Glaser KJ, Manduca A, Grimm RC, Rossman PJ, et al. Assessment of hepatic fibrosis with magnetic resonance elastography. Clin Gastroenterol Hepatol. 2007 Oct;5:1207–1213. doi: 10.1016/j.cgh.2007.06.012. [DOI] [PMC free article] [PubMed] [Google Scholar]
- 2.van Popele NM, Grobbee DE, Bots ML, Asmar R, Topouchian J, Reneman RS, et al. Association between arterial stiffness and atherosclerosis The Rotterdam Study. Stroke. 2001 Oct;32:454–460. doi: 10.1161/01.str.32.2.454. [DOI] [PubMed] [Google Scholar]
- 3.Cross SE, Jin YS, Rao J, Gimzewski JK. Nanomechanical analysis of cells from cancer patients. Nat Nanotechnol. 2007 Dec;2:780–783. doi: 10.1038/nnano.2007.388. [DOI] [PubMed] [Google Scholar]
- 4.Muthupillai R, Lomas DJ, Rossman PJ, Greenleaf JF, Manduca A, Ehman RL. Magnetic resonance elastography by direct visualization of propagating acoustic strain waves. Science. 1995 Sep;269:1854–1857. doi: 10.1126/science.7569924. [DOI] [PubMed] [Google Scholar]
- 5.Ophir J, Cespedes I, Ponnekanti H, Yazdi Y, Li X. Elastography: a quantitative method for imaging the elasticity of biological tissues. Ultrason Imaging. 1991 Apr;13:111–134. doi: 10.1177/016173469101300201. [DOI] [PubMed] [Google Scholar]
- 6.Lyshchik A, Higashi T, Asato R, Tanaka S, Ito J, Mai JJ, et al. Thyroid gland tumor diagnosis at US elastography 1. Radiology. 2005 Nov;237:202–211. doi: 10.1148/radiol.2363041248. [DOI] [PubMed] [Google Scholar]
- 7.Ruberti JW, Roy AS, Roberts CJ. Corneal biomechanics and biomaterials. Annu Rev Biomed Eng. 2011 Aug;13:269–295. doi: 10.1146/annurev-bioeng-070909-105243. [DOI] [PubMed] [Google Scholar]
- 8.Andreassen TT, Simonsen AH, Oxlund H. Biomechanical properties of keratoconus and normal corneas. Exp Eye Res. 1980 Oct;31:435–441. doi: 10.1016/s0014-4835(80)80027-3. [DOI] [PubMed] [Google Scholar]
- 9.Wollensak G, Spoerl E, Seiler T. Riboflavin/ultraviolet-a-induced collagen crosslinking for the treatment of keratoconus. Am J Ophthalmol. 2003 May;135:620–627. doi: 10.1016/s0002-9394(02)02220-1. [DOI] [PubMed] [Google Scholar]
- 10.Pepose JS, Feigenbaum SK, Qazi MA, Sanderson JP, Roberts CJ. Changes in corneal biomechanics and intraocular pressure following LASIK using static, dynamic, and noncontact tonometry. Am J Ophthalmol. 2007 Jan;143:39–47. doi: 10.1016/j.ajo.2006.09.036. [DOI] [PubMed] [Google Scholar]
- 11.Wollensak G, Spoerl E, Seiler T. Stress-strain measurements of human and porcine corneas after riboflavin-ultraviolet-A-induced cross-linking. J Cataract Refract Surg. 2003 Sep;29:1780–1785. doi: 10.1016/s0886-3350(03)00407-3. [DOI] [PubMed] [Google Scholar]
- 12.Edmund C. Corneal elasticity and ocular rigidity in normal and keratoconic eyes. Acta Ophthalmol (Copenh) 1988 Apr;66:134–140. doi: 10.1111/j.1755-3768.1988.tb04000.x. [DOI] [PubMed] [Google Scholar]
- 13.Probst LE. Complex cases with LASIK : advanced techniques and complication management. Thorofare, NJ: Slack Incorporated; 2000. [Google Scholar]
- 14.Spoerl E, Huhle M, Seiler T. Induction of cross-links in corneal tissue. Exp Eye Res. 1998 Jan;66:97–103. doi: 10.1006/exer.1997.0410. [DOI] [PubMed] [Google Scholar]
- 15.Tao C, Han Z, Sun Y, Zhou C, Roberts C, Zhou D, et al. Corneal hysteresis with intraocular pressure of a wide range: a test on porcine eyes. J Refract Surg. 2013 Dec;29:850–854. doi: 10.3928/1081597x-20131115-05. [DOI] [PubMed] [Google Scholar]
- 16.Han Z, Tao C, Zhou D, Sun Y, Zhou C, Ren Q, et al. Air puff induced corneal vibrations: theoretical simulations and clinical observations. J Refract Surg. 2014 Mar;30:208–213. doi: 10.3928/1081597X-20140212-02. [DOI] [PubMed] [Google Scholar]
- 17.Li J, Singh M, Vantipalli S, Han Z, Twa MD, Larin KV. Spatial mapping of the biomechanical properties of rabbit cornea after cross-linking using optical coherence elastography. Proc SPIE. 2015;9327:93270S-93270S–6. [Google Scholar]
- 18.Vaughan JM, Randall JT. Brillouin scattering, density and elastic properties of the lens and cornea of the eye. Nature. 1980 Apr;284:489–491. doi: 10.1038/284489a0. [DOI] [PubMed] [Google Scholar]
- 19.Scarcelli G, Pineda R, Yun SH. Brillouin optical microscopy for corneal biomechanics. Invest Ophthalmol Vis Sci. 2012 Jan;53:185–190. doi: 10.1167/iovs.11-8281. [DOI] [PMC free article] [PubMed] [Google Scholar]
- 20.Scarcelli G, Yun SH. In vivo Brillouin optical microscopy of the human eye. Opt Express. 2012 Apr;20:9197–9202. doi: 10.1364/OE.20.009197. [DOI] [PMC free article] [PubMed] [Google Scholar]
- 21.Scarcelli G, Kling S, Quijano E, Pineda R, Marcos S, Yun SH. Brillouin microscopy of collagen crosslinking: noncontact depth-dependent analysis of corneal elastic modulus. Invest Ophthalmol Vis Sci. 2013 Feb;54:1418–1425. doi: 10.1167/iovs.12-11387. [DOI] [PMC free article] [PubMed] [Google Scholar]
- 22.Scarcelli G, Besner S, Pineda R, Yun SH. Biomechanical characterization of keratoconus corneas ex vivo with Brillouin microscopy. Invest Ophthalmol Vis Sci. 2014 Jul;55:4490–4485. doi: 10.1167/iovs.14-14450. [DOI] [PMC free article] [PubMed] [Google Scholar]
- 23.Huang D, Swanson EA, Lin CP, Schuman JS, Stinson WG, Chang W, et al. Optical coherence tomography. Science. 1991 Nov;254:1178–1181. doi: 10.1126/science.1957169. [DOI] [PMC free article] [PubMed] [Google Scholar]
- 24.Drexler W, Fujimoto JG. Optical coherence tomography in ophthalmology. J Biomed Opt. 2007 Jul;12:041201. [Google Scholar]
- 25.Zysk AM, Nguyen FT, Oldenburg AL, Marks DL, Boppart SA. Optical coherence tomography: a review of clinical development from bench to bedside. J Biomed Opt. 2007 Sep;12:051403. doi: 10.1117/1.2793736. [DOI] [PubMed] [Google Scholar]
- 26.Huber R, Wojtkowski M, Fujimoto JG. Fourier Domain Mode Locking (FDML): A new laser operating regime and applications for optical coherence tomography. Opt Express. 2006 Apr 17;14:3225–3237. doi: 10.1364/oe.14.003225. [DOI] [PubMed] [Google Scholar]
- 27.Huber R, Adler DC, Fujimoto JG. Buffered Fourier domain mode locking: unidirectional swept laser sources for optical coherence tomography imaging at 370,000 lines/s. Opt Lett. 2006 Oct 15;31:2975–2977. doi: 10.1364/ol.31.002975. [DOI] [PubMed] [Google Scholar]
- 28.Drexler W, Liu M, Kumar A, Kamali T, Unterhuber A, Leitgeb RA. Optical coherence tomography today: speed, contrast, and multimodality. J Biomed Opt. 2014 Jul;19:071412. doi: 10.1117/1.JBO.19.7.071412. [DOI] [PubMed] [Google Scholar]
- 29.Zhang K, Kang JU. Real-time 4D signal processing and visualization using graphics processing unit on a regular nonlinear-k Fourier-domain OCT system. Opt Express. 2010 May;18:11772–11784. doi: 10.1364/OE.18.011772. [DOI] [PMC free article] [PubMed] [Google Scholar]
- 30.Schmitt J. OCT elastography: imaging microscopic deformation and strain of tissue. Opt Express. 1998 Sep;3:199–211. doi: 10.1364/oe.3.000199. [DOI] [PubMed] [Google Scholar]
- 31.Liang X, Adie SG, John R, Boppart SA. Dynamic spectral-domain optical coherence elastography for tissue characterization. Opt Express. 2010 Jun;18:14183–14190. doi: 10.1364/OE.18.014183. [DOI] [PMC free article] [PubMed] [Google Scholar]
- 32.Sun C, Standish B, Yang VX. Optical coherence elastography: current status and future applications. J Biomed Opt. 2011 Apr;16:043001. doi: 10.1117/1.3560294. [DOI] [PubMed] [Google Scholar]
- 33.Kennedy BF, Kennedy KM, Sampson DD. A Review of Optical Coherence Elastography: Fundamentals, Techniques and Prospects. IEEE J Sel Top Quant. 2014 Apr;20:272–288. [Google Scholar]
- 34.Wang S, Larin KV. Optical coherence elastography for tissue characterization: a review. J Biophotonics. 2015 Apr;8:279–302. doi: 10.1002/jbio.201400108. [DOI] [PMC free article] [PubMed] [Google Scholar]
- 35.Ford MR, Dupps WJ, Jr, Rollins AM, Roy AS, Hu Z. Method for optical coherence elastography of the cornea. J Biomed Opt. 2011 Jan;16:016005. doi: 10.1117/1.3526701. [DOI] [PMC free article] [PubMed] [Google Scholar]
- 36.Ford MR, Sinha Roy A, Rollins AM, Dupps WJ., Jr Serial biomechanical comparison of edematous, normal, and collagen crosslinked human donor corneas using optical coherence elastography. J Cataract Refract Surg. 2014 Jun;40:1041–1047. doi: 10.1016/j.jcrs.2014.03.017. [DOI] [PMC free article] [PubMed] [Google Scholar]
- 37.Armstrong BK, Lin MP, Ford MR, Santhiago MR, Singh V, Grossman GH, et al. Biological and biomechanical responses to traditional epithelium-off and transepithelial riboflavin-UVA CXL techniques in rabbits. J Refract Surg. 2013 May;29:332–341. doi: 10.3928/1081597X-20130415-04. [DOI] [PMC free article] [PubMed] [Google Scholar]
- 38.Torricelli AA, Ford MR, Singh V, Santhiago MR, Dupps WJ, Jr, Wilson SE. BAC-EDTA transepithelial riboflavin-UVA crosslinking has greater biomechanical stiffening effect than standard epithelium-off in rabbit corneas. Exp Eye Res. 2014 Aug;125:114–117. doi: 10.1016/j.exer.2014.06.001. [DOI] [PMC free article] [PubMed] [Google Scholar]
- 39.Alonso-Caneiro D, Karnowski K, Kaluzny BJ, Kowalczyk A, Wojtkowski M. Assessment of corneal dynamics with high-speed swept source optical coherence tomography combined with an air puff system. Opt Express. 2011 Jul;19:14188–14199. doi: 10.1364/OE.19.014188. [DOI] [PubMed] [Google Scholar]
- 40.Dorronsoro C, Pascual D, Perez-Merino P, Kling S, Marcos S. Dynamic OCT measurement of corneal deformation by an air puff in normal and cross-linked corneas. Biomed Opt Express. 2012 Mar;3:473–487. doi: 10.1364/BOE.3.000473. [DOI] [PMC free article] [PubMed] [Google Scholar]
- 41.Sticker M, Hitzenberger CK, Leitgeb R, Fercher AF. Quantitative differential phase measurement and imaging in transparent and turbid media by optical coherence tomography. Opt Lett. 2001 Apr;26:518–520. doi: 10.1364/ol.26.000518. [DOI] [PubMed] [Google Scholar]
- 42.Wang RK, Kirkpatrick S, Hinds M. Phase-sensitive optical coherence elastography for mapping tissue microstrains in real time. Appl Phys Lett. 2007 Apr;90:164105. [Google Scholar]
- 43.Kling S, Akca IB, Chang EW, Scarcelli G, Bekesi N, Yun SH, et al. Numerical model of optical coherence tomographic vibrography imaging to estimate corneal biomechanical properties. J R Soc Interface. 2014 Dec;11:20140920. doi: 10.1098/rsif.2014.0920. [DOI] [PMC free article] [PubMed] [Google Scholar]
- 44.Li C, Guan G, Huang Z, Johnstone M, Wang RK. Noncontact all-optical measurement of corneal elasticity. Opt Lett. 2012 May;37:1625–1627. doi: 10.1364/OL.37.001625. [DOI] [PubMed] [Google Scholar]
- 45.Li J, Wang S, Manapuram RK, Singh M, Menodiado FM, Aglyamov S, et al. Dynamic optical coherence tomography measurements of elastic wave propagation in tissue-mimicking phantoms and mouse cornea in vivo. J Biomed Opt. 2013 Dec;18:121503. doi: 10.1117/1.JBO.18.12.121503. [DOI] [PMC free article] [PubMed] [Google Scholar]
- 46.Manapuram RK, Aglyamov SR, Monediado FM, Mashiatulla M, Li J, Emelianov SY, et al. In vivo estimation of elastic wave parameters using phase-stabilized swept source optical coherence elastography. J Biomed Opt. 2012 Oct;17:100501. doi: 10.1117/1.JBO.17.10.100501. [DOI] [PMC free article] [PubMed] [Google Scholar]
- 47.Nahas A, Bauer M, Roux S, Boccara AC. 3D static elastography at the micrometer scale using Full Field OCT. Biomed Opt Express. 2013 Sep;4:2138–2149. doi: 10.1364/BOE.4.002138. [DOI] [PMC free article] [PubMed] [Google Scholar]
- 48.Wang S, Larin KV. Shear wave imaging optical coherence tomography (SWI-OCT) for ocular tissue biomechanics. Opt Lett. 2014 Jan;39:41–44. doi: 10.1364/OL.39.000041. [DOI] [PMC free article] [PubMed] [Google Scholar]
- 49.Li J, Han Z, Singh M, Twa MD, Larin KV. Differentiating untreated and cross-linked porcine corneas of the same measured stiffness with optical coherence elastography. J Biomed Opt. 2014 Nov;19:110502. doi: 10.1117/1.JBO.19.11.110502. [DOI] [PMC free article] [PubMed] [Google Scholar]
- 50.Li JS, Wang S, Singh M, Aglyamov S, Emelianov S, Twa MD, et al. Air-pulse OCE for assessment of age-related changes in mouse cornea in vivo. Laser Phys Lett. 2014 Jun;11:065601. [Google Scholar]
- 51.Wang S, Larin KV. Noncontact depth-resolved micro-scale optical coherence elastography of the cornea. Biomed Opt Express. 2014 Nov;5:3807–3821. doi: 10.1364/BOE.5.003807. [DOI] [PMC free article] [PubMed] [Google Scholar]
- 52.Wang S, Larin KV, Li JS, Vantipalli S, Manapuram RK, Aglyamov S, et al. A focused air-pulse system for optical-coherence-tomography- based measurements of tissue elasticity. Laser Phys Lett. 2013 Jul;10:075605. doi: 10.1088/1612-2011/10/7/075605. [DOI] [PMC free article] [PubMed] [Google Scholar]
- 53.Twa MD, Li J, Vantipalli S, Singh M, Aglyamov S, Emelianov S, et al. Spatial characterization of corneal biomechanical properties with optical coherence elastography after UV crosslinking. Biomed Opt Express. 2014 May;5:1419–1427. doi: 10.1364/BOE.5.001419. [DOI] [PMC free article] [PubMed] [Google Scholar]
- 54.Han Z, Aglyamov SR, Li J, Singh M, Wang S, Vantipalli S, et al. Quantitative assessment of corneal viscoelasticity using optical coherence elastography and a modified Rayleigh-Lamb equation. J Biomed Opt. 2015 Feb;20:20501. doi: 10.1117/1.JBO.20.2.020501. [DOI] [PMC free article] [PubMed] [Google Scholar]
- 55.Han Z, Li J, Singh M, Wu C, Liu CH, Wang S, et al. Quantitative methods for reconstructing tissue biomechanical properties in optical coherence elastography: a comparison study. Phys Med Biol. 2015 May;60:3531–3547. doi: 10.1088/0031-9155/60/9/3531. [DOI] [PMC free article] [PubMed] [Google Scholar]
- 56.Nguyen TM, Aubry JF, Fink M, Bercoff J, Tanter M. In vivo evidence of porcine cornea anisotropy using supersonic shear wave imaging. Invest Ophthalmol Vis Sci. 2014 Nov;55:7545–7552. doi: 10.1167/iovs.14-15127. [DOI] [PubMed] [Google Scholar]
- 57.Elsheikh A, Alhasso D. Mechanical anisotropy of porcine cornea and correlation with stromal microstructure. Exp Eye Res. 2009 Jun;88:1084–1091. doi: 10.1016/j.exer.2009.01.010. [DOI] [PubMed] [Google Scholar]
- 58.Manapuram RK, Manne VGR, Larin KV. Development of phase-stabilized swept-source OCT for the ultrasensitive quantification of microbubbles. Laser Phys. 2008 Sep;18:1080–1086. [Google Scholar]
- 59.Song S, Huang Z, Nguyen TM, Wong EY, Arnal B, O’Donnell M, et al. Shear modulus imaging by direct visualization of propagating shear waves with phase-sensitive optical coherence tomography. J Biomed Opt. 2013 Dec;18:121509. doi: 10.1117/1.JBO.18.12.121509. [DOI] [PMC free article] [PubMed] [Google Scholar]
- 60.Song S, Huang Z, Wang RK. Tracking mechanical wave propagation within tissue using phase-sensitive optical coherence tomography: motion artifact and its compensation. J Biomed Opt. 2013 Dec;18:121505. doi: 10.1117/1.JBO.18.12.121505. [DOI] [PubMed] [Google Scholar]
- 61.Manapuram RK, Aglyamov S, Menodiado FM, Mashiatulla M, Wang S, Baranov SA, et al. Estimation of shear wave velocity in gelatin phantoms utilizing PhS-SSOCT. Laser Phys. 2012 Sep;22:1439–1444. [Google Scholar]
- 62.Mandell RB. Corneal power correction factor for photorefractive keratectomy. J Refract Corneal Surg. 1993;10:125–128. [PubMed] [Google Scholar]
- 63.Wang S, Lopez AL, 3rd, Morikawa Y, Tao G, Li J, Larina IV, et al. Noncontact quantitative biomechanical characterization of cardiac muscle using shear wave imaging optical coherence tomography. Biomed Opt Express. 2014 Jul 1;5:1980–1992. doi: 10.1364/BOE.5.001980. [DOI] [PMC free article] [PubMed] [Google Scholar]
- 64.Doyle JF. Wave propagation in structures: spectral analysis using fast discrete Fourier transform. Springer-Verlag; New York: 1997. [Google Scholar]
- 65.Kampmeier J, Radt B, Birngruber R, Brinkmann R. Thermal and biomechanical parameters of porcine cornea. Cornea. 2000 May;19:355–363. doi: 10.1097/00003226-200005000-00020. [DOI] [PubMed] [Google Scholar]
- 66.Han Z, Li J, Singh M, Aglyamov SR, Wu C, Liu C, et al. Analysis of the effects of curvature and thickness on elastic wave velocity in cornea-like structures by finite element modeling and optical coherence elastography. Appl Phys Lett. 2015;106:233702. doi: 10.1063/1.4922728. [DOI] [PMC free article] [PubMed] [Google Scholar]
- 67.Singh M, Wu C, Liu CH, Li J, Schill A, Nair A, et al. Phase-sensitive optical coherence elastography at 1.5 million A-Lines per second. Opt Lett. 2015 Jun 1;40:2588–2591. doi: 10.1364/OL.40.002588. [DOI] [PMC free article] [PubMed] [Google Scholar]
- 68.Kirk R, Kennedy B, Sampson D, McLaughlin R. Near video-rate optical coherence elastography by acceleration with a graphics processing unit. J Lightwave Tech. 2015 Mar;PP:1–6. [Google Scholar]
- 69.Qi W, Li R, Ma T, Li J, Kirk Shung K, Zhou Q, et al. Resonant acoustic radiation force optical coherence elastography. Appl Phys Lett. 2013 Sep;103:103704. doi: 10.1063/1.4820252. [DOI] [PMC free article] [PubMed] [Google Scholar]
- 70.Potel C, Debelleval JF. Surface-Waves in an Anisotropic Periodically Multilayered Medium - Influence of the Absorption. J Appl Phys. 1995 Jun;77:6152–6161. [Google Scholar]
- 71.Graff KF. Wave motion in elastic solids. New York: Courier Corporation; 1975. [Google Scholar]
- 72.Elsheikh A, Alhasso D, Rama P. Biomechanical properties of human and porcine corneas. Exp Eye Res. 2008 May;86:783–790. doi: 10.1016/j.exer.2008.02.006. [DOI] [PubMed] [Google Scholar]
- 73.Zeng YJ, Yang J, Huang K, Lee ZH, Lee XY. A comparison of biomechanical properties between human and porcine cornea. J Biomech. 2001 Apr;34:533–537. doi: 10.1016/s0021-9290(00)00219-0. [DOI] [PubMed] [Google Scholar]
- 74.Mikula E, Hollman K, Chai D, Jester JV, Juhasz T. Measurement of corneal elasticity with an acoustic radiation force elasticity microscope. Ultrasound Med Biol. 2014 Jul;40:1671–1679. doi: 10.1016/j.ultrasmedbio.2013.11.009. [DOI] [PMC free article] [PubMed] [Google Scholar]
- 75.Kohlhaas M, Spoerl E, Schilde T, Unger G, Wittig C, Pillunat LE. Biomechanical evidence of the distribution of cross-links in corneas treated with riboflavin and ultraviolet A light. J Cataract Refract Surg. 2006 Feb;32:279–283. doi: 10.1016/j.jcrs.2005.12.092. [DOI] [PubMed] [Google Scholar]
- 76.Cabrera Fernandez D, Niazy AM, Kurtz RM, Djotyan GP, Juhasz T. Finite element analysis applied to cornea reshaping. J Biomed Opt. 2005 Nov-Dec;10:064018. doi: 10.1117/1.2136149. [DOI] [PubMed] [Google Scholar]
- 77.Hoeltzel DA, Altman P, Buzard K, Choe K. Strip extensiometry for comparison of the mechanical response of bovine, rabbit, and human corneas. J Biomech Eng. 1992 May;114:202–215. doi: 10.1115/1.2891373. [DOI] [PubMed] [Google Scholar]
- 78.Elsheikh A, Brown M, Alhasso D, Rama P, Campanelli M, Garway-Heath D. Experimental assessment of corneal anisotropy. J Refract Surg. 2008 Feb;24:178–187. doi: 10.3928/1081597X-20080201-09. [DOI] [PubMed] [Google Scholar]
- 79.Pinsky PM, van der Heide D, Chernyak D. Computational modeling of mechanical anisotropy in the cornea and sclera. J Cataract Refract Surg. 2005 Jan;31:136–145. doi: 10.1016/j.jcrs.2004.10.048. [DOI] [PubMed] [Google Scholar]


