

Abstract
Cancer stem-like cells contribute to tumor heterogeneity and have been implicated in disease relapse and drug resistance. Here we show the co-existence of distinct breast cancer stem-like cells (BCSC) as identified by ALDH+ and CD29hiCD61+ markers, respectively, in murine models of breast cancer. While both BCSC exhibit enhanced tumor initiating potential, CD29hiCD61+ BCSC displayed increased invasive abilities and higher expression of epithelial to mesenchymal (EMT) and mammary stem cell-associated genes, whereas ALDH+ BCSC were more closely associated with luminal progenitors. Attenuating the autophagy regulator FIP200 diminished the tumor-initiating properties of both ALDH+ and CD29hiCD61+ BCSC, as achieved by impairing either the Stat3 and TGFß/Smad pathways, respectively. Further, combining the Stat3 inhibitor Stattic and the Tgfß-R1 inhibitor LY-2157299 inhibited the formation of both epithelial and mesenchymal BCSC colonies. In vivo this combination treatment was sufficient to limit tumor growth and reduce BCSC number. Overall, our findings reveal a differential dependence of heterogeneous BCSC populations on divergent signaling pathways, with implications on how to tailor drug combinations to improve therapeutic efficacy.
Keywords: Autophagy, breast cancer, cancer stem cell, Egfr, Stat3, TGF-beta, Smad, EMT, plasticity, heterogeneity
Introduction
Breast cancer is the most common form of cancer among women worldwide and some of the key challenges faced when treating this widespread disease include therapeutic resistance, relapse and metastasis (1). There is increasing evidence to indicate that these challenges persist due to the existence of a sub-population of cells within tumors termed cancer stem-like cells (CSCs) (2–4). Initial isolation of breast cancer stem-like cells (BCSCs) demonstrated that not all cells within a tumor are equal and it is the BCSCs which exhibit increased tumorigenicity and drive tumor growth (5). In fact, BCSCs have been shown to exhibit resistance to conventional therapies (3,4) and drive metastasis (6). The presence of BCSCs presents an additional layer of heterogeneity within tumors alongside intra-tumor genetic diversity. Conventional chemotherapies which tend to eliminate just the bulk tumor population enrich for BCSCs and this can lead to more aggressive residual disease. Accordingly, therapeutic efforts now account for BCSCs rather than just targeting the bulk tumor population (7).
Meanwhile, plasticity exists where non-BCSC populations can acquire BCSC properties through pathways such as epithelial to mesenchymal transition (EMT) (8,9). In addition, distinct BCSC populations with epithelial and mesenchymal properties respectively have been described and the inter-conversion between the two states has been demonstrated (10). These distinct BCSCs were also shown to occupy different niches, where epithelial BCSCs were located in central regions of the tumor whereas mesenchymal BCSCs were found at the invasive front. These observations raise the possibility that diverse BCSC populations may exist within a tumor and possibly have differential susceptibilities to BCSC targeted therapeutics. With that notion, it would be imperative to account for heterogeneous BCSC populations and limiting the plasticity of these populations when considering therapeutic strategies.
Autophagy is a self-cannibalization process which involves the sequestration of organelles, proteins or lipids in vesicles termed autophagosomes for degradation and recycling. Degradation occurs upon fusion of autophagosomes with lysosomes and the degraded products are exported into the cytoplasm for recycling (11). Basal levels of autophagy are important to eliminate damaged organelles such as mitochondria and unfolded proteins. Autophagy can also be induced to maintain homeostasis under stressful conditions such as nutrient starvation. The physiological importance of autophagy is illustrated by the involvement of autophagy-related (Atg) proteins in diseases such as cancer, neurodegeneration and auto-immunity (11).
In terms of the role of autophagy in cancer, a duality exists where the autophagic process performs a tumor suppressive function during tumorigenesis but promotes malignancy in advanced tumor progression (12). The homeostatic function of autophagy limits genotoxic stress, inflammation and production of reactive oxygen species (ROS) and this reduces the rate of mutagenesis (13). On the other hand, autophagy confers survival advantages in established tumors under stressful conditions such as hypoxia and allows tumor cells to sustain demanding metabolic needs (12,14). It is also becoming apparent that autophagy impinges on features which are crucial for metastatic dissemination. Autophagy promotes resistance to anoikis, a trait that is important for the survival of tumor cells which have detached and are circulating (15,16). In addition autophagy has also been implicated in promoting tumor cell invasion (17,18). For these reasons, it is no surprise that autophagy inhibitors such as hydroxychloroquine are actively trialed in the clinic for treatment of cancers and development of novel autophagy inhibitors are earnestly pursued (19). Recent studies also implicated a role of autophagy specifically in BCSC populations. Impairing autophagy can affect the maintenance of BCSCs through limiting EMT and the CD44+/CD24− phenotype (20). Beclin1 silencing could also abrogate the propagation of BCSCs in mammosphere cultures and their tumorigenicity in vivo (21). However, the underlying molecular mechanism is still not well understood, and it is not known whether autophagy may regulate different BCSC subsets through different mechanisms.
Materials and Methods
Reagents and antibodies
EGFR WT plasmid was a gift from Matthew Meyerson (Addgene plasmid # 11011) (22). Plasmids used for silencing Stat3 (TRCN71453, TRCN71454), Egfr (TRCN23482, TRCN23480) and Smad4 (TRCN25885, TRCN25881) were obtained from the Cincinnati Children’s Hospital Lenti-shRNA library core. Antibodies used for immunoblotting include Beta-Actin (Sigma A5441), Vinculin (Sigma V4505), EGFR (CST 4267), phospho-EGFR Y1068 (CST 3777), Jak2 (CST 3230), phospho-Jak2 Y1007/1008 (CST 3776), Stat3 (CST 9139), phospho-Stat3 Y705 (CST 9145), Smad2/3 (CST 3102), phospho-Smad2/3 (CST 8828), phospho-Smad2 (CST3101), Smad4 (CST 9515), Socs3 (CST 2932) and Pias3 (CST 9042). For flow cytometry, antibodies used were CD29-V450 (BD 562155), CD24-PE (BD553262), CD31-APC (Biolegend 102410), CD45-APC (Biolegend 103112), Ter119-APC (116212), Streptavidin-APCcy7 (Biolegend 405208) and CD61-biotin (eBioscience 13061185).
Cell culture, treatment, transfection and transduction of cells
Primary tumor cells and their derivatives were cultured in DMEM/F12 supplemented with 10% FBS, 10ng/ml EGF, 20μgml insulin and 50units/ml penicillin-streptomycin. Recombinant TGF-β was purchased from Gibco and cells were treated at a concentration of 10ng/ml. For colony formation assays, cells were plated at a density of 1000cells/well in 6-well plates and the number of colonies that formed after 7 days were quantified after crystal violet staining. The generation of FIP200f/f;PyMT;CreER cells have been described previously (23) and deletion of Fip200 was induced by culturing with 100nM 4-hydroxy-tamoxifen. Transfection experiments were carried out using Lipofectamine 2000 Reagent (Invitrogen). Production of lentivirus and transduction of cells were carried out as described previously (24).
Flow cytometry and cell sorting
Dissociated single cell suspensions from primary tumors (as described previously (24)) or cultured cells were incubated with Aldefluor reagent (Stem Cell Technologies) for 30 minutes according to manufacturer’s instructions. Cells were then rinsed before incubation with CD61-biotin for 20 minutes at 4°C. Following that, cells were rinsed and incubated with other antibodies marking CSCs for 20 minutes at 4°C. Cells were then rinsed and resuspended in Aldefluor buffer before sorting or analysis by FACSAria or FACSCanto instruments (BD Biosciences). Flow cytometry data were analyzed using FlowJo software.
Tumor mice and transplants
MMTV-PyMT, Ctrl-MT (Fip200f/f, MMTV-PyMT) and cKO-MT (Fip200f/f, MMTV-PyMT, MMTV-Cre) mice have been described previously (14). MMTV-Wnt1 mice were obtained from Dr. Yi Li of Baylor College of Medicine. Mice were housed and handled according to local, state and federal regulations. All experimental procedures were carried out according to protocols approved by the Institutional Animal Care and Use Committee at University of Cincinnati. For transplantation experiments, cells were prepared in DMEM:Matrigel at a 1:1 ratio and the required number of cells were injected in a 50μl volume orthotopically into the fourth inguinal mammary fat pads of athymic Nude mice (Harlan). For limiting dilution transplants, mice were monitored for at least 3 months for the formation of tumors. Tumor growth measurements were obtained using calipers and volume was calculated as (1/2)(length)(width)2.
Boyden chamber invasion assays
Cells were seeded at a density of 25,000 cells/well in Boyden chambers coated with growth factor reduced Matrigel (BD Biosciences) and incubated for 24 hours. Cells on the membrane were then fixed with ice cold ethanol and stained with crystal violet. Cells which have invaded to the lower side of the membrane were then quantified.
Administration of Stattic and LY-2157299
Stattic was purchased from ApexBio and LY-2157299 was kind gift from Eli Lilly. Drugs were prepared in vehicle (1% carboxymethylcellulose, 0.5% sodium lauryl sulfate, 0.085% povidone and 0.05% anti-foam [kind gift from Xiameter]) for administration via orogastric gavage. Mice with orthotopically transplanted PyMT cells were randomized into respective treatment groups when the volume of tumors reached ≥50mm3. The treatment cohorts consisted of vehicle control, LY-2157299 only, Stattic only or LY-2157299 and Stattic. LY-2157299 was administered twice daily (b.i.d) at 100mg/kg doses whereas Stattic was fed once daily (q.d.) at 20mg/kg doses. Mice cohorts were treated for a total of 21 days in this treatment regimen with no observable side effects.
SDS-PAGE and immunoblotting
Lysates were prepared from cells using modified RIPA buffer as described previously (24) with the addition of protease and phosphatase inhibitors according to manufacturer’s instructions (Thermo Scientific). Protein concentrations were then quantified by BCA method, subjected to SDS-PAGE and analyzed by immunoblotting as described previously (24).
RNA extraction and quantitative RT-PCR
Total RNA was isolated from cells using RNAeasy kit (Qiagen) according to manufacturer’s instructions. Equal amounts of RNA were then reverse-transcribed using SuperScript III first-strand synthesis kit (Invitrogen) with random hexamers as primers. cDNA samples were then subjected to qRT-PCR analysis with SYBR Green in a BioRad CFXConnect thermo-cycler. List of primers used are detailed in supplementary figures.
RNA Sequencing of sorted cell populations
RNA sequencing experiments were performed by the Genomics, Epigenomics and Sequencing Core in University of Cincinnati. Briefly, RNA from sorted cells were isolated using mirVana miRNA Isolation Kit (Thermo Scientific) according to manufacturer’s instructions for total RNA isolation. Targeted RNA enrichment was achieved using NEBNext Poly(A) mRNA Magnetic Isolation Module (New England BioLabs) and PrepX mRNA Library kit (WaferGen) combined with Apollo 324 NGS automated library prep system was used for library preparation. Cluster generation and HiSeq sequencing were carried out using the cBot and HiSeq systems (Illumina) respectively. To analyze differential gene expression, sequence reads were aligned to the genome using standard Illumina sequence analysis pipeline, which was analyzed by The Laboratory for Statistical Genomics and Systems Biology in the University of Cincinnati.
Immunohistochemistry
Formalin-fixed paraffin embedded tumors were sectioned (5μM) and stained for respective antigens as described previously (14). For antigen retrieval, slides were heated in citrate buffer in a pressure cooker.
Statistical Analysis
Data were plotted as means ± SEM and statistical significance was determined using a two-tailed t-test. Statistical differences between groups for limiting dilution transplants were performed using ELDA as described previously (25). For tumor growth curves, ANCOVA test was used to determine significance. The threshold for significance of p values was 0.05.
Results
ALDH+ and CD29hiCD61+ markers identify distinct BCSC populations in mammary tumors
The putative BCSC markers ALDH+ and CD29hiCD61+ have been reported to enrich for CSC populations in mouse mammary tumors (24,26,27). Nonetheless, there is evidence to suggest that BCSCs with different characteristics can coexist within breast tumors (10). For that reason, we set out to address whether ALDH+ and CD29hiCD61+ populations identify identical overlapping subsets of CSCs or they are separate entities within mammary tumors. First, we employed Lin−CD24+CD29hiCD61+ as a marker to analyze BCSC content in the MMTV-PyMT and MMTV-Wnt1 models which represent luminal B and basal-like subtypes of breast cancer respectively (28). Under similar gating criteria, we found a higher fraction of BCSCs (i.e. % Lin−CD24+CD29hiCD61+ cells out of total Lin−CD24+ cells) in MMTV-Wnt1 driven tumors compared to those in MMTV-PyMT driven tumors (Figure 1A, left and middle panels). Interestingly, when we overlay the CD29hiCD61+ profiles of cells from both tumor types, we identify three distinct populations which are reminiscent of the CD29CD61 profile of normal mammary epithelial cells (MECs) (Figure 1A, right panel). Accordingly, when these tumors were analyzed alongside MECs, we found that MMTV-PyMT tumors, which have been described to display a luminal progenitor gene signature, coincide mostly with the CD29CD61 profile of luminal progenitor (LP) and mature luminal (ML) cells. It is also worth noting that a small proportion of cells from MMTV-PyMT tumors reside within the mammary stem cell enriched (MSC) gate. On the other hand, MMTV-Wnt1 tumors comprise mostly of cells which coincide within the MSC and ML gates (Figure 1B). We next used Lin−CD24+ALDH+ as a BCSC marker to analyze both tumor types and found that consistent with results using Lin−CD24+CD29hiCD61+, MMTV-Wnt1 tumors contained higher amounts of ALDH+ cells than MMTV-PyMT tumors (Figure 1C). However, surprisingly, we found that ALDH+ and CD29hiCD61+ populations only overlap to a small degree in either of these two tumors (Figure 1D).
Figure 1. CD29hi CD61+ and ALDH+ BCSC populations overlap minimally in mouse models of breast cancer.
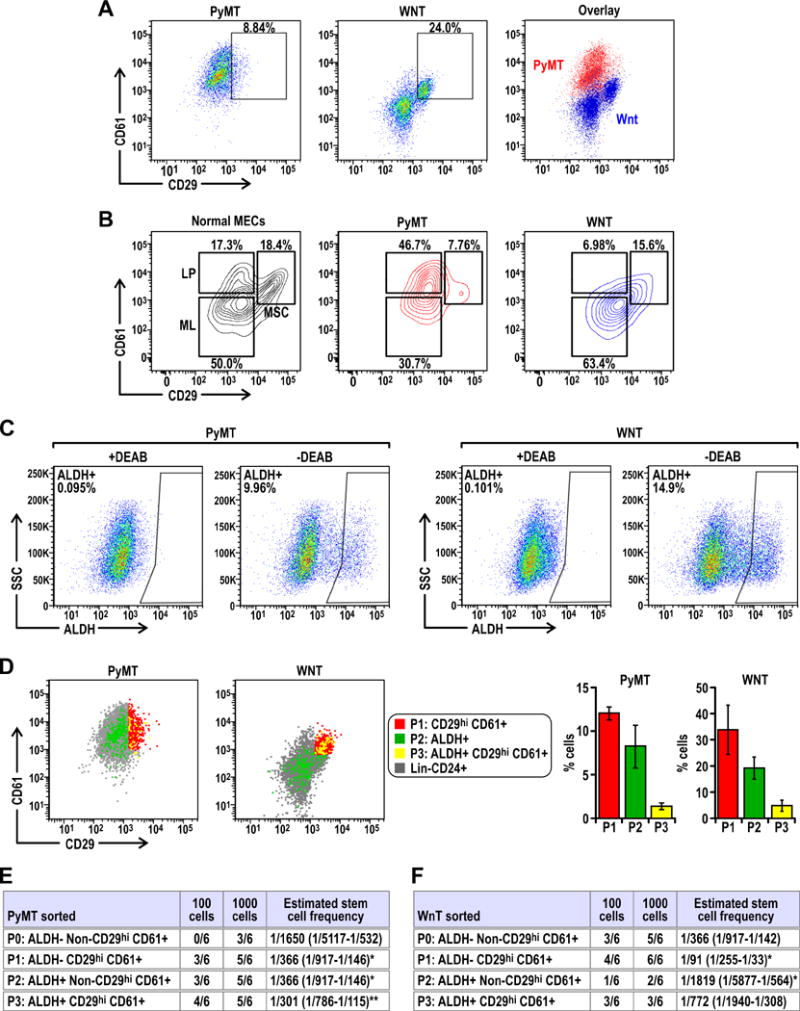
(A) Dot plots showing the CD29 CD61 profile of Lin−CD24+ cells from PyMT and Wnt tumors and the overlay of both profiles. (B) Contour plots showing the CD29 CD61 profile of normal mammary epithelial cells (MECs) with gates identifying distinct mammary stem cell enriched (MSC), luminal progenitor (LP) and mature luminal (ML) populations, alongside contour plots of PyMT and Wnt tumors indicating the CD29 CD61 distribution of these tumor cells with respect to the gates from normal MECs. (C) Dot plots of gated Lin− CD24+ ALDH+ populations in PyMT and Wnt tumors relative to respective negative control (+DEAB). (D) CD29 CD61 profiles of P1:CD29hi CD61+ cells (red), P2:ALDH+ cells (green) and P3:ALDH+CD29hi CD61+ cells (yellow) in PyMT and Wnt tumors. Bar charts show the percentage of respective populations from at least n=6 tumors for each cohort. Limiting dilution transplants of sorted P0: ALDH− Non-CD29hiCD61+, P1: ALDH− CD29hiCD61+, P2: ALDH+ Non-CD29hiCD61+ and P3: ALDH+ CD29hiCD61+ cells from (E) PyMT or (F) Wnt tumors. Freshly isolated PyMT or Wnt tumor cells were sorted and orthotopically transplanted into the fourth mammary glands of athymic Nude mice. The frequency of tumor formation after 3 months was recorded and CSC frequency was calculated using ELDA software. Statistical significance was determined by pairwise Chi-squared test of respective groups against P0, * denotes p≤0.05 and ** denotes p≤0.01.
Although numerous markers and criteria have been described to enrich for BCSCs in mouse mammary tumors, these markers have not been studied concurrently. Our observation that ALDH+ and CD29hiCD61+ populations overlap only minimally led us to address whether both these populations are indeed enriched for BCSCs or perhaps just the overlapping fraction (i.e. ALDH+CD29hiCD61+) have BCSC activity. For that, we sorted cells from freshly harvested tumors into four fractions termed P1 (CD29hiCD61+ only), P2 (ALDH+ only), P3 (ALDH+ and CD29hiCD61+) and P0 (Bulk of ALDH−, Non CD29hiCD61+) based on the sorting strategy described in Figure S1. Through limiting dilution transplantation of these populations, we found that in MMTV-PyMT tumors, P1, P2 and P3 populations have increased tumor initiating ability relative to P0, which are the bulk of tumor cells (Figure 1E). This shows that both ALDH+ and CD29hiCD61+ populations in MMTV-PyMT tumors are enriched for BCSCs, but the overlapping P3 population does not display a further increase in tumor initiating potential. Moreover, the tumors formed from each of the populations recapitulated the histological features, growth rates as well as flow cytometry profiles of parental tumors (Figure S2A–S2D). The tumors which form from respective sorted populations also display continuous activation of BCSC associated pathways, namely p-Stat3 (Figure S3A) and p-Smad2 (Figure S3B). Contrastingly, in Wnt1 driven tumors, we found that the CD29hiCD61+ population was most tumorigenic whereas the ALDH+ population was least tumorigenic (Figure 1F). However, the tumors that developed in the recipient mice also showed similar features as examined by histology, tumor growth and flow cytometry (Figure S2E–S2H). Together, these results demonstrate that ALDH+ and CD29hiCD61+ markers identify distinct populations of BCSCs in MMTV-PyMT tumors, whereas mammary tumors driven by the Wnt1 oncogene primarily contain BCSCs enriched by CD29hiCD61+ but ALDH+ is not a suitable marker for this subtype of breast cancer.
CD29hiCD61+ tumor initiating cells have enhanced invasive and mesenchymal properties
As ALDH+ and CD29hiCD61+ both enriched for BCSCs in MMTV-PyMT tumors, we further investigated whether these two distinct BCSC populations have different characteristics. ALDH+ and CD29hiCD61+ enriched BCSCs as well as those cells positive for both sets of markers showed no statistical differences for Ki67 staining, but all these three populations had less actively cycling cells compared to the bulk tumor cells (Figure 2A). In contrast to the comparable lower proliferation rates for both ALDH+ and CD29hiCD61+ BCSCs, CD29hiCD61+ (as well as ALDH+CD29hiCD61+) BCSCs exhibited increased invasive abilities (Figure 2B). Analysis of these populations for factors important in determining epithelial and mesenchymal features showed that the reduced proliferation of BCSCs (compared to the bulk tumor cells) correlated with the decreased E-cadherin levels, whereas the increased invasiveness of CD29hiCD61+ BCSCs correlated with higher Vimentin levels and increased Twist1 expression (Figure 2C). In Wnt1-driven tumors, CD29hiCD61+ BCSCs (P1) showed a significant reduction in proliferation, and also exhibited increased invasion, compared to the bulk tumor cells (P0) (Figures 2D and 2E). No difference in E-cadherin expression was found, but CD29hiCD61+ BCSCs showed increased Vimentin and another EMT inducing factor Slug (Figure 2F). The ALDH+CD29hiCD61+ population (P3) in Wnt tumors also exhibited invasive and mesenchymal features (Figures 2E and 2F) but were not enriched in BCSCs (Figure 3), possibly representing an intermediate between CD29hiCD61+ BCSCs (P1) and non CSCs.
Figure 2. CD29hi CD61+ CSCs exhibit increased invasiveness and expression of EMT associated genes.
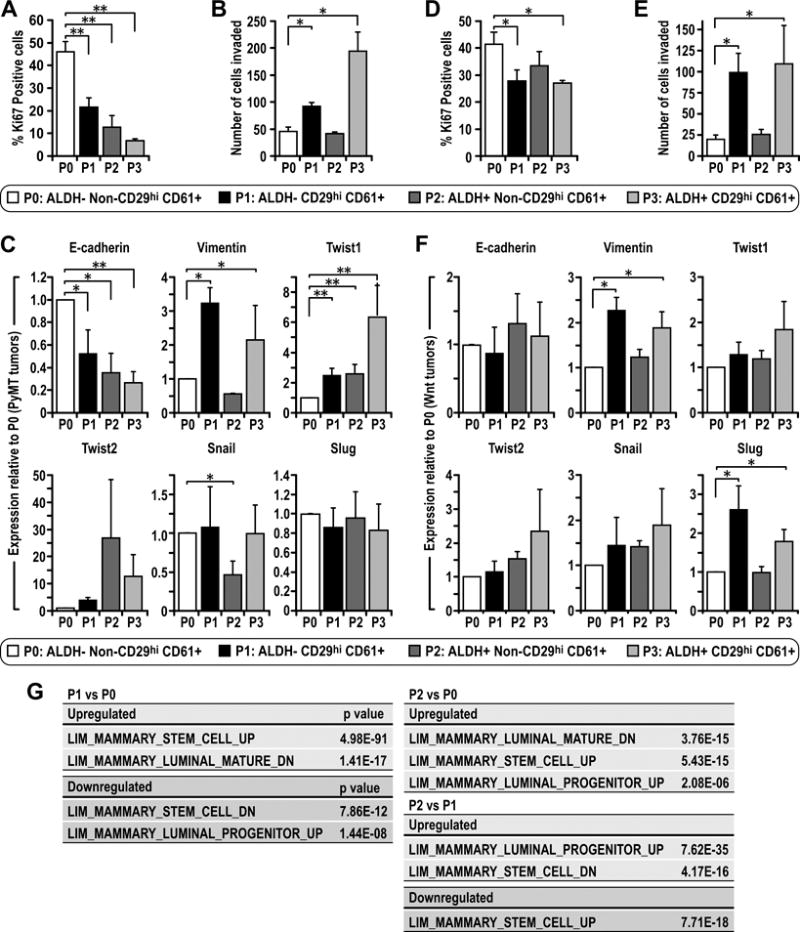
Freshly isolated tumor cells were sorted into P0: ALDH− non-CD29hiCD61+, P1:ALDH− CD29hiCD61+, P2: ALDH+ non-CD29hiCD61+ and P3: ALDH+ CD29hiCD61+ populations. (A) PyMT or (D) Wnt sorted populations were plated overnight under normal culture conditions and stained for Ki67 via immunocytochemistry and the percentage of positive cells were quantified. (B) PyMT or (E) Wnt sorted populations were seeded in Matrigel coated Boyden chambers for 24 hours and the number of cells that invaded were quantified. Sorted populations from (C) PyMT or (F) Wnt tumors were analyzed via qRT-PCR for gene expression levels of E-cadherin, Vimentin, Twist1, Twist2, Snail and Slug. Statistical significance was determined by two-tailed t-test, * denotes p≤0.05, ** denotes p≤0.01. (G) RNA-sequencing data showing correlation of differentially expressed genes between sorted populations with genes differentially expressed in cells within the mammary epithelial hierarchy published in reference 28. In red are upregulated genes for a particular comparison whereas downregulated genes are highlighted in green.
Figure 3. Ablation of Fip200 reduces the proportion of CD29hiCD61+ cells and Aldh1a3 transcript levels in PyMT tumors.
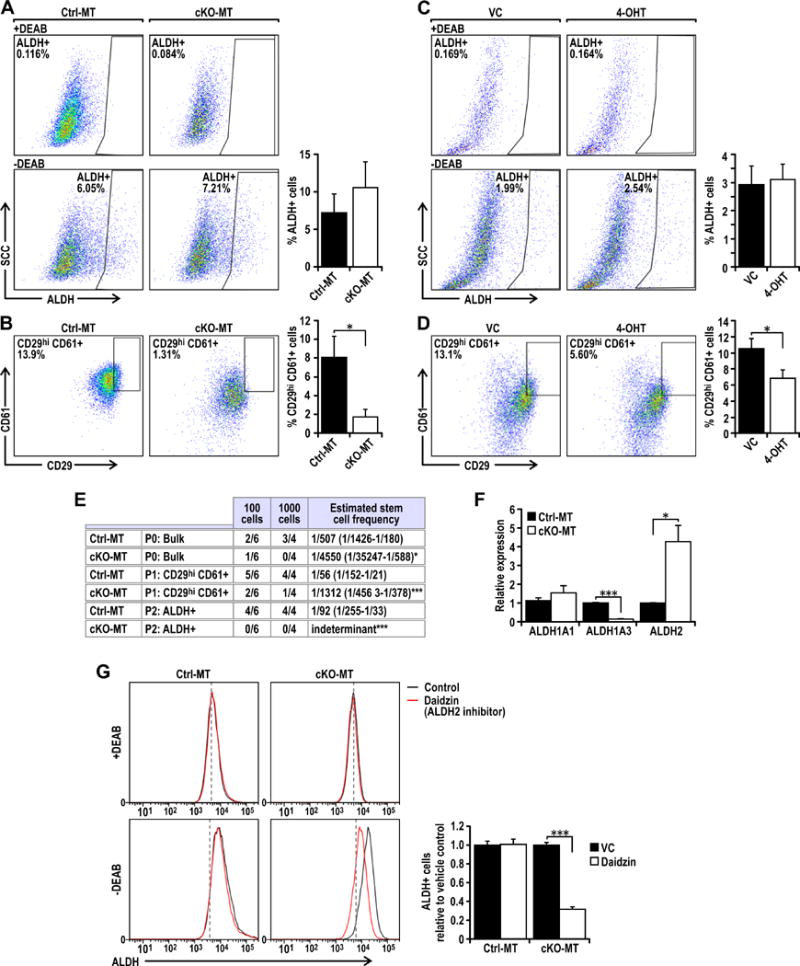
Dot plots showing gated (A) ALDH+ or (B) CD29hiCD61+ populations from freshly isolated Ctrl-MT (Fip200F/F, PyMT) or cKO-MT (Fip200F/F, MMTV-Cre, PyMT) tumors. Bar charts show percentage marker positive cells (n=5 tumors for each group). Dot plots showing gated (C) ALDH+ or (D) CD29hiCD61+ populations from Fip200F/F, PyMT, Cre-ER treated with vehicle control (VC) or 4-hydroxytamoxifen (4-OHT). Bar charts show percentage marker positive cells (n=6 for each group). (E) Table showing limiting dilution transplants of sorted P0: ALDH− Non-CD29hiCD61+, P1: ALDH− CD29hiCD61+ and P2: ALDH+ Non-CD29hiCD61+ populations from Ctrl-MT and cKO-MT cells. Ctrl-MT and cKO-MT cells were sorted and orthotopically transplanted into the fourth mammary glands of athymic Nude mice. The frequency of tumor formation after 3 months was recorded and CSC frequency was calculated using ELDA software. Statistical significance was determined by pairwise Chi-squared test between Ctrl-MT and cKO-MT of respective populations, * denotes p≤0.05 and *** denotes p≤0.001. (F) qRT-PCR analysis of Aldh1a1, Aldh1a3 and Aldh2 transcript levels from Ctrl-MT (Vehicle treated FIP200F/F, PyMT, Cre-ER) or cKO-MT (4-OHT treated FIP200F/F, PyMT, Cre-ER) cells. Data points represent n=6 for each group. (G) Histograms showing ALDH positivity in Ctrl-MT (Vehicle treated FIP200F/F, PyMT, Cre-ER) or cKO-MT (4-OHT treated FIP200F/F, PyMT, Cre-ER) cells with or without 100 μM Daidzin (Aldh2 inhibitor) treatment along with respective +DEAB negative controls. The proportion of ALDH+ cells relative to vehicle controls were quantified for Ctrl-MT and cKO-MT cells (n=6 per group). Statistical significance was determined by two-tailed t-test, * denotes p≤0.05,*** denotes p≤0.001.
In order to characterize the different BCSC populations in PyMT tumors in more detail, we performed RNA-sequencing experiments to identify differentially expressed genes between CD29hiCD61+ BCSCs (P1), ALDH+ BCSCs (P2) and the bulk tumor cells (P0). Interestingly, the differentially expressed genes illustrate a hierarchical difference between these populations, similar to differences observed in the hierarchy of normal mammary epithelial cells (28). Comparison of CD29hiCD61+ BCSCs (P1) with bulk tumor cells (P0) identifies the P1 population as being more mammary stem cell (MaSC) like (Figure 2G). On the other hand, ALDH+ BCSCs (P2) had a gene expression which is more associated with both MaSC and luminal progenitors when compared with P0 (Figure 2G), suggesting that these cells may have features associated with primitive luminal progenitors. Direct comparison of the two BCSC populations, P2 with P1, indicates that P2 BCSCs are more luminal progenitor like and P1 BCSCs are more MaSC-like (Figure 2G). Altogether, these findings illustrate the existence of distinct BCSC populations with differing hierarchical/EMT states in PyMT tumors. Namely, CD29hiCD61+ BCSCs were more MaSC-like, mesenchymal and invasive whereas ALDH+ BCSCs were more closely associated with luminal progenitors and relatively less invasive.
Autophagy inhibition by FIP200 deletion impairs the tumor initiating potential of ALDH+ and CD29hiCD61+ CSCs in MMTV-PyMT tumors
Autophagy has been shown to play both tumor suppressive and promoting functions under different contexts (12). We recently found that inhibition of autophagy by deletion of FIP200, an essential gene for autophagy induction, decreased tumor development and progression in MMTV-PyMT driven mammary tumors (14). To examine whether autophagy contributes to the tumorigenicity of these tumors through regulation of the two BCSC populations with differing characteristics, we analyzed ALDH+ and CD29hiCD61+ BCSCs in MMTV-PyMT tumors with conditional knockout of FIP200 driven by MMTV-Cre (herein referred to as cKO-MT tumors) (14). We found comparable levels of ALDH+ cells in Ctrl-MT and cKO-MT tumors (Figure 3A), suggesting that autophagy is not important in the maintenance of ALDH+ BCSCs. However, a significant decrease in CD29hiCD61+ BCSCs was observed in cKO-MT tumors (Figure 3B). To ensure that the reduced BCSC content was caused by intrinsic defects of FIP200-null tumor cells, we also examined our newly developed FIP200f/f;PyMT;CreER mammary tumor cells (23) following 4-hydroxytamoxifen (4-OHT) treatment to induce FIP200 deletion in vitro. The degree of autophagy inhibition in 4-OHT treated cells is illustrated by p62 accumulation and inhibition of LC3 I conversion to LC3 II under both normal and sphere culture conditions (Figures S4). We found that deletion of FIP200 in these cells did not affect the percentage of ALDH+ BCSCs, but significantly reduced CD29hiCD61+ BCSCs compared to the isogenic (vehicle treated) control cells (Figures 3C and 3D). To further investigate if FIP200 deletion affects self-renewal and tumorigenicity of BCSCs in vivo, ALDH+, CD29hiCD61+ or bulk cKO-MT (i.e. FIP200f/f;PyMT;CreER mammary tumor cells treated with 4-OHT) and Ctrl-MT (i.e. vehicle-treated FIP200f/f;PyMT;CreER mammary tumor cells) tumor cells were transplanted at limiting dilutions into mammary fat pads of recipient nude mice and monitored for tumorigenesis. Whereas ALDH+ and CD29hiCD61+ BCSCs from Ctrl-MT mice generated tumors in the majority of recipient mice, ALDH+ and CD29hiCD61+ BCSCs from cKO-MT mice only induced tumor formation in a small fraction of recipients (Figure 3E). Bulk tumor cells from cKO-MT and Ctrl-MT mice also only generated tumors in a smaller fraction of recipients, although a statistically significant reduction was also observed in cKO-MT tumor cells. These results indicate that autophagy plays a role in regulating the tumorigenicity of both ALDH+ and CD29hiCD61+BCSC populations.
It was interesting to note that FIP200 deletion did not alter the percentage of ALDH+ cells but it decreased the tumor initiating potential of this population (Figures 3A, 3C and 3E). One possible explanation for this observation is that ALDH+ BCSC characteristics but not ALDH enzymatic activity is dependent on FIP200. However, in breast cancers and normal mammary luminal progenitor cells, the predominant ALDH isoform expressed is Aldh1a3 and the expression of this specific isoform has been implicated with BCSC traits (29–31). In the Aldefluor assay which we used to sort ALDH+ populations, cells were distinguished based on the enzymatic activity of ALDH isoforms that are sensitive to the inhibitor DEAB. There is evidence to indicate that the Aldefluor assay can also detect ALDH2 activity and this lack of specificity may explain the discrepancy we observed (32). Indeed, we found that FIP200 deletion significantly decreased Aldh1aA3 mRNA levels (Figure 3F) and this correlated with the decreased tumor initiating potential of ALDH+ cells from cKO-MT tumors (Figure 3E). Conversely, Aldh2 levels were increased (Figure 3F) and contributed significantly to Aldefluor assay activity, specifically in cKO-MT tumors (Figures 3G). This is illustrated by the reduction of Aldefluor activity in the presence of an Aldh2 inhibitor, Daidzin, in cKO-MT but not Ctrl-MT cells. Together, these results demonstrate that inhibition of autophagy by FIP200 deletion reduced the CSC associated isoform of ALDH (Aldh1a3) and tumor initiating potential of ALDH+ BCSCs.
FIP200 deletion diminishes TGF-β/Smad signaling that is necessary for the CD29hiCD61+ CSC phenotype
Given the recent studies suggesting a role of EMT in promoting characteristics of BCSCs (8), we wondered whether autophagy may regulate CD29hiCD61+ BCSCs through EMT inducing pathways. To examine such a possibility, we explored potential changes in TGF-β signaling, which is a well described EMT inducing pathway. We found that while TGF-β1 exhibited comparable levels in cKO-MT and Ctrl-MT cells, TGF-β2 and TGF-β3 mRNA levels were significantly decreased in cKO-MT cells (Figure 4A). Moreover, we observed a concomitant decrease in Smad2/3 activation in FIP200-null tumor cells compared to control tumor cells (Figure 4B). To further validate the role of TGF-β/Smad signaling in the regulation of the distinct BCSC populations, we silenced Smad4 in control tumor cells and found that the percentage of CD29hiCD61+ BCSCs was diminished (Figures 4C–4D). The tumor initiating potential of CD29hiCD61+ BCSCs was also impaired upon Smad4 knockdown, as indicated by limiting dilution transplant experiments (Figure 1). Interestingly, knockdown of Smad4 did not alter the percentage of ALDH+ cells, Aldh1A3 transcript levels or their tumor initiating potential significantly (Figures 4E–F, Table 1). Addition of recombinant TGF-β restored the decreased content of CD29hiCD61+ BCSCs in cKO-MT cells to a comparable level as in Ctrl-MT cells (Figures 4G–I), suggesting that deficient TGF-β signaling after FIP200 deletion is responsible for the reduced CD29hiCD61+ BCSCs in these cells. Consistent with a lack of effect of Smad4 knockdown on ALDH+ BCSCs, treatment with recombinant TGF-β did not increase the ALDH+ population (but rather decreased it slightly)(Figure 4I). These results suggest that autophagy plays an important role in the maintenance of CD29hiCD61+ BCSCs but not ALDH+ BCSCs through TGF-β/Smad signaling.
Figure 4. Fip200 depletion diminishes TGF-β/Smad signaling that is necessary for the CD29hiCD61+ CSC phenotype.
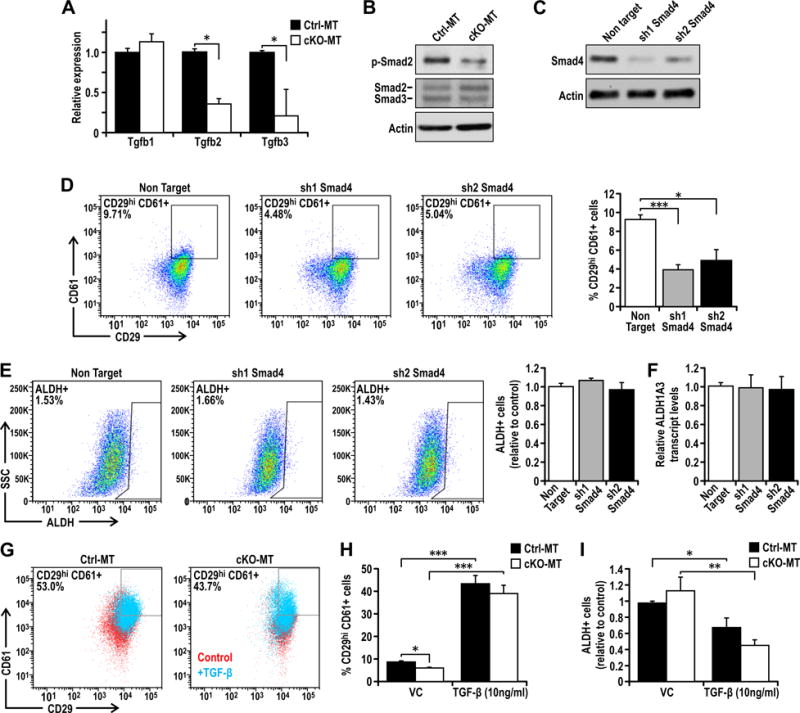
(A) qRT-PCR analysis of Tgfb1, Tgfb2 and Tgfb3 transcript levels from Ctrl-MT or cKO-MT cells. Data points represent n=6 for each group. (B) Immunoblots showing p-Smad2, Smad2/3 and actin levels in Ctrl-MT and cKO-MT cells. (C) Immunoblots showing levels of Smad4 and actin in Ctrl-MT cells stably transduced with non target shRNA, sh1 Smad4 or sh2 Smad4. (D) Dot plots showing CD29 CD61 profiles of Ctrl-MT cells stably transduced with non target shRNA, sh1 Smad4 or sh2 Smad4 along with quantification. (E) Dot plots showing ALDH activity of Ctrl-MT cells stably transduced with non target shRNA, sh1 Smad4 or sh2 Smad4 along with quantification. (F) Bar charts showing the levels of Aldh1a3 isoforms in Ctrl-MT cells stably transduced with non target shRNA, sh1 Smad4 or sh2 Smad4. (G) Dot plots showing CD29 CD61 profiles of Ctrl-MT or cKO-MT cells treated with vehicle control (red) or 10ng/ml TGF-β (cyan) for 72 hours. Quantification of (H) % CD29hiCD61+ cells and (I) % ALDH+ cells in Ctrl-MT or cKO-MT cells treated with vehicle control or 10ng/ml TGF-β for 72 hours. Statistical significance was determined by two-tailed t-test, * denotes p≤0.05, ** denotes p≤0.01 and *** denotes p≤0.001.
Table 1.
Limiting dilution transplants of sorted P0: ALDH− Non-CD29hiCD61+, P1: ALDH− CD29hiCD61+ and P2: ALDH+ Non-CD29hiCD61+ populations from Ctrl-MT cells transduced with either non-target shRNA, sh1 Stat3 or sh1 Smad4
| 500 cells | 1000 cells | 2000 cells | Estimated stem cell frequency | |
|---|---|---|---|---|
| P1: CD29hi CD61+ | ||||
| Non Target | 3/3 | 3/3 | 3/3 | 1 (1/696-1) |
| shSTAT3 | 1/3 | 3/3 | 3/3 | 1/153 (1/1322-1/213) |
| shSmad4 | 1/3 | 1/3 | 3/3 | 1/1169 (1/2919-1/468)** |
| P2: ALDH+ | ||||
| Non Target | 2/3 | 3/3 | 3/3 | 1/345 (1/955-1/125) |
| shSTAT3 | 0/3 | 1/3 | 1/3 | 1/4453 (1/17891-1/1190)*** |
| shSmad4 | 2/3 | 2/3 | 3/3 | 1/609 (1/1492-1/249) |
| P0: Bulk | ||||
| Non Target | 1/3 | 2/3 | 2/3 | 1/1325 (1/3378-1/520) |
| shSTAT3 | 1/3 | 2/3 | 1/3 | 1/1998 (1/5643-1/708) |
| shSmad4 | 0/3 | 1/3 | 1/3 | 1/4453 (1/17891-1/1109) |
Ctrl-MT cells transduced with either non-target shRNA, sh1 Stat3 or sh1 Smad4cells were sorted and orthotopically transplanted into the fourth mammary glands of athymic Nude mice. The frequency of tumor formation after 3 months was recorded and CSC frequency was calculated using ELDA software. Statistical significance was determined by pairwise Chi-squared test between non-target shRNA and respective knockdowns,
denotes p≤0.01 and
denotes p≤0.001.
FIP200 deletion impairs Stat3 activation which is essential for the tumor initiating potential of ALDH+ cells
We next investigated whether altered Stat3 signaling is responsible for the decreased tumorigenicity of ALDH+ BCSCs upon deletion of FIP200, as both the BCSC properties and Aldh1a3 levels of ALDH+ cells can be regulated by Stat3 signaling (33,34). In FIP200 cKO-MT cells, we observed decreased phospho Stat3 levels (Figure 5A), suggesting that FIP200 is required to sustain Stat3 signaling in PyMT cells. IL6/Jak2 pathway has been implicated in the regulation of BCSCs (9,35). However, we did not observe changes in Jak2 activation, but detected a slightly decreased level of Socs3 in cKO-MT cells, excluding their possible role in mediating the reduced Stat3 signaling in these cells. Interestingly, we found that both phospho Egfr and total Egfr levels were decreased in these cells, raising the possibility that FIP200 regulates Stat3 through Egfr. To further explore this possibility, we examined Stat3 signaling and Aldh1a3 levels upon silencing Egfr in Ctrl-MT cells. We found that knockdown of Egfr led to decreased phospho Stat3 and Aldh1a3 transcript levels, indicating that Egfr is a major stimulus for Stat3 activation in these cells (Figures 5B–C). Moreover, ectopic expression of wild type Egfr in cKO-MT cells was sufficient to elevate Stat3 phosphorylation and Aldh1a3 transcript levels (Figures 5D–E). The requirement for Stat3 in the regulation of Aldh1a3 and tumorigenicity of ALDH+ BCSCs was also demonstrated by silencing of Stat3 in Ctrl-MT cells, where cells transduced with sh1 Stat3 led to significant reductions in Aldh1a3 transcript levels (Figures 5F–G) and tumor initiating potential in vivo (Table 1). Together, these results suggest that deficient Stat3 signaling is responsible for the reduced tumor initiating capacity of ALDH+ BCSCs upon FIP200 deletion.
Figure 5. Fip200 depletion impairs Stat3 activation which is essential for ALDH+ CSC properties.
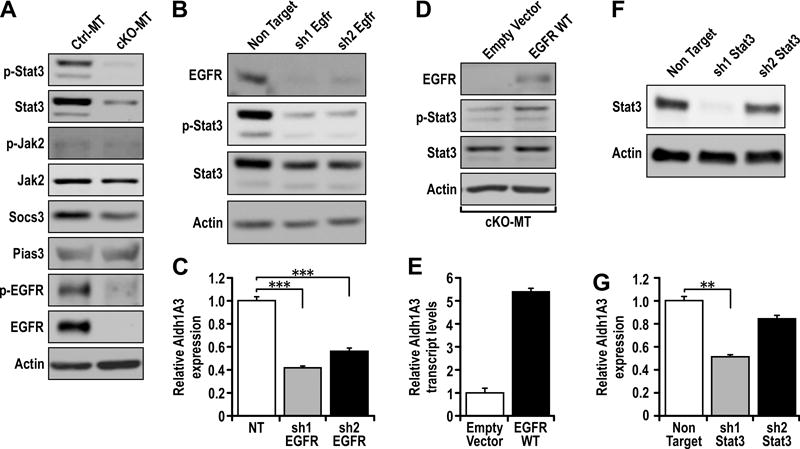
(A) Immunoblots showing p-Stat3, Stat3, p-EGFR, EGFR, p-Jak2, Jak2, Socs3, Pias3 and actin levels in Ctrl-MT and cKO-MT cells. (B) Immunoblots showing levels of Egfr, p-Stat3, Stat3, p-Smad2/3, Smad2/3 and actin in Ctrl-MT cells stably transduced with non target shRNA, sh1 Egfr or sh2 Egfr. (C) qRT-PCR analysis of Aldh1a3 transcript levels in Ctrl-MT cells stably transduced with non target shRNA, sh1 Egfr or sh2 Egfr. (D) Immunoblots showing EGFR, p-Stat3, Stat3 and actin levels in cKO-MT cells transfected with empty vector or EGFR-WT plasmid. (E) qRT-PCR analysis of Aldh1a3 transcript levels in cKO-MT cells transfected with empty vector or EGFR-WT plasmid. (F) Immunoblots showing Stat3 and actin levels in Ctrl-MT cells stably transduced with non target shRNA, sh1 Stat3 or sh2 Stat3. (G) qRT-PCR analysis Aldh1a3 transcript levels in Ctrl-MT cells stably transduced with non target shRNA, sh1 Stat3 or sh2 Stat3. Statistical significance was determined by two-tailed t-test, * denotes p≤0.05, ** denotes p≤0.01 and *** denotes p≤0.001.
Combinatorial targeting of distinct BCSCs with Stat3 and TGF-βR inhibitors enhances therapeutic outcomes
Our above observations indicate that ALDH+ and CD29hiCD61+ BCSCs which coexist in MMTV-PyMT tumors depend on EGFR/Stat3 and TGF-β/Smad signaling respectively. These findings have important implications because the differential dependence could lead to therapeutic resistance and tumor relapse if both populations are not effectively eliminated. As such, we went on to address whether combinatorial targeting of ALDH+ and CD29hiCD61+ BCSCs with Stattic (Stat3 inhibitor) and LY-2157299 (TGF-βR1 inhibitor) can lead to better therapeutic responses. From colony forming assays, we found that LY-2157299 in combination with Stattic led to a greater reduction in the number of colonies formed when compared to either inhibitor alone (Figures 6A). Interestingly, when the types of colonies that formed were analyzed (Figure 6B), we found that LY-2157299 treatment resulted in formation of mostly epithelial colonies whereas Stattic treatment promoted the formation of mesenchymal colonies (Figure 6C). This observation is in line with our finding that TGF-β/Smad signaling promotes characteristics of mesenchymal BCSCs (CD29hiCD61+) and Egfr/Stat3 regulates the epithelial BCSC population (ALDH+).
Figure 6. Combinatorial targeting of distinct BCSCs with Stat3 and TGF-βR inhibitors enhances therapeutic outcomes.
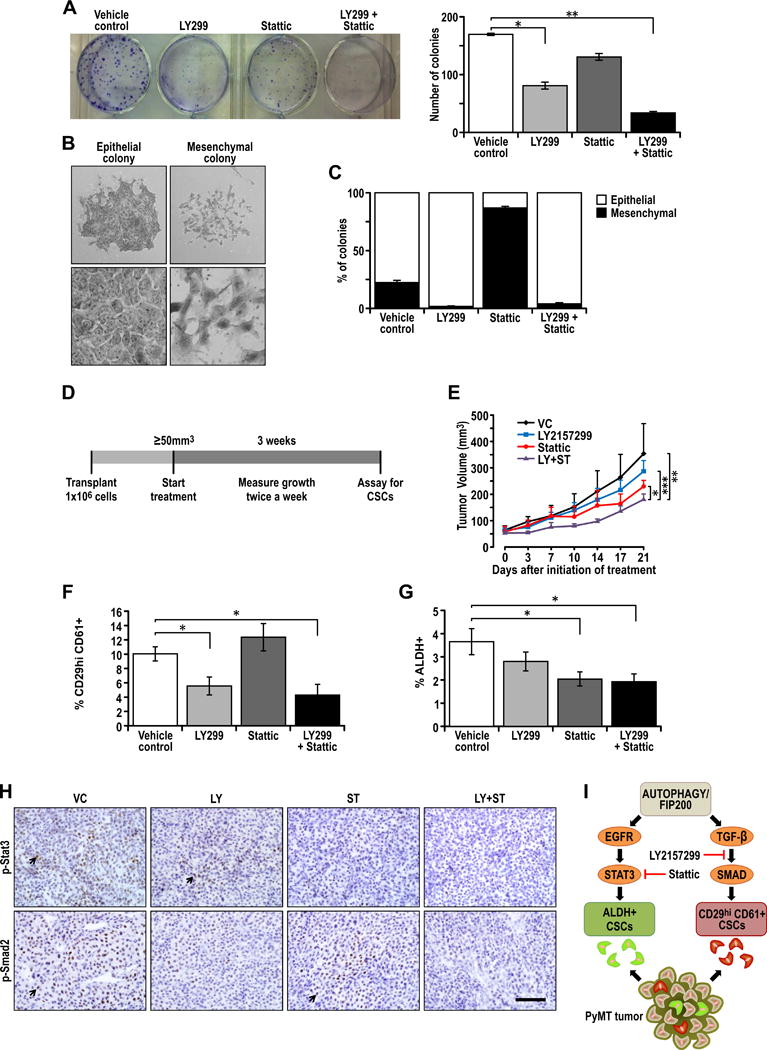
(A) Ctrl-MT cells were seeded at a density of 1000 cells/well in a 6-well plate and treated with vehicle, 20μM LY2157299, 1μM Stattic or the combination of both LY2157299 and Stattic, and the number of colonies formed after one week were analyzed. Representative image of the number of colonies formed after respective treatments along with quantification of the number of colonies formed after treatment with vehicle, 20μM LY2157299, 1μM Stattic or the combination of both LY2157299 and Stattic. (B) Representative images showing epithelial and mesenchymal colonies and high magnification images of epithelial and mesenchymal cell types in colony forming assays. (C) Bar chart showing the percentage of epithelial and mesenchymal colonies that formed after treated with vehicle, 20μM LY2157299, 1μM Stattic or the combination of both LY2157299 and Stattic. (E) Experimental outline for therapeutic assessment of inhibitors in vivo. 1×10⁶ Ctrl-MT cells were injected orthotopically into the fourth mammary gland of athymic Nude mice and mice were randomized into respective treatment groups when the tumor sizes were ≥50mm3. The treatment regime lasted for 21 days and tumors were then analyzed for CSC content. (E) Growth curves for respective treatment cohorts; vehicle control (VC), LY2157299 (100mg/kg, b.i.d.), Stattic (20mg/kg, q.d.) and LY+ST (100mg/kg, LY2157299 b.i.d. + 20mg/kg, Stattic q.d.). (n=5 per cohort). (F) Quantification of percentage CD29hiCD61+ cells in tumors after 21 days of vehicle, LY2157299, Stattic or LY215729+Stattic treatment. (n=5 per cohort). (G) Quantification of percentage ALDH+ cells in tumors after 21 days of vehicle, LY2157299, Stattic or LY215729+Stattic treatment. (n=5 per cohort). Statistical significance for growth curves were determined via ANCOVA. Apart from analysis of tumor growth curves, statistical significance was determined by two-tailed t-test, * denotes p≤0.05, ** denotes p≤0.01 and *** denotes p≤0.001. (H) Immuno-staining of p-Stat3 and p-Smad2 in tumors treated with vehicle, LY2157299, Stattic or LY2157299+Stattic treatment. (I) Summary and model showing combinatorial targeting of distinct ALDH+ and CD29hiCD61+ BCSCs with differential dependencies on Egfr/Stat3 and TGF-β/Smad signaling respectively.
In a pre-clinical setting, the effects of combining these two inhibitors were examined in vivo by treating transplanted PyMT tumors in nude mice when the size of tumors was about 50mm3 (Figure 6D). Administration of either LY-2157299 or Stattic alone did not result in significant reductions in tumor volume (Figure 6E). However, the combination of both inhibitors impaired tumor growth significantly (Figure 6E). After 21 days of treatment, the percentage of CD29hiCD61+ and ALDH+ BCSCs were analyzed. Tumors treated with LY-2157299 or the combination of inhibitors significantly reduced the percentage of CD29hiCD61+ BCSCs (Figure 6F), an effect not seen in tumors treated with Stattic alone. On the other hand, only cohorts that received Stattic or the combination of drugs were effective in significantly reducing ALDH+ BCSCs (Figure 6G). Tumors that were treated with Stattic displayed dimished p-Stat3 staining, whereas tumors treated with LY-2157299 had dimished p-Smad2 staining, illustrating the efficacy of respective inhibitors at the doses administered (Figure 6H). These results indicate that the combination of LY-2157299 and Stattic may be more effective due to its ability to target both CD29hiCD61+ and ALDH+ BCSCs which depend on TGFβ/Smad and Stat3 signaling respectively (Figure 6I).
Discussion
The proposed CSC concept has played a significant role in the recent advance of cancer research, despite concerns on their existence or utility in some cancers (7,36,37). In this study, we describe for the first time that ALDH+ and CD29hiCD61+, two widely used markers for BCSCs, enrich for two distinctive BCSC populations with minimal overlap in one mouse model of breast cancer, but that only CD29hiCD61+ markers enriched for BCSCs in another model. These results suggest that various markers (even those frequently employed) may not identify all CSCs, which may contribute to some potential conflicting data concerning the existence and/or role of CSCs.
Although sharing some common features like reduced proliferation compared to bulk tumor cells, CD29hiCD61+ and ALDH+ BCSCs displayed differential properties with CD29hiCD61+ BCSCs exhibiting increased invasive activity and expression of mesenchymal markers. Interestingly, these distinct BCSC populations have expression profiles which are associated with MaSCs and luminal progenitors respectively. The fact that both BCSC populations have expression profiles associated wih less differentiated cells in the mammary cell hierarchy suggests that a de-differentiation process confers increased tumor initiating potential, consistent with the CSC hypothesis. However, due to different degrees of de-differentiation (i.e. MaSC and luminal progenitor), it is possible that BCSCs with differing properties may exist within a tumor. These findings may have potential clinical implications because it suggests that cells with luminal and basal-like characteristics respectively may co-exist and that multiple disease subtypes which require different treatment modalities may be present within a same tumor. Accordingly, the two BCSC populations were found to be differentially reliant on separate signaling pathways. Stat3 inhibition either through genetic or pharmacological means decreased the ALDH+ BCSCs and their tumor initiating activities, but not CD29hiCD61+ BCSCs, in MMTV-PyMT tumors. This agrees with previous findings implicating a role for Stat3 in ALDH+ BCSCs of breast and non-small cell lung tumors (33,34,38). Conversely, CD29hiCD61+ BCSCs, but not ALDH+ BCSCs, were preferentially inhibited by interfering with the TGF-β/Smad pathway in MMTV-PyMT tumors. It is notable that the markers used to isolate BCSCs with more mesenchymal features in this study were CD29 (β1-Integrin) and CD61 (β3-Integrin). The CD29 expression levels distinguish high expressing basal cells from low expressing luminal cells. While CD61 has been initially characterized as a luminal progenitor marker in normal mammary epithelial cells of virgin female mice (27), more recently CD29hiCD61+ cells have been shown to be pregnancy associated mammary stem cells (MaSCs) (39). Apart from being a putative BCSC marker in mouse models (24,26,27), CD61 is a functional marker where its expression has been shown to be regulated by TGF-β2 and it contributes to BCSC properties through regulation of the EMT associated transcription factor Slug (39). Therefore, the dependence of CD29hiCD61+ BCSCs on the TGF-β/Smad pathway could possibly be due to the role of CD61 in regulating EMT associated pathways and stemness.
In further support of the different characteristics of the ALDH+ and CD29hiCD61+ BCSCs, we found that while it affected both BCSCs, which is consistent with a number of previous reports (20,21,40), inhibition of autophagy by FIP200 deletion compromised ALDH+ and CD29hiCD61+ BCSCs through defects in the Stat3 and TGF-β/Smad pathways, respectively. Regulation of Stat3 by autophagy in breast cancer cells have been previously reported and this can be mediated by IL-6 secretion that is controlled by autophagy related proteins (18). However, secretion of IL-6 was increased (data not shown), despite reduced phospho-Stat3 in FIP200-null MMTV-PyMT tumor cells. This indicates that the regulation of IL-6 secretion is context dependent and indeed this was shown in a recent study comparing the effects of Atg7 or Beclin1 knockdown in two breast cancer cell lines (40). In MCF7 cells, silencing of autophagy genes led to increased IL-6 secretion whereas in MDA-MB-468 cells, the reverse was observed. It is also worth noting that Atg5 deletion in HRasG12V transformed immortalized baby mouse kidney epithelial cells (iBMK) led to increased IL-6 secretion in the presence of inflammatory stimuli (41). In the current study however, the increased IL-6 secretion upon FIP200 deletion does not contribute significantly to Stat3 phosphorylation and we can attribute this to low levels of IL6RA expression. On the other hand, we found that autophagy inhibition reduces Stat3 activation through decreased EGFR levels in MMTV-PyMT tumor cells. It is possible that autophagy inhibition leads to accumulation of the autophagy adapter protein Cbl, a well characterized ubiquitin ligase that promotes lysosomal degradation of EGFR (42,43), resulting in enhanced EGFR degradation and consequent decrease in Stat3 activation after autophagy inhibition.
Several lines of evidence have implicated a role for autophagy in the regulation of EMT at separate levels. In hepatocellular carcinoma cell lines, starvation induced autophagy could increase TGF-β levels which is required for induction of EMT and invasiveness (16). Apart from regulating TGF-β cytokine levels, silencing of autophagy related genes has also been shown to impair TGF-β induced expression of Vimentin and human BCSCs enriched by CD24−/CD44+ markers (29). In MMTV-PyMT tumor cells, we observed that FIP200 deletion led to decreased TGF-β2 and TGF-β3 expression, suggesting that FIP200 regulates the TGF-β/Smad pathway at least in part through TGF-β2 and TGF-β3 transcript levels. The fact that TGF-β1 levels were not affected upon FIP200 deletion in these cells suggests that autophagy governs the activity of a transcription factor that can bind to TGF-β2 and TGF-β3 promoters but not the TGF-β1 promoter. In view of that, cyclic AMP responsive elements (CREs) which can be bound by CREB/Atf1 transcription factors have been described in promoter regions of just TGF-β2 and TGF-β3 but not TGF-β1 (44). It will be interesting to investigate these intermediate mechanisms since cross regulation between autophagy and CREB is possible (45).
We have shown that autophagy can regulate the separate pathways utilized by distinct BCSCs but it does not occur at critical nodes within the respective signaling cascades. From the mechanisms by which autophagy regulate BCSCs that we have shown in this study, it is possible that some redundancies may exist. For instance, paracrine TGF-β secretion by other cell types within the tumor microenvironment may be sufficient to bypass the need for autophagy in CD29hiCD61+ BCSCs. As for the Stat3 pathway, activation by IL6 rather than EGFR may compensate for the maintenance of ALDH+ BCSCs. For that reason, we explored the potential of combining inhibitors which can target nodes in the TGFβ and Stat3 pathways respectively. As we showed that ALDH+ BCSCs were more epithelial and dependent on Egfr/Stat3 signaling, it is coherent that Stattic treatment led to decreased epithelial colonies and enrichment of mesenchymal colonies in colony forming assays in vitro. On the other hand, LY-2157299 was effective in diminishing the number of mesenchymal colonies, concordant with our findings that CD29hiCD61+ BCSCs are dependent on the TGF-β/Smad pathway. The heterogeneity that is present due to the existence of distinct BCSCs is likely to exacerbate therapeutic resistance. This is illustrated by the limited effectiveness of either LY-2157299 or Stattic alone on both BCSC populations. The decreased tumor growth in vivo and reduction of both ALDH+ as well as CD29hiCD61+ BCSCs was only achieved when LY-2157299 was used in combination with Stattic.
The drug combination studies were carried out in a T-cell deficient setting and this nullifies a substantial portion of the systemic effects of these inhibitors on immuno-suppression. While this is beneficial in helping us address the effects of Stattic and LY-2157299 in combination on distinct BCSCs, it is possible that additional therapeutic responses can be obtained with this drug combination in an immune competent setting because the inhibitors used target pathways that are important for immunosuppressive cells (46,47). It would be interesting to test both potential immuno-therapies, Stattic and LY-2157299, in combination in an immune competent setting.
It is worth noting that upon transplantation of the sorted populations, the tumors that arise have similar histology, recapitulate marker profiles of parental tumors and display continuous activation of CSC related pathways (see Figures S2 and S3). This indicates that the characteristics of sorted populations are not due to permanent changes at the genetic level and there is plasticity between the different BCSC populations as well as the bulk tumor cells.
Recent studies in human breast cancers showed that CD24−/CD44+ BCSCs are associated with the basal-like phenotype, whereas ALDH+ cells correlate with luminal tumor subtypes (10,48). Moreover, CD24−/CD44+ BCSCs also display EMT-associated features in human breast tumors (10). Although CD24−/CD44+ markers are not applicable in mouse models (49), the CD29hiCD61+ markers we used in this study enriches for a BCSC population that is more invasive and express higher levels of EMT associated genes. We also found that this population can expand after TGF-β treatment, suggesting that it is a mesenchymal BCSC population similar to CD24−/CD44+ BCSCs described in human tumors and CD29hiCD61+ (48) can be utilized in immune-competent mouse models of breast cancer to identify mesenchymal BCSCs. On the other hand, whereas several previous reports indicate that IL6/Stat3 signaling can regulate the more mesenchymal CD24−/CD44+ BCSC population in human breast cancer cells (9,35), we only observed a marginal effect on the tumorigenicity of the CD29hiCD61+ population after Stat3 knockdown, albeit not significantly. Based on our observations that Stat3 activation is sustained by EGFR and not through IL6/Jak2 in MMTV-PyMT tumor cells, it is possible that these differences are due to additional IL6 downstream signals that are not induced by the EGFR pathway. We also cannot exclude the possibility that CD29hiCD61+ cells are not a direct correlate for CD24−/CD44+ cells, despite both of these populations being mesenchymal BCSCs.
BCSCs, defined as cells which are less differentiated and more tumorigenic than the bulk population, can possibly represent distinct entities depending on the cell of origin and the degree as well as direction of de-differentiation (7). The characterization of these distinct BCSC populations in the MMTV-PyMT tumors provides support to the idea that multiple BCSC/progenitor-like populations with differing states on the EMT spectrum can be present and contribute to the heterogeneity within breast tumors (7). To our knowledge, this is the first time in which distinct co-existing BCSC populations have been described in the highly metastatic MMTV-PyMT model and this allows the study of these distinct entities in an immune-competent host. Accordingly, this is advantageous when investigating immune system modulated niches that regulate these heterogeneous BCSC populations and whether BCSCs exhibit unique immune tolerance or resistance to immune therapies (50).
On the whole, our findings support the notion that distinct BCSCs with differing characteristics and susceptibility to therapies can co-exist within tumors. Accordingly, it would not be appropriate to consider CSCs as a single entity. While we have described ALDH+ and CD29hiCD61+ BCSCs and their differences in PyMT tumors, we have not exhausted and addressed all reported BCSC markers in our models and such a systematic effort may unravel higher degrees of complexity. With a better understanding of the heterogeneity and the specific susceptibility of varying sub-populations, therapeutic combinations may then be utilized to prevent drug resistance.
Supplementary Material
Acknowledgments
We would like to thank Dr. Yi Li of Baylor College of Medicine for his kind gift of MMTV-Wnt1 mice, Eli Lilly for providing LY-2157299, and the University of Cincinnati LAMS staff for their support. We appreciate the help from Glenn Doerman in preparation of figures. We are grateful to Drs. Chenran Wang, Shaogang Sun and Hsin-Jung Wu for critical appraisal and suggestions in the preparation of this manuscript. We appreciate the assistance from the Laboratory for Statistical Genomics and Systems Biology as well as the Genomics, Epigenomics and Sequencing Core in University of Cincinnati funded by NIEHS grant P30-ES006096 to Shuk-Mei Ho. The work in this study is funded by NIH grants R01CA150926 and R01CA163493 to J.-L. Guan.
Footnotes
The authors declare no conflicts of interests for this work.
References
- 1.Ferlay J, Soerjomataram I, Dikshit R, Eser S, Mathers C, Rebelo M, et al. Cancer incidence and mortality worldwide: sources, methods and major patterns in GLOBOCAN 2012. Int J Cancer. 2015;136(5):E359–86. doi: 10.1002/ijc.29210. [DOI] [PubMed] [Google Scholar]
- 2.Chen J, Li Y, Yu T-S, McKay RM, Burns DK, Kernie SG, et al. A restricted cell population propagates glioblastoma growth after chemotherapy. doi: 10.1038/nature11287. [DOI] [PMC free article] [PubMed] [Google Scholar]
- 3.Diehn M, Cho RW, Lobo NA, Kalisky T, Dorie MJ, Kulp AN, et al. Association of reactive oxygen species levels and radioresistance in cancer stem cells. Nature. 2009;458(7239):780–83. doi: 10.1038/nature07733. [DOI] [PMC free article] [PubMed] [Google Scholar]
- 4.Li X, Lewis MT, Huang J, Gutierrez C, Osborne CK, Wu MF, et al. Intrinsic resistance of tumorigenic breast cancer cells to chemotherapy. J Natl Cancer Inst. 2008;100(9):672–79. doi: 10.1093/jnci/djn123. [DOI] [PubMed] [Google Scholar]
- 5.Al-Hajj M, Wicha MS, Benito-Hernandez A, Morrison SJ, Clarke MF. Prospective identification of tumorigenic breast cancer cells. PNAS. 2003;100(7):3983–88. doi: 10.1073/pnas.0530291100. [DOI] [PMC free article] [PubMed] [Google Scholar]
- 6.Chen D, Bhat-Nakshatri P, Goswami C, Badve S, Nakshatri H. ANTXR1, a stem cell-enriched functional biomarker, connects collagen signaling to cancer stem-like cells and metastasis in breast cancer. Cancer Res. 2013;73(18):5821–33. doi: 10.1158/0008-5472.CAN-13-1080. [DOI] [PMC free article] [PubMed] [Google Scholar]
- 7.Brooks MD, Burness ML, Wicha MS. Therapeutic Implications of Cellular Heterogeneity and Plasticity in Breast Cancer. Cell Stem Cell. 2015;17(3):260–71. doi: 10.1016/j.stem.2015.08.014. [DOI] [PMC free article] [PubMed] [Google Scholar]
- 8.Mani SA, Guo W, Liao MJ, Eaton EN, Ayyanan A, Zhou AY, et al. The epithelial-mesenchymal transition generates cells with properties of stem cells. Cell. 2008;133(4):704–15. doi: 10.1016/j.cell.2008.03.027. [DOI] [PMC free article] [PubMed] [Google Scholar]
- 9.Iliopoulos D, Hirsch HA, Wang G, Struhl K. Inducible formation of breast cancer stem cells and their dynamic equilibrium with non-stem cancer cells via IL6 secretion. Proceedings of the National Academy of Sciences. 2011;108(4):1397–402. doi: 10.1073/pnas.1018898108. [DOI] [PMC free article] [PubMed] [Google Scholar]
- 10.Liu S, Cong Y, Wang D, Sun Y, Deng L, Liu Y, et al. Breast Cancer Stem Cells Transition between Epithelial and Mesenchymal States Reflective of their Normal Counterparts. Stem Cell Reports. 2014;2(1):78–91. doi: 10.1016/j.stemcr.2013.11.009. [DOI] [PMC free article] [PubMed] [Google Scholar]
- 11.Levine B, Kroemer G. Autophagy in the pathogenesis of disease. Cell. 2008;132(1):27–42. doi: 10.1016/j.cell.2007.12.018. [DOI] [PMC free article] [PubMed] [Google Scholar]
- 12.White E. Deconvoluting the context-dependent role for autophagy in cancer. Nat Rev Cancer. 2012;12(6):401–10. doi: 10.1038/nrc3262. [DOI] [PMC free article] [PubMed] [Google Scholar]
- 13.Karantza-Wadsworth V, Patel S, Kravchuk O, Chen G, Mathew R, Jin S, et al. Autophagy mitigates metabolic stress and genome damage in mammary tumorigenesis. Genes Dev. 2007;21(13):1621–35. doi: 10.1101/gad.1565707. [DOI] [PMC free article] [PubMed] [Google Scholar]
- 14.Wei H, Wei S, Gan B, Peng X, Zou W, Guan J. Suppression of autophagy by FIP200 deletion inhibits mammary tumorigenesis. Genes Dev. 2011;25:1510–27. doi: 10.1101/gad.2051011. [DOI] [PMC free article] [PubMed] [Google Scholar]
- 15.Fung C, Lock R, Gao S, Salas E, Debnath J. Induction of autophagy during extracellular matrix detachment promotes cell survival. Mol Biol Cell. 2008;19(3):797–806. doi: 10.1091/mbc.E07-10-1092. [DOI] [PMC free article] [PubMed] [Google Scholar]
- 16.Peng YF, Shi YH, Ding ZB, Ke AW, Gu CY, Hui B, et al. Autophagy inhibition suppresses pulmonary metastasis of HCC in mice via impairing anoikis resistance and colonization of HCC cells. Autophagy. 2013;9(12):2056–68. doi: 10.4161/auto.26398. [DOI] [PubMed] [Google Scholar]
- 17.Macintosh RL, Timpson P, Thorburn J, Anderson KI, Thorburn A, Ryan KM. Inhibition of autophagy impairs tumor cell invasion in an organotypic model. Cell Cycle. 2012;11(10):2022–9. doi: 10.4161/cc.20424. [DOI] [PMC free article] [PubMed] [Google Scholar]
- 18.Lock R, Roy S, Kenific CM, Su JS, Salas E, Ronen SM, et al. Autophagy facilitates glycolysis during Ras-mediated oncogenic transformation. Mol Biol Cell. 2011;22(2):165–78. doi: 10.1091/mbc.E10-06-0500. [DOI] [PMC free article] [PubMed] [Google Scholar]
- 19.Amaravadi RK, Lippincott-Schwartz J, Yin XM, Weiss WA, Takebe N, Timmer W, et al. Principles and current strategies for targeting autophagy for cancer treatment. Clin Cancer Res. 2011;17(4):654–66. doi: 10.1158/1078-0432.CCR-10-2634. [DOI] [PMC free article] [PubMed] [Google Scholar]
- 20.Cufi S, Vazquez-Martin A, Oliveras-Ferraros C, Martin-Castillo B, Vellon L, Menendez J. Autophagy positively regulates the CD44(+) CD24(−/low) breast cancer stem-like phenotype. Cell Cycle. 2011;10(22):3871–85. doi: 10.4161/cc.10.22.17976. [DOI] [PubMed] [Google Scholar]
- 21.Gong C, Bauvy C, Tonelli G, Yue W, Delomenie C, Nicolas V, et al. Beclin1 and autophagy are required for the tumorigenicity of breast cancer stem-like/progenitor cells. Oncogene. 2013;32(18):2261–72. doi: 10.1038/onc.2012.252. [DOI] [PMC free article] [PubMed] [Google Scholar]
- 22.Greulich H, Chen TH, Feng W, Jänne PA, Alvarez JV, Zappaterra M, et al. Oncogenic transformation by inhibitor-sensitive and -resistant EGFR mutants. PLoS Med. 2005;2(11):e313. doi: 10.1371/journal.pmed.0020313. [DOI] [PMC free article] [PubMed] [Google Scholar]
- 23.Wei H, Wang C, Croce CM, Guan JL. p62/SQSTM1 synergizes with autophagy for tumor growth in vivo. Genes Dev. 2014;28(11):1204–16. doi: 10.1101/gad.237354.113. [DOI] [PMC free article] [PubMed] [Google Scholar]
- 24.Luo M, Fan H, Nagy T, Wei H, Wang C, Liu S, et al. Mammary epithelial-specific ablation of the focal adhesion kinase suppresses mammary tumorigenesis by affecting mammary cancer stem/progenitor cells. Cancer Res. 2009;69(2):466–74. doi: 10.1158/0008-5472.CAN-08-3078. [DOI] [PMC free article] [PubMed] [Google Scholar]
- 25.Hu Y, Smyth GK. ELDA: extreme limiting dilution analysis for comparing depleted and enriched populations in stem cell and other assays. J Immunol Methods. 2009;347(1–2):70–8. doi: 10.1016/j.jim.2009.06.008. [DOI] [PubMed] [Google Scholar]
- 26.Kouros-Mehr H, Bechis SK, Slorach EM, Littlepage LE, Egeblad M, Ewald AJ, et al. GATA-3 links tumor differentiation and dissemination in a luminal breast cancer model. Cancer Cell. 2008;13(2):141–52. doi: 10.1016/j.ccr.2008.01.011. [DOI] [PMC free article] [PubMed] [Google Scholar]
- 27.Vaillant F, Asselin-Labat ML, Shackleton M, Forrest NC, Lindeman GJ, Visvader JE. The mammary progenitor marker CD61/beta3 integrin identifies cancer stem cells in mouse models of mammary tumorigenesis. Cancer Res. 2008;68(19):7711–7. doi: 10.1158/0008-5472.CAN-08-1949. [DOI] [PubMed] [Google Scholar]
- 28.Lim E, Wu D, Pal B, Bouras T, Asselin-Labat M-L, Vaillant F, et al. Transcriptome analyses of mouse and human mammary cell subpopulations reveal multiple conserved genes and pathways. Breast Cancer Research. 2010;12(R21) doi: 10.1186/bcr2560. [DOI] [PMC free article] [PubMed] [Google Scholar]
- 29.Eirew P, Kannan N, Knapp DJ, Vaillant F, Emerman JT, Lindeman GJ, et al. Aldehyde dehydrogenase activity is a biomarker of primitive normal human mammary luminal cells. Stem Cells. 2012;30(2):344–8. doi: 10.1002/stem.1001. [DOI] [PubMed] [Google Scholar]
- 30.Marcato P, Dean CA, Pan D, Araslanova R, Gillis M, Joshi M, et al. Aldehyde dehydrogenase activity of breast cancer stem cells is primarily due to isoform ALDH1A3 and its expression is predictive of metastasis. Stem Cells. 2011;29(1):32–45. doi: 10.1002/stem.563. [DOI] [PubMed] [Google Scholar]
- 31.Ginestier C, Hur MH, Charafe-Jauffret E, Monville F, Dutcher J, Brown M, et al. ALDH1 is a marker of normal and malignant human mammary stem cells and a predictor of poor clinical outcome. Cell Stem Cell. 2007;1(5):555–67. doi: 10.1016/j.stem.2007.08.014. [DOI] [PMC free article] [PubMed] [Google Scholar]
- 32.Garaycoechea JI, Crossan GP, Langevin F, Daly M, Arends MJ, Patel KJ. Genotoxic consequences of endogenous aldehydes on mouse haematopoietic stem cell function. Nature. 2012;489(7417):571–5. doi: 10.1038/nature11368. [DOI] [PubMed] [Google Scholar]
- 33.Lin L, Hutzen B, Lee HF, Peng Z, Wang W, Zhao C, et al. Evaluation of STAT3 signaling in ALDH+ and ALDH+/CD44+/CD24- subpopulations of breast cancer cells. PLoS One. 2013;8(12):e82821. doi: 10.1371/journal.pone.0082821. [DOI] [PMC free article] [PubMed] [Google Scholar]
- 34.Shao C, Sullivan JP, Girard L, Augustyn A, Yenerall P, Rodriguez-Canales J, et al. Essential role of aldehyde dehydrogenase 1A3 for the maintenance of non-small cell lung cancer stem cells is associated with the STAT3 pathway. Clin Cancer Res. 2014;20(15):4154–66. doi: 10.1158/1078-0432.CCR-13-3292. [DOI] [PMC free article] [PubMed] [Google Scholar]
- 35.Korkaya H, Kim GI, Davis A, Malik F, Henry NL, Ithimakin S, et al. Activation of an IL6 inflammatory loop mediates trastuzumab resistance in HER2+ breast cancer by expanding the cancer stem cell population. Mol Cell. 2012;47(4):570–84. doi: 10.1016/j.molcel.2012.06.014. [DOI] [PMC free article] [PubMed] [Google Scholar]
- 36.Quintana E, Shackleton M, Sabel MS, Fullen DR, Johnson TM, Morrison SJ. Efficient tumour formation by single human melanoma cells. Nature. 2008;456(7222):593–8. doi: 10.1038/nature07567. [DOI] [PMC free article] [PubMed] [Google Scholar]
- 37.Nakshatri H, Srour EF, Badve S. Breast cancer stem cells and intrinsic subtypes: controversies rage on. Curr Stem Cell Res Ther. 2009;4(1):50–60. doi: 10.2174/157488809787169110. [DOI] [PubMed] [Google Scholar]
- 38.Canino C, Luo Y, Marcato P, Blandino G, Pass HI, Cioce M. A STAT3-NFkB/DDIT3/CEBPβ axis modulates ALDH1A3 expression in chemoresistant cell subpopulations. Oncotarget. 2015;6(14):12637–53. doi: 10.18632/oncotarget.3703. [DOI] [PMC free article] [PubMed] [Google Scholar]
- 39.Desgrosellier JS, Lesperance J, Seguin L, Gozo M, Kato S, Franovic A, et al. Integrin αvβ3 drives slug activation and stemness in the pregnant and neoplastic mammary gland. Dev Cell. 2014;30(3):295–308. doi: 10.1016/j.devcel.2014.06.005. [DOI] [PMC free article] [PubMed] [Google Scholar]
- 40.Maycotte P, Jones KL, Goodall ML, Thorburn J, Thorburn A. Autophagy Supports Breast Cancer Stem Cell Maintenance by Regulating IL6 Secretion. Mol Cancer Res. 2015;13(4):651–8. doi: 10.1158/1541-7786.MCR-14-0487. [DOI] [PMC free article] [PubMed] [Google Scholar]
- 41.Mathew R, Khor S, Hackett SR, Rabinowitz JD, Perlman DH, White E. Functional role of autophagy-mediated proteome remodeling in cell survival signaling and innate immunity. Mol Cell. 2014;55(6):916–30. doi: 10.1016/j.molcel.2014.07.019. [DOI] [PMC free article] [PubMed] [Google Scholar]
- 42.Duan L, Miura Y, Dimri M, Majumder B, Dodge IL, Reddi AL, et al. Cbl-mediated ubiquitinylation is required for lysosomal sorting of epidermal growth factor receptor but is dispensable for endocytosis. J Biol Chem. 2003;278(31):28950–60. doi: 10.1074/jbc.M304474200. [DOI] [PubMed] [Google Scholar]
- 43.Cecconi F. c-Cbl targets active Src for autophagy. Nat Cell Biol. 2012;14(1):48–9. doi: 10.1038/ncb2413. [DOI] [PubMed] [Google Scholar]
- 44.Roberts AB, Kim SJ, Noma T, Glick AB, Lafyatis R, Lechleider R, et al. Multiple forms of TGF-beta: distinct promoters and differential expression. Ciba Found Symp. 1991;157:7–15. doi: 10.1002/9780470514061.ch2. discussion 15–28. [DOI] [PubMed] [Google Scholar]
- 45.Seok S, Fu T, Choi SE, Li Y, Zhu R, Kumar S, et al. Transcriptional regulation of autophagy by an FXR-CREB axis. Nature. 2014;516(7529):108–11. doi: 10.1038/nature13949. [DOI] [PMC free article] [PubMed] [Google Scholar]
- 46.Wrzesinski SH, Wan YY, Flavell RA. Transforming growth factor-beta and the immune response: implications for anticancer therapy. Clin Cancer Res. 2007;13(18 Pt 1):5262–70. doi: 10.1158/1078-0432.CCR-07-1157. [DOI] [PubMed] [Google Scholar]
- 47.Rébé C, Végran F, Berger H, Ghiringhelli F. STAT3 activation: A key factor in tumor immunoescape. JAKSTAT. 2013;2(1):e23010. doi: 10.4161/jkst.23010. [DOI] [PMC free article] [PubMed] [Google Scholar]
- 48.Ricardo S, Vieira AF, Gerhard R, Leitão D, Pinto R, Cameselle-Teijeiro JF, et al. Breast cancer stem cell markers CD44, CD24 and ALDH1: expression distribution within intrinsic molecular subtype. J Clin Pathol. 2011;64(11):937–46. doi: 10.1136/jcp.2011.090456. [DOI] [PubMed] [Google Scholar]
- 49.Zhang M, Behbod F, Atkinson RL, Landis MD, Kittrell F, Edwards D, et al. Identification of tumor-initiating cells in a p53-null mouse model of breast cancer. Cancer Res. 2008;68(12):4674–82. doi: 10.1158/0008-5472.CAN-07-6353. [DOI] [PMC free article] [PubMed] [Google Scholar]
- 50.Bruttel VS, Wischhusen J. Cancer stem cell immunology: key to understanding tumorigenesis and tumor immune escape? Front Immunol. 2014;5:360. doi: 10.3389/fimmu.2014.00360. [DOI] [PMC free article] [PubMed] [Google Scholar]
Associated Data
This section collects any data citations, data availability statements, or supplementary materials included in this article.