Abstract
Background
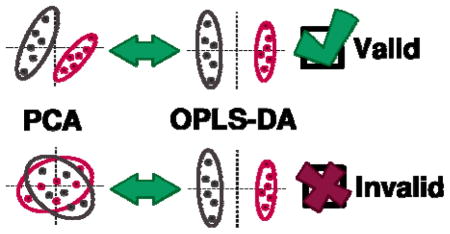
Principal Component Analysis (PCA) and Orthogonal Projections to Latent Structures Discriminant Analysis (OPLS-DA) are powerful statistical modeling tools that provide insights into separations between experimental groups based on high-dimensional spectral measurements from NMR, MS or other analytical instrumentation. However, when used without validation, these tools may lead investigators to statistically unreliable conclusions. This danger is especially real for Partial Least Squares (PLS) and OPLS, which aggressively force separations between experimental groups. As a result, OPLS-DA is often used as an alternative method when PCA fails to expose group separation, but this practice is highly dangerous. Without rigorous validation, OPLS-DA can easily yield statistically unreliable group separation.
Methods
A Monte Carlo analysis of PCA group separations and OPLS-DA cross-validation metrics was performed on NMR datasets with statistically significant separations in scores-space. A linearly increasing amount of Gaussian noise was added to each data matrix followed by the construction and validation of PCA and OPLS-DA models.
Results
With increasing added noise, the PCA scores-space distance between groups rapidly decreased and the OPLS-DA cross-validation statistics simultaneously deteriorated. A decrease in correlation between the estimated loadings (added noise) and the true (original) loadings was also observed. While the validity of the OPLS-DA model diminished with increasing added noise, the group separation in scores-space remained basically unaffected.
Conclusion
Supported by the results of Monte Carlo analyses of PCA group separations and OPLS-DA cross-validation metrics, we provide practical guidelines and cross-validatory recommendations for reliable inference from PCA and OPLS-DA models.
Keywords: PCA, PLS, OPLS, Chemometrics, Metabolomics
Graphical Abstract
INTRODUCTION
The use of Principal Component Analysis (PCA) as a first-pass method to identify chemical differences between high-dimensional spectral measurements is remarkably commonplace in chemistry, especially within the disciplines of metabolomics, quality control and process monitoring. For example, PCA is routinely used to differentiate between spectra of biofluids (e.g., urine or serum) collected from Nuclear Magnetic Resonance (NMR) spectroscopy and Mass Spectrometry (MS) [1]. Given a set of spectral measurements, PCA – cf. refs [2–5] for a review – identifies a small set of unique spectral patterns that capture the greatest variation present in the original measurements. In concert with these spectral patterns (loadings), PCA returns a low-dimensional score for each high-dimensional measurement that relates that measurement to all others in the set. In effect, each spectral measurement is reduced to a single point in scores-space, which may be visualized using a two- or three-dimensional scatter plot. A desirable outcome of PCA is a scores plot in which two or more groups form statistically distinct clusters. Unless predetermined by the experimental design, the absence of group separation usually indicates a failed result. While PCA is a powerful means of analyzing spectral data, it will only reveal differences between measurements in its scores if those differences are major contributors to the total variability. Through a combined inspection of the scores and loadings produced by PCA, analysts may obtain a high-level view of global spectral features that contribute to the total variability within a dataset.
Often, analysts are less concerned with the general relationships between measurements – which PCA describes – than with how well the measurements predict a set of response variables. As an illustration, metabolomics experiments commonly aim to identify a set of metabolites whose presence or concentration is altered in a disease state relative to healthy controls [1]. This is a multiple linear regression problem that is almost always intractable using classical statistical methods like ordinary least squares (OLS), because the number of measured spectra (i.e. number of samples or patients) never exceeds the number of spectral data points. The most elementary solution to this problem of high dimensionality is to use PCA scores as a basis for OLS regression, an approach known as Principal Component Regression (PCR). However, PCR may fail to yield a useful regression model if the predictive variation in the data (e.g., cancer biomarkers) is overshadowed by other sources of variation (e.g., diet) [2]. Thus, Partial Least Squares (PLS) is frequently used to obtain a biased regression model [6]. Unlike PCA, which is unsupervised, PLS is a supervised method that requires the analyst to explicitly assign a response value to each measurement. The PLS regression problem is known as Partial Least Squares Discriminant Analysis (PLS-DA) when the desired prediction is between measurements taken from two or more experimental groups (e.g., healthy vs. disease) [7, 8].
PLS-DA provides an avenue for predicting group membership based on a set of high-dimensional measurements, and holds many advantages over PCA and PCR. However, PLS-DA tends to construct overly complex models when variation exists in the measurements that do not correlate with membership to an experimental group [9, 10]. In studies of complex mixtures such as metabolomics, spectral signals having high variability that does not relate to group membership are nearly unavoidable. For this reason, Orthogonal Projections to Latent Structures Discriminant Analysis (OPLS-DA) is often used in lieu of PLS-DA to disentangle group-predictive and group-unrelated variation in the measured data. In doing so, OPLS-DA constructs more parsimonious and easily interpretable models compared to PLS-DA.
The combined application of PCA and (O)PLS-DA to spectral datasets yields valuable insights on both general spectral trends (PCA) and group-predictive spectral features (PLS). However, wanton use of this multivariate one-two punch without validation or knowledge of relationships between PCA and PLS model results can lead to statistically insignificant conclusions about the underlying chemistry. Unlike PCA, PLS and OPLS force separation between experimental groups in scores-space. OPLS is especially adept at forcing scores-space separation, because its integrated orthogonal signal correction (OSC) filter removes systematic spectral variation that does not agree with the assigned group memberships. When provided high-dimensional spectral data, PLS and OPLS will nearly always yield scores-space separation based on the assigned group memberships. These powerful modeling features make PLS and OPLS fully capable of producing results based on noise alone, if so requested [11]. In short, PLS and OPLS are over-eager to please the analyst with positive results, and require rigorous cross-validation to ensure reliability.
Unfortunately, validation of PLS and OPLS models is still far too infrequent in published work [12]. This is especially true in the rapidly growing field of metabolomics, where these methods are quite often – and quite mistakenly – considered surrogates for PCA. PCA, PLS and OPLS are distinct modeling frameworks that achieve very different goals and extract different information from a dataset. However, the optimistically forced group separations provided by (O)PLS-DA have spawned a pattern of misuse in metabolomics and related fields. When PCA fails to identify significant separation between experimental groups, untrained analysts may move to biased, insufficiently vetted OPLS-DA models without considering the statistical implications [13, 14]. While it is certainly possible for OPLS-DA to identify separation when PCA does not, the statistical significance of the separation must be validated before conclusions are drawn from the results. In effect, the conclusions of studies that lack proper validation are automatically suspect from a statistical viewpoint, implying that future attempts to reproduce their results may fail. Thus, validation of all supervised models is an absolute requirement in chemometrics. Even before supervised models are trained, the separation between groups in PCA scores-space may be used as an informative predictor of whether reliable OPLS-DA models may be trained on the data. We present practical guidelines on what level of OPLS-DA model reliability may be expected based solely on PCA group separations.
MATERIALS AND METHOD
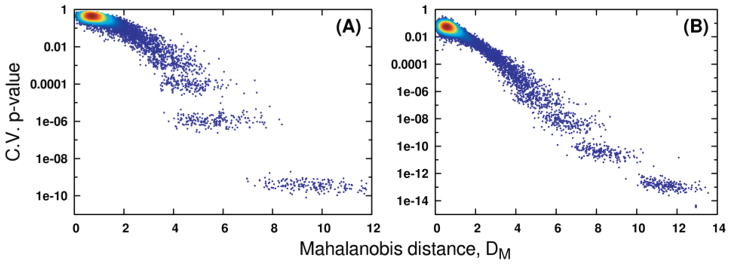
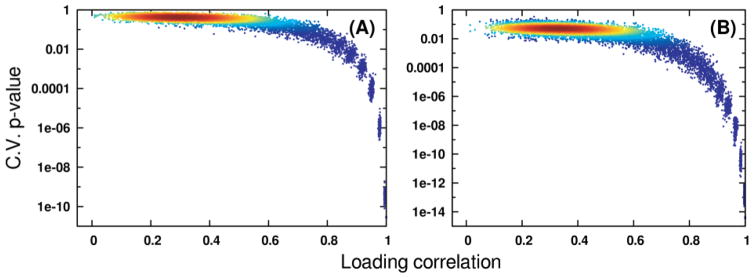
We performed a Monte Carlo simulation using MVAPACK (http://bionmr.unl.edu/mvapack.php, [15]) to analyze the relationship between group separation in PCA scores-space and OPLS-DA cross-validation metrics as a function of spectral noise content. A data matrix of 32 binned 1D 1H NMR spectra from the freely available Coffees dataset [15] was used, as it contains highly significant separation between two experimental groups. A second data matrix comparing 50 1D 1H NMR spectra of chemically defined cell growth media was also subjected to Monte Carlo analysis. A set of 50 linearly increasing additive noise points was constructed such that the noise standard deviation increased relative to the intrinsic variation (l2 norm) of the original data matrix. Two hundred Monte Carlo iterations were performed at each noise point, where each iteration had a different sample of Gaussian noise added to the data matrix based on the current noise standard deviation. Within each iteration, a three-component PCA model and an OPLS-DA model with a single predictive component were constructed. Component counts for PCA and OPLS-DA models were forced, rather than determined by cross-validation, to ensure that enough components were available for subsequent computations. For each OPLS-DA model, a CV-ANOVA [16] was performed to assess model reliability. In addition, the Mahalanobis distance (DM) [17] between groups within PCA scores-space was computed at each iteration to quantify the significance of the group separation. The correlation between the OPLS-DA model loadings and the original noise-free loadings were also computed at each iteration to determine how well the OPLS-DA model reproduced the “true” loadings. Key results of the Monte Carlo analysis are shown in Fig. (1 and 2).
Fig. 1.
Relationships to OPLS-DA CV-ANOVA p values obtained through Monte Carlo simulation of the Mahalanobis distance (DM) between classes in PCA scores-space. Panels (A) and (B) hold results computed from the Coffees and Media datasets, respectively. The density of points in both panels is indicated by coloring, where red indicates high point density and blue indicates low density.
Fig. 2.
Relationships to OPLS-DA CV-ANOVA p values obtained through Monte Carlo simulation of correlation between OPLS-DA model predictive loadings given noisy data (p) and loadings obtained on the original data matrix (p0). Panels (A) and (B) hold results computed from the Coffees and Media datasets, respectively. The density of points in both panels is indicated by coloring, where red indicates high point density and blue indicates low density.
Initial Datasets
Two groups of observations (Light and Medium Decaffeinated) from the binned data matrix were extracted from the latest version of the Coffees dataset [15]. The resulting data matrix (referred to as X: N = 32, K = 284) contains a highly significant separation between the two groups based on caffeine 1D 1H NMR spectral features. A second dataset, generated from a comparison of two chemically defined cell growth media, was used to provide further support for the trends observed during Monte Carlo analysis of the Coffees data matrix. The resulting Media data matrix (N = 50, K = 238) also contains highly significant separation between two groups based on binned 1D 1H NMR spectral features.
Prior to Monte Carlo simulation, the l2 norm (largest singular value) of each data matrix X was computed and stored as σmax. A set of 50 noise standard deviations (σ) was computed, where each value ranged linearly from σmax/500 to σmax/10. For each noise standard deviation, a set of 200 Monte Carlo iterations was performed. Another set of 200 iterations was also performed on the original data matrix X without any added noise.
Monte Carlo Simulation
At each Monte Carlo iteration, an N-by-K matrix of noise values were drawn as NK independently and identically distributed samples from a zero-mean normal distribution having a standard deviation of σ, corresponding to the current noise value as described above. The data matrix X was summed with the noise matrix, and a three-component (A = 3) PCA model was computed on the resulting sum (X′) after scaling [18] using a NIPALS algorithm [2]. To illustrate the effects of scaling in our Monte Carlo analysis, data matrices from the Coffees dataset were UV-scaled, and data matrices from the Media dataset were Pareto-scaled. The explained variation (R2) of each principal component was computed from the sum of squares of the outer product of the component’s scores and loadings (tpT), divided by the total data matrix sum of squares. A Monte Carlo leave-n-out cross-validation (MCCV) was performed based on the modified method of Krzanowski and Eastment [19] (vide infra) in order to obtain a per-component predictive ability (Q2) statistic. A seven-fold partitioning of the observations and variables, randomly resampled ten times, was performed for each PCA MCCV run [20]. Following model training, the Mahalanobis distance between the two groups was computed using PCA scores [17].
After computation of the Mahalanobis distance, the noisy data matrix X′ was Pareto-scaled and subjected to OPLS-DA using a Pareto-scaled binary (0, 1) response vector (y) and a NIPALS OPLS algorithm [10]. A one-component (Ap = 1, Ao = 1) OPLS model was constructed, from which backscaled predictive loadings were extracted by dividing by the coefficients obtained from Pareto scaling [21]. The Pearson correlation coefficient between backscaled loadings and the known “true” loadings – corr(p,p0) – was computed for later visualization. Explained variation (R2Y) was computed from the sum of squares of the y-factors (tcT), divided by the sum of squares of y. A Monte Carlo leave-n-out internal cross-validation (MCCV) of the OPLS model was performed using a seven-fold partitioning of the data matrix that was randomly resampled ten times [22]. Discriminant predictive ability (DQ2) statistics were computed as the mean DQ2 obtained from MCCV results [23]. Thus, each OPLS model contained a set of ten fitted residual matrices from cross-validation available for use in CV-ANOVA significance testing [16]. During CV-ANOVA calculations, the median values of mean square error (MSE) were computed from all residual matrices, and the ratio of median fitted MSE to median residual MSE was calculated to yield an F-statistic for p value generation.
Monte Carlo Cross-validation of PCA Models
In the modified method of Krzanowski and Eastment (modified K+E), the observations and variables of the data matrix are partitioned into n groups, allowing multiple data matrix elements to be left out and recomputed for each group [19]. In modified K+E, each cross-validation group is formed by a regular grid of data matrix elements, but this is merely one way to partition the data matrix. In our Monte Carlo modified K+E scheme, observations and variables are randomly partitioned into n groups for each Monte Carlo iteration, resulting in multiple irregular “grids” of data matrix elements being left out and recomputed [20]. The results – mean and standard deviation Q2 values – of PCA MCCV are then collated in exactly the same manner as those from PLS or OPLS MCCV [22].
RESULTS AND DISCUSSIONS
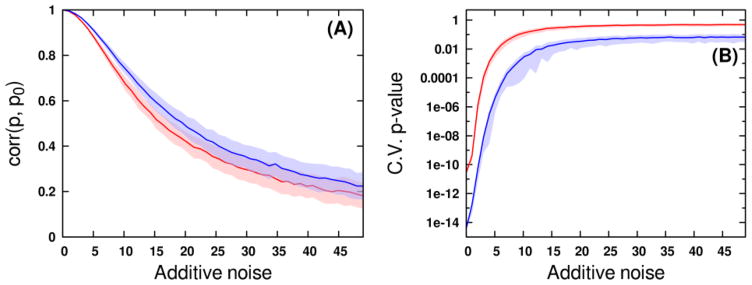
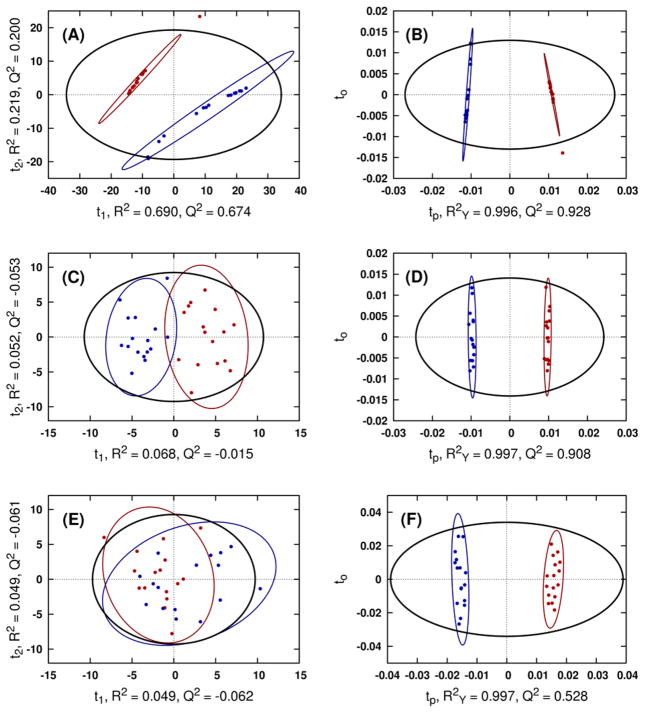
As expected, PCA scores-space distances between experimental groups rapidly decrease as noise is added to the data, which also forces a rise in OPLS-DA cross-validation statistics. As a result, a strong exponential relationship is observed between Mahalanobis distances calculated from PCA scores and CV-ANOVA p values from the OPLS-DA models (Fig. 1). Because PCA modeling uses no group membership information, the scores-space distances in Fig. 1 are essentially the least biased method of appraising discrimination ability. As the groups become less distinguishable based on their spectral measurements, PCA will expose less separation in the scores. When PCA fails to expose group separation, OPLS-DA will continue to do so at the expense of model reliability, as it is relying on weaker sources of variation in the measured data. While the exact form of the relationship between distance and p value will depend on the input data and responses, our analysis provides clear evidence that distances between groups in PCA scores may be used as a qualitative ruler of future supervised model reliability. The effects of different data scaling methods may be observed by comparing the results of Fig. 1A with those in Fig. 1B. While the Pareto-scaled Media results exhibit a slightly less curved relationship, they fully corroborate the relationships observed from the UV-scaled Coffees data. From these analyses, we have observed no evidence to suggest the relationship between PCA scores- space distances and OPLS validation statistics is dataset- or scaling-dependent. While it is theoretically possible to contrive a dataset that does not follow this trend, such an example would be uncommon in most real studies. The shrinkage of Mahalanobis distances as data matrix noise increases occurs concomitantly with a rapid loss of correlation between ideal OPLS predictive loadings and estimated loadings (Fig. 2 and 3A). It is critical to note, however, that group separations in OPLS scores-space do not appreciably decrease (Fig. 4) with the decreased loading correlations (Fig. 2 and 3A) or the increased CV-ANOVA p values (Fig. 1 and 3B). In effect, the OPLS model has identified different, less reliable sources of variation in the noisy data matrix in order to maintain group separation. OPLS-DA requires only that some variation in the measured data correlates with group membership, regardless of whether that variation is signal or noise [6, 10, 24]. When the true predictive spectral features that reflect the underlying biochemistry have become masked by noise, OPLS-DA will shift its focus to the variation that best predicts group membership. This is evident by the relative stability in the R2 and Q2 values despite the deterioration in the model reliability. Because OPLS-DA provides the most optimistic result possible, validation becomes a necessity.
Fig. 3.
(A) Decrease of correlation between estimated loadings (p) and true loadings (p0) occurs as varying degrees of noise are added to the Coffees (red) and Media (blue) data matrices. Light shaded regions indicate confidence intervals of plus or minus one standard deviation from the mean correlation. A value of 1X additive noise corresponds to a noise standard deviation equaling 0.002 times the data matrix l2 norm. (B) Increase of p values from CV-ANOVA OPLS-DA validation as varying degrees of noise are added to the Coffees (red) and Media (blue) data matrices. Light shaded regions indicate confidence intervals of plus or minus one standard deviation from the median p value.
Fig. 4.
Comparison of representative PCA (A, C, E) and OPLS-DA (B, D, F) scores resulting from modeling the original Coffees data matrix (A, B), the 4X noisy data matrix (C, D) and the 20X noisy data matrix (E, F). Class ellipses represent the 95% confidence regions for class membership. CV-ANOVA p-values for the OPLS-DA model generated from the original data matrix, 4X and 20X noisy data matrix are 2.82x10⁻¹¹, 2.99x10⁻⁴, and 1.97x10⁻¹, respectively.
CONCLUSION
PCA, PLS and OPLS-DA are integral to metabolomics. When properly employed, these methods provide valuable insights on group relationships from simple visual inspection of scores-space clustering patterns. Unfortunately, these insights come with pitfalls that are often missed by novice investigators, leading to misinterpretation. Using NMR metabolomics datasets with statistically significant group separations, we demonstrate that separation between these groups in PCA scores is strongly related to OPLS-DA cross-validation statistics from the same data. As noise is added to the data, PCA group separations decrease while OPLS-DA CV-ANOVA p values increase towards non-significance. Eventually, no group separation is visible in the PCA scores (Fig. 4E) and the corresponding OPLS-DA model is no longer statistically valid (p value 0.197). Despite being statistically invalid, the OPLS-DA scores still exhibit clear group separation (Fig. 4F). This disconnect between observed group separations and model significance in (O)PLS is a source of error in metabolomics that has often led to the publication of statistically unreliable results. Our results illustrate that if a PCA model fails to achieve group separation, a subsequent OPLS-DA model, despite any appearance of group separation, is often unreliable or invalid. While (O)PLS may reveal group separations even when PCA fails to do so, these results require rigorous cross-validation to ensure validity.
The principal strength of OPLS-DA models in metabolomics is their identification of spectral features (i.e. metabolite changes) that define the separations between experimental groups. In effect, OPLS-DA is used to identify the biologically relevant changes in the metabolome. Fig. (2) demonstrates that spectral features (metabolites) that are identified for the invalid model (p value 0.197) have no relationship to the “true” metabolite changes identified without added noise. If an investigator were to interpret the features identified by the invalid OPLS-DA model, it would yield complete biological nonsense.
Adding to the confusion is the routine observation that R2 and Q2 values may still be in an acceptable range for an invalid OPLS-DA model. R2 and Q2 values by themselves are optimistic measures of model fit and consistency that are without a proper standard of comparison [5]. In short, R2 provides a measure of model fit to the original data, and Q2 provides an internal measure of consistency between the original and cross-validation predicted data. While R2 and Q2 provide a weak measure of model reliability, assuming that a model is reliable from only R2 and Q2 values is inadequate. As we demonstrate, an invalid (p value 0.197) OPLS-DA model (Fig. 4F) yielded an excellent R2 value of 0.997 and an acceptable Q2 value of 0.528. Ideally, external cross-validation methods, which exclude a large set of measurements from model training for later prediction, would be used to construct more accurate Q2 values. However, the scarcity of data in most metabolomics experiments forces the use of internal cross-validation, resulting in over-optimistic Q2 values.
The presented Monte Carlo simulations once again illustrate how noise can masquerade as group-predictive variation in statistical analyses of high-dimensional spectral measurements. Moreover, our simulations touch on an often-overlooked distinction between group separations and reliable, statistically significant group separations in PCA/PLS scores-space. Although PLS and OPLS may separate experimental groups in situations where PCA cannot, this outcome should raise a red flag to the analyst that the model is suspect and the data may not sufficiently predict group membership. Only after rigorous cross-validation can it be safely inferred that OPLS-DA group separations are reliable and significant. If cross-validated estimates of OPLS scores still separate the desired experimental groups, and CV-ANOVA and permutation testing report significant p values, the models may then be used for chemical inference. If cross-validation is left unreported, conclusions drawn from the models must be met with strong skepticism [11, 12].
The results of our Monte Carlo analysis relating PCA scores-space separations to OPLS-DA cross-validation metrics effectively summarize the reasons why rigorous cross-validation is necessary in chemometric studies relying on multivariate analyses [11]. More specifically, it reaffirms the importance of PCA as a first-pass unsupervised tool in metabolic fingerprinting and untargeted metabolic profiling studies, where group separations in scores-space are often the sole basis for further experimentation. It is an unfortunate common practice in such studies to dismiss completely overlapped experimental groups in PCA scores-space and move ahead to (usually un-validated) supervised methods such as PLS and OPLS that force scores-space separation. Such practices almost guarantee the irreproducibility of any conclusions drawn from trained multivariate models, as the relationship we have obtained between Mahalanobis distances from PCA scores and CV-ANOVA p values from OPLS validation indicates. Even in light of the powerful prediction ability of PLS and OPLS, PCA remains a highly useful, practical method for examining unbiased group separations. It is therefore highly recommended that methods which assign Mahalanobis distance-based confidence ellipses to classes in PCA scores [25], report cross-validation estimated scores plots for PLS and OPLS models, and provide one or more cross-validation metrics during model training [15] be used in these studies whenever possible.
Our Monte Carlo analysis is only a case study for two specific data matrices, and is not meant to provide a truly quantitative relationship between any of the discussed metrics over all possible metabolomics studies. Instead, it lends positive numerical support to our recommendations that analysts rigorously cross-validate their models by multiple means, including CV-ANOVA, response permutation testing, and even qualitative examination of PCA scores-space group separations. We hope the results presented in this work may be used to further promote best practices of supervised multivariate model training and validation in the community.
Acknowledgments
The authors would like to thank Teklab Gebregiworgis, Shulei Lei, Darrell D. Marshall and Jonathan Catazaro for their many valuable discussions that motivated the writing of this communication. The authors would also like to thank Dr. Nicole Buan for their contribution of samples used to generate the second dataset. This manuscript was supported, in part, by funds from grants R01 CA163649, P01 AI083211-06 and P30 GM103335 from the National Institutes of Health. The research was performed in facilities renovated with support from the National Institutes of Health (RR015468-01).
Footnotes
CONFLICT OF INTEREST
The authors declare that they have no competing interests.
Send Orders for Reprints to reprints@benthamscience.ae
References
- 1.Hecht SS. Human urinary carcinogen metabolites: biomarkers for investigating tobacco and cancer. Carcinogenesis. 2002;23(6):907–922. doi: 10.1093/carcin/23.6.907. [DOI] [PubMed] [Google Scholar]
- 2.Jolliffe IT. Principal component analysis. 2. Springer-Verlag; New York: 2002. p. 488. [Google Scholar]
- 3.Lindon JC, Nicholson JK, Holmes E, Everett JR. Metabonomics: Metabolic processes studied by NMR spectroscopy of biofluids. Concepts in Magnetic Resonance. 2000;12(5):289–320. [Google Scholar]
- 4.Wold S, Esbensen K, Geladi P. Principal Component Analysis. Chemometrics and Intelligent Laboratory Systems. 1987;2(1–3):37–52. [Google Scholar]
- 5.Worley B, Powers R. Multivariate Analysis in Metabolomics. Current Metabolomics. 2013;1(1):92–107. doi: 10.2174/2213235X11301010092. [DOI] [PMC free article] [PubMed] [Google Scholar]
- 6.Wold S, Sjostrom M, Eriksson L. PLS-regression: a basic tool of chemometrics. Chemometrics and Intelligent Laboratory Systems. 2001;58(2):109–130. [Google Scholar]
- 7.Barker M, Rayens W. Partial least squares for discrimination. Journal of Chemometrics. 2003;17(3):166–173. [Google Scholar]
- 8.Brereton RG, Lloyd GR. Partial least squares discriminant analysis: taking the magic away. Journal of Chemometrics. 2014;28(4):213–225. [Google Scholar]
- 9.Bylesjo M, Rantalainen M, Cloarec O, Nicholson JK, Holmes E, Trygg J. OPLS discriminant analysis: combining the strengths of PLS-DA and SIMCA classification. Journal of Chemometrics. 2006;20(8–10):341–351. [Google Scholar]
- 10.Trygg J, Wold S. Orthogonal projections to latent structures (O-PLS) Journal of Chemometrics. 2002;16(3):119–128. [Google Scholar]
- 11.Westerhuis JA, Hoefsloot HCJ, Smit S, Vis DJ, Smilde AK, van Velzen EJJ, van Duijnhoven JPM, van Dorsten FA. Assessment of PLSDA cross validation. Metabolomics. 2008;4(1):81–89. [Google Scholar]
- 12.Brereton RG. A short history of chemometrics: a personal view. Journal of Chemometrics. 2014;28(10):749–760. [Google Scholar]
- 13.Aksenov AA, Yeates L, Pasamontes A, Siebe C, Zrodnikov Y, Simmons J, McCartney MM, Deplanque JP, Wells RS, Davis CE. Metabolite Content Profiling of Bottlenose Dolphin Exhaled Breath. Analytical Chemistry. 2014;86(21):10616–10624. doi: 10.1021/ac5024217. [DOI] [PMC free article] [PubMed] [Google Scholar]
- 14.McLaughlin G, Doty KC, Lednev IK. Raman Spectroscopy of Blood for Species Identification. Analytical Chemistry. 2014;86(23):11628–11633. doi: 10.1021/ac5026368. [DOI] [PubMed] [Google Scholar]
- 15.Worley B, Powers R. MVAPACK: A Complete Data Handling Package for NMR Metabolomics. Acs Chemical Biology. 2014;9(5):1138–1144. doi: 10.1021/cb4008937. [DOI] [PMC free article] [PubMed] [Google Scholar]
- 16.Eriksson L, Trygg J, Wold S. CV-ANOVA for significance testing of PLS and OPLS (R) models. Journal of Chemometrics. 2008;22(11–12):594–600. [Google Scholar]
- 17.De Maesschalck R, Jouan-Rimbaud D, Massart DL. The Mahalanobis distance. Chemometrics and Intelligent Laboratory Systems. 2000;50(1):1–18. [Google Scholar]
- 18.van den Berg RA, Hoefsloot HCJ, Westerhuis JA, Smilde AK, van der Werf MJ. Centering, scaling, and transformations: improving the biological information content of metabolomics data. Bmc Genomics. 2006;7 doi: 10.1186/1471-2164-7-142. [DOI] [PMC free article] [PubMed] [Google Scholar]
- 19.Eshghi P. Dimensionality choice in principal components analysis via cross-validatory methods. Chemometrics and Intelligent Laboratory Systems. 2014;130:6–13. [Google Scholar]
- 20.Worley B. Chemometric and Bioinformatic Analyses of Cellular Biochemistry. University of Nebraska; Lincoln, NE: 2015. [Google Scholar]
- 21.Cloarec O, Dumas ME, Craig A, Barton RH, Trygg J, Hudson J, Blancher C, Gauguier D, Lindon JC, Holmes E, Nicholson J. Statistical total correlation spectroscopy: An exploratory approach for latent biomarker identification from metabolic H-1 NMR data sets. Analytical Chemistry. 2005;77(5):1282–1289. doi: 10.1021/ac048630x. [DOI] [PubMed] [Google Scholar]
- 22.Xu QS, Liang YZ, Du YP. Monte Carlo cross-validation for selecting a model and estimating the prediction error in multivariate calibration. Journal of Chemometrics. 2004;18(2):112–120. [Google Scholar]
- 23.Westerhuis JA, van Velzen EJJ, Hoefsloot HCJ, Smilde AK. Discriminant Q(2) (DQ(2)) for improved discrimination in PLSDA models. Metabolomics. 2008;4(4):293–296. [Google Scholar]
- 24.Gottfries J, Johansson E, Trygg J. On the impact of uncorrelated variation in regression mathematics. Journal of Chemometrics. 2008;22(11–12):565–570. [Google Scholar]
- 25.Worley B, Halouska S, Powers R. Utilities for quantifying separation in PCA/PLS-DA scores plots. Analytical Biochemistry. 2013;433(2):102–104. doi: 10.1016/j.ab.2012.10.011. [DOI] [PMC free article] [PubMed] [Google Scholar]


