

Abstract
Objective
Pedestrian injuries are a leading cause of child death, and may be reduced by training children to cross streets more safely. Such training is most effective when children receive repeated practice at the complex cognitive-perceptual task of judging moving traffic and selecting safe crossing gaps, but there is limited data on how much practice is required for children to reach adult levels of functioning. Using existing data, we examined how children’s pedestrian skill changed over the course of six pedestrian safety training sessions, each comprised of 45 crossings within a virtual pedestrian environment.
Methods
As part of a randomized controlled trial on pedestrian safety training, 59 children ages 7-8 crossed the street within a semi-immersive virtual pedestrian environment 270 times over a 3-week period (6 sessions of 45 crossings each). Feedback was provided after each crossing, and traffic speed and density was advanced as children’s skill improved. Post-intervention pedestrian behavior was assessed a week later in the virtual environment and compared to adult behavior with identical traffic patterns.
Results
Over the course of training, children entered traffic gaps more quickly and chose tighter gaps to cross within; their crossing efficiency appeared to increase. By the end of training, some aspects of children’s pedestrian behavior was comparable to adult behavior but other aspects were not, indicating the training was worthwhile but insufficient for most children to achieve adult levels of functioning.
Conclusions
Repeated practice in a simulated pedestrian environment helps children learn aspects of safe and efficient pedestrian behavior. Six twice-weekly training sessions of 45 crossings each were insufficient for children to reach adult pedestrian functioning, however, and future research should continue to study the trajectory and quantity of child pedestrian safety training needed for children to become competent pedestrians.
Keywords: pedestrian, children, safety, injury, training, learning
Pedestrian injuries are among the leading causes of child death in the United States (US; NCIPC 2015) and worldwide (WHO 2013), leading to over 400 pediatric deaths and over 45,000 emergency-department treated injuries annually in the US (NCIPC 2015). A recent meta-analysis suggests efforts to teach children pedestrian safety can be effective (Schwebel, Barton et al. 2014). In particular, interventions designed to teach children to be more accurate in selecting safe traffic gaps to cross within can be effective. Such training is most effective when children receive repeated practice at the complex cognitive-perceptual task of judging moving traffic and selecting safe crossing gaps. This repeated practice can occur in vivo at street corners or in simulation (Schwebel, Barton et al. 2014).
Theoretically, interventionists approach the challenge of pedestrian crossings from two primary perspectives. Some conceptualize the learning based on ecological theory (Gibson 1979; Grechkin et al. 2013; Plumert and Kearney 2014), reasoning that children must judge the affordance of dynamic moving traffic gaps and determine when it is safe to propel their body through a gap. Others conceptualize the task from cognitive theory (Barton 2006; Thomson et al. 2005), arguing children must estimate distances and speeds and then complete rapid cognitive processing to determine the safety of emerging gaps. In both cases, theorists agree that the process is complex and challenging for a still-developing young mind.
Similar to crossing a street with moving traffic, developing athletic skill offers a challenging visual-perceptual-motor task for children, especially when the athletic feat requires perception and judgment of moving objects like balls (Buszard et al. 2014b; Peper et al. 1994). Contemporary youth sports training copes in multiple ways. Baseball coaches generally teach children to hit a stable ball off tees before “graduating” them to hitting a moving pitch around ages 7-8 (www.teeballusa.org). Recent innovations in youth tennis coaching promote the use of a larger and under-compressed ball on a smaller court for young children, not advancing them to the full “adult” court and ball until adolescence (Buszard et al. 2014a, 2014b). In both cases, the transition to the more complex cognitive task occurs during the developmental stage when pedestrian safety interventionists actively target street-crossing training. The complex cognitive-perceptual task of learning to cross a street by judging moving traffic gaps has parallels, in fact, to the complex cognitive perceptual task of striking moving baseballs and tennis balls.
In sport, coaches generally preach repeated practice at the complex task for athletes to learn the skill. Pedestrian safety interventionists must do the same. However, the pedestrian safety field has not yet determined, or even carefully studied, the extent of practice necessary for children to achieve adult levels of performance. How many practice crossings are required before a child learns to be a safe pedestrian who functions at adult levels?
A few previous studies have utilized streetside, animated or virtual environment training that offered children repeated practice to learn the complex cognitive-perceptual skills to identify safe traffic gaps within which one can cross streets safely. No matter what training environment was used, children were presented with repeated traffic situations and judged the safety of crossing in them; feedback was provided concerning the safety of crossing. Most training involved a small number of sessions. As examples, Tolmie and colleagues (2005) presented four 25-30 minute sessions of crossing in animated scenarios; Thomson and colleagues (2005) presented four 30-40 minute sessions with computer-driven simulated scenarios; Bart and colleagues (2008) presented three 20-minute sessions of crossing in a virtual environment; and Schwebel and colleagues (Schwebel et al. 2016) presented six 15-minute sessions of crossing in a virtual environment. In all cases, children showed some improvement in their pedestrian skill but none demonstrated that children were fully accomplished pedestrians functioning like adults following the training.
The longest amount of training we identified in a randomized trial was completed by Schwebel and colleagues (Schwebel, McClure et al. 2014). The present study uses data from that randomized controlled trial to examine how children’s pedestrian skill changed over the course of six pedestrian safety training sessions, each comprised of 45 crossings within a virtual pedestrian environment. We hypothesized children would begin at levels far inferior to adult functioning, would show incremental improvement over time, and would end with skill comparable to that of adults.
METHODS
Participants
As part of a randomized controlled trial on pedestrian safety training (Schwebel, McClure et al. 2014), 240 children ages 7-8 were recruited from the Birmingham, AL community and randomly assigned to receive pedestrian safety training in a virtual reality environment (data used in this study, n=59) or a different experimental group (data not shown). As listed in Table A1, the child sample for this study had an average age of 7.9 years (SD = .67) and was 46% male. The sample was diverse, with 59% of parents identifying their children as White, 39% as African American, and 2% as other ethnicities or as biracial or multiracial. The latter categories were merged with the African American children to create a ‘non-White’ race/ethnicity group for primary analyses. All participants’ parents provided written informed consent to participate, and children provided informed assent. The study protocol was approved by the Institutional Review Board at University of Alabama at Birmingham.
We compared performance among the sample of children with pedestrian behavior by adults recruited for three previous studies (Schwebel et al. 2012; Schwebel et al. 2009; Stavrinos et al. 2011, Experiment 1). All three study samples were comprised of adult college students recruited from the University of Alabama at Birmingham campus. The samples of 33, 96, and 108 participants cumulatively had a mean age of about 21 years (range of means = 20.7-21.8; range of SDs = 4.20-5.44), were about 60% female (range = 58%-61%), and were about 50% white (range = 44%-52%). Demographic details for each study are provided in Table A2. All adults provided informed consent to participate in the studies and all protocols were approved by the Institutional Review Board at University of Alabama at Birmingham.
The Virtual Reality Pedestrian Environment
The virtual reality (VR) pedestrian environment used in this study replicates an actual crosswalk near a local school and shows a midblock crossing on a two-lane bidirectional road marked with a crosswalk (Schwebel et al. 2008). To engage in the VR, participants stand on a wooden curb with three monitors in front of them, creating a semi-immersed experience. They view traffic moving from both directions and step off the curb when they believe it safe to cross. Traffic moves at a constant speed pre-determined by the researcher and appears at random intervals to create a traffic volume density also pre-determined by the researcher. Thus, temporal traffic gap sizes are randomized by a computer-driven scheme that creates a certain number of vehicles per minute and that varies depending on the randomized production of vehicles as well as the speed of vehicles. Upon recognizing a traffic gap participants deem to be safe, users step down off the curb and trigger a race- and gender-matched avatar to cross the simulated street at a predetermined walking speed. The avatar’s walking speed matches the participant’s typical walking speed, assessed across 5 trials of walking 25 feet in a different room prior to the start of the session.
When participants step off the curb, their perspective switches from first to third person, allowing participants to watch themselves cross the street and learn whether the crossing was safe. Following the crossing (or upon contact with an oncoming vehicle after a screen-freeze), a cartoon character appears to provide positive or negative feedback about the crossing, as appropriate.
Baseline and Post-Intervention Assessment
In both baseline and post-intervention assessments, children completed 30 street crossings within the virtual reality environment, 10 at each of three “difficulty” levels: 25 MPH traffic and light traffic density (8 vehicles/minute, meaning 4 vehicles appeared going each direction per minute); 30 MPH traffic and moderate traffic density (12 vehicles/minute); 35 MPH traffic and heavy traffic density (16 vehicles/minute), in a randomized order. Prior to those trials, 8 practice trials were offered, along with standardized instructions for children to cross when they perceived the virtual street environment to be safe.
Training
Following the baseline evaluation, children received 30-minute sessions of pedestrian safety training in the VR environment twice weekly for 3 weeks, or 6 sessions total. During each of the sessions, children completed 3 segments of 15 virtual crossings, resulting in 45 crossings total for each of the six sessions and 270 crossings in all over a 3-week period. To assist with learning, the VR was programmed to provide feedback at the end of each crossing about the safety of the crossing. Delivered by a child-friendly cartoon character, the child was cautioned if he/she was hit or almost hit (close call) by a virtual car. In the case of a safe crossing, the child was provided with one of two randomly-determined positive feedback messages.
A critical aspect of the training paradigm was that children were advanced to more challenging traffic patterns as their skill improved. Thus, if a child completed 85% of trials successfully during any of the three baseline evaluation levels (25 MPH and 8 vehicles/minute, 30 MPH and 10 vehicles/minute, or 35 MPH and 12 vehicles/minute) or at any subsequent training session, at the next session traffic was presented at the next “level”. The three baseline levels were designated as levels C, E, and G. Each level involved traffic moving 2.5 mph quicker and an increase of 2 vehicles/minute appearing (one in each direction), such that, for example, a move from Level C (25 MPH and 8 vehicles/minute) to Level D (27.5 MPH and 10 vehicles/minute) was common. Children who failed the 85% success criterion at all levels during baseline assessment began at level A, which was 20 MPH and 4 vehicles/minute. Increasing speeds and densities created smaller traffic gaps for children to cross within. Temporal gap sizes were randomized based on computer production of a certain number of vehicles per minute, but always became tighter as children progressed to higher “levels”. Ability to cross within gaps also depended on children’s walking speeds; faster walkers could cross tighter gaps more quickly.
Although this manipulation of increasing difficulty with increasing skill was logical for the original study goal of training children in pedestrian safety and matched strategies used in previous interventions (Tolmie et al. 2005), it complicates secondary analysis for the present study on training performance because more advanced children started with more challenging traffic patterns and all children received increasingly more challenging traffic as their safety improved. We accounted for this by controlling for the starting level of difficulty (which correlated with the number of levels children improved over the six sessions, r = -.39, p < .01). 22 children started at the easiest traffic Level, Level A. 21 children started at Level D (27.5 MPH and 10 vehicles/minute), 10 at Level F (32.5 MPH and 14 vehicles/minute), and 4 at Level H (37.5 MPH and 18 vehicles/minute). Two other children were erroneously started one level higher than they should have (one at level E instead of D; one at level I instead of H) due to technical or researcher error. Those two participants were omitted from interaction analyses (and corresponding figures) due to degrees of freedom concerns, but included in all other analyses.
Measures
Demographics
Parents completed a brief demographic survey providing child age, gender, and ethnicity, as well as household income and parent education level. A socioeconomic status composite was computed by aggregating the standardized household income and standardized parental education level (computed by averaging mother and father’s education levels).
Pedestrian Safety Outcomes
Five outcome measures of pedestrian behavior were considered for crossings conducted at baseline, during training, and at post-intervention assessment: unsafe crossings, start delay, looks to traffic, time to contact, and missed opportunities. All were recorded automatically by the VR system.
Unsafe crossings represented the proportion of crossings in which the child was either struck by a virtual vehicle, or was within 1 second of being struck. We expected a reduction of unsafe crossings as a result of training.
Start delay was defined as the temporal lag (in seconds) before initiating the crossing into a traffic gap. It is considered an indicator of a child’s cognitive processing efficiency as a pedestrian (Barton 2006; Chihak et al. 2010; Plumert et al. 2004; Thomson et al. 2005). Children with limited experience as pedestrians may begin to consider the safety of a traffic gap only when that gap actually appears, rather than anticipating gaps that will appear by processing the two bidirectional lanes separately and even entering the near lane first when the far lane is still occupied by traffic. Consequently, there is a temporal delay in entering traffic gaps among novice pedestrians that disappears with experience and maturity (Thomson et al. 2005). In the VR environment, start delays were computed as the temporal gap between the child initiating crossing (which happened second) and the last vehicle passing the crosswalk in either lane to create the traffic gap (which happened first). We expected start delays to decrease following training.
Looks to traffic was computed by summing children’s looks to the right and children’s looks to the left while waiting to cross the street, then dividing by waiting time in seconds. Looks were counted with every head turn to the right or left by the child and were recorded by a head-tracking device. Waiting time was computed as the time a child spent standing on the simulated curb after traffic movement was initiated until the child stepped off the curb to cross. High numbers indicate substantial looking to the left and right and are more common among adults facing heavy traffic volume; low numbers indicate less looking back and forth at oncoming traffic. We expected looks to traffic would decrease following training as children developed better skill to remember the location of vehicles and anticipate where they would be in the future.
Time to contact (TTC) was defined as the shortest temporal gap between the child while crossing the virtual crosswalk and the leading vehicle approaching the child in either direction (i.e., either lane of traffic). Higher TTC generally signifies greater safety when crossing the street, but as a child gains more experience as a pedestrian, he or she may also accept tighter gaps and therefore create shorter TTCs with increased confidence and skill in selecting safe gaps to cross within. For this reason, we expected TTC to decrease following training.
Missed opportunities measured children’s pedestrian efficiency rather than safety. Missed opportunities were defined as any traffic gap that was 150% or longer than the time needed for a child to cross the street, but the child decided not to cross. In the current study, missed opportunities were computed as a count over 45 virtual crossings; note that more than one missed opportunity may occur in each crossing. A child is a more efficient pedestrian with fewer missed opportunities and we anticipated the number of missed opportunities would decline following training.
Adult Pedestrian Behavior
Descriptive data from adult performance in the VR was culled from three previous studies (Schwebel et al. 2009, 2012; Stavrinos et al. 2011, Experiment 1). In all cases, the adults crossed the same VR without distraction, and one of the same traffic speeds and densities as used in the post-intervention assessment of children (Level E, 30 MPH and 12 vehicles/minute). Data were available for many but not all of the same pedestrian outcomes (unsafe crossings, start delay, looks to traffic, time to contact, and missed opportunities) from each study and were transformed if necessary to be consistent with scales used in the current study (e.g., missed opportunities were prorated if the studies used a different number of street crossings). Variables that were not observed among adults were missing due to technical improvements in the VR system over time.
Analysis Plan
Descriptive statistics were considered first, including both consideration of pedestrian outcomes for the children across each of the six training sessions and comparison to adult performance. Next, repeated-measures ANOVA tested the influence of training on behavior over sessions. Linear mixed models were constructed and tested using PROC MIXED procedure in SAS 9.2, with the five VR outcome measures as respective dependent variables, session and start level as independent variables, and demographic variables (age, gender, ethnicity, socioeconomic status) as covariates. We also used repeated-measures ANOVA to test the overall effect of training on children’s five VR outcomes from baseline to post-intervention visits.
RESULTS
Tables A1 (children) and A2 (adults) present demographic information on the samples. Missing data were minimal (<5% of all data points), and no significant correlation was found between missingness and demographic variables so analyses were conducted with all available data.
Table 1 presents the means and standard deviations for the five VR outcomes plus walking speed at baseline, across the children’s six training sessions, and following the intervention. As shown in the unshaded middle section of the table, there was a trend for start delay, TTC, and missed opportunities to decrease over the sessions, and for unsafe crossings to increase over them. Looks to traffic showed a less-obvious general trend toward decreasing over training. Figure A1 shows these trends graphically, including the p-value for the trend over time.
Table 1.
Mean outcomes (with standard deviation) across six training sessions
| Children: Pre-IV n=59 | Children: Session 1 n=58 | Children: Session 2 n=57 | Children: Session 3 n=57 | Children: Session 4 n=56 | Children: Session 5 n=56 | Children: Session 6 n=53 | Children: Post-IV | Adults: Schwebel et al. (2012) | Adults: Schwebel et al. (2009) | Adults: Stavrinos et al. (2011), Exp. 1 | |
|---|---|---|---|---|---|---|---|---|---|---|---|
| Unsafe Crossings (proportion) | .29 (.20) | .16 (.14) | .19 (.13) | .23 (.12) | .25 (.13) | .27 (.14) | .28 (.12) | .20 (.20) | .04 (.08) | .04 (.07) | .06 (.11) |
| Start Delay (sec) | 1.29 (.48) | 1.48 (.59) | 1.31 (.43) | 1.23 (.48) | 1.22 (.50) | 1.16 (.41) | 1.13 (.36) | 1.10 (.44) | 1.15 (.61) | 1.06 (.60) | 1.20 (.74) |
| Looks to Traffic (looks/sec) | .43 (.21) | 3.48 (3.64) | 2.82 (3.38) | 2.89 (3.30) | 2.74 (2.48) | 2.50 (2.54) | 3.09 (4.70) | .52 (.23) | .56 (.12) | -- | .49 (.003) |
| Time to Contact (sec) | 2.93 (.98) | 6.31 (4.12) | 4.44 (2.17) | 3.71 (1.76) | 3.56 (1.58) | 3.28 (1.53) | 3.07 (.82) | 3.37 (1.14) | -- | -- | -- |
| Missed Opportunities (count over 45 crossings) | 15.79 (37.13) | 12.02 (19.48) | 7.33 (14.25) | 8.67 (22.64) | 8.93 (15.71) | 4.30 (5.79) | 4.58 (7.41) | 4.12 (8.24) | .63 (1.74) | .99 (3.21) | 1.80 (5.85) |
| Walking Speed (miles/hour) | 3.11 (.59) | 3.03 (.62) | 3.07 (.62) | 3.08 (.66) | 3.15 (.69) | 3.11 (.69) | 3.10 (.70) | 3.22 (.72) | 2.73 (.39) | 3.00 (.41) | 2.95 (.51) |
Note: IV=intervention; Exp=experiment; sec=seconds
The darker shaded columns of Table 1 show children’s performance during baseline and post-intervention assessment sessions. Results from a one-way repeated-measures ANOVA indicated that children’s proportion of unsafe crossings decreased from baseline (M = .29, SD = .20) to post-intervention (M = .20, SD = .20), F (1, 54) = 7.25, p = .009. We also found a significant decrease in children’s start delay from baseline (M = 1.29, SD = .48) to post-intervention (M = 1.11, SD = .44), F (1, 47) = 4.55, p = .04; an increase in looks to traffic from baseline (M = .43, SD = .21) to post-intervention (M = .52, SD = .23), F (1, 47) = 4.72, p = .04; and an increase in time to contact from baseline (M = 2.93, SD = .98) to post-intervention (M = 3.37, SD = 1.14), F (1, 47) = 6.52, p = .01. There were no significant changes in the number of missed opportunities after six sessions of training.
The lightly shaded columns on the right of Table 1 show adult performance in the VR. Traffic density and speeds for adult sessions was identical to that of children’s assessments at baseline and post-intervention. As shown, children’s post-lab scores on VR outcomes were comparable to the performance of adults in some domains (start delay, looks to traffic) but not in others (unsafe crossings, missed opportunities); TTC was unavailable in adult studies due to VR technology at that time. Walking speeds were reasonably comparable. These findings suggest the training helped children learn some pedestrian skills but that further training may be required for children to reach adult levels of functioning.
Table 2 extends the descriptive data from Table 1 by considering the data trends of children’s learning across training inferentially. Specifically, we present results from repeated measures ANOVAs, including coefficient estimates and 95% confidence intervals for the main effect of session, main effect of start level, and their interaction effect for each of the five VR outcomes.
Table 2.
Fixed effects estimates in the linear mixed models for primary VR outcomes across six training sessions, adjusting for demographics
| Outcome | Fixed effect | Estimates | SE | p | 95% CI |
|---|---|---|---|---|---|
| Unsafe Crossings | Start Level | .03 | .01 | <.001 | .02, .05 |
| Session | .03 | .01 | <.001 | .02, .05 | |
| Start Level*Session | -.002 | .002 | .19 | -.005, .001 | |
| Start Delay | Start Level | -.12 | .03 | <.001 | -.17, -.06 |
| Session | -.11 | .02 | <.001 | -.16, -.07 | |
| Start Level*Session | .01 | .01 | .02 | .002, .02 | |
| Looks to Traffic | Start Level | .94 | .21 | <.001 | .52, 1.36 |
| Session | .43 | .15 | .005 | .13, .74 | |
| Start Level*Session | -.14 | .04 | <.001 | -.22, -.07 | |
| Time to Contact | Start Level | -1.57 | .08 | <.001 | -1.74, -1.40 |
| Session | -1.42 | .09 | <.001 | -1.59, -1.26 | |
| Start Level*Session | .24 | .02 | <.001 | .19, .28 | |
| Missed Opportunities | Start Level | .66 | .97 | .50 | -1.29, 2.62 |
| Session | -1.11 | .81 | .17 | -2.71, .49 | |
| Start Level*Session | -.08 | .21 | .72 | -.48, .34 |
Three of the five models – those with start delay, looks to traffic, and TTC as outcome variables – had significant start level by session interaction effects, suggesting changes over time occurred, but differed by children’s start level (See Figures 1A-1D and A2 for graphical representation). Children who began at easier levels tended to have longer start delays, indicating inferior processing of the pedestrian situation, and their start delays improved over time compared to children starting with more difficult traffic situations; this was especially true when the small sample (n=4) of children beginning at the hardest level, Level H, is overlooked. Looks to traffic showed only minor changes among children in the three easier levels, but decreased sharply for children who started at the hardest level and therefore faced highly challenging traffic situations for crossing. TTC showed the most dramatic changes, with children at the easiest level sharply decreasing their TTC as their skill improved and they faced more challenging traffic gaps to cross within.
Figure 1.
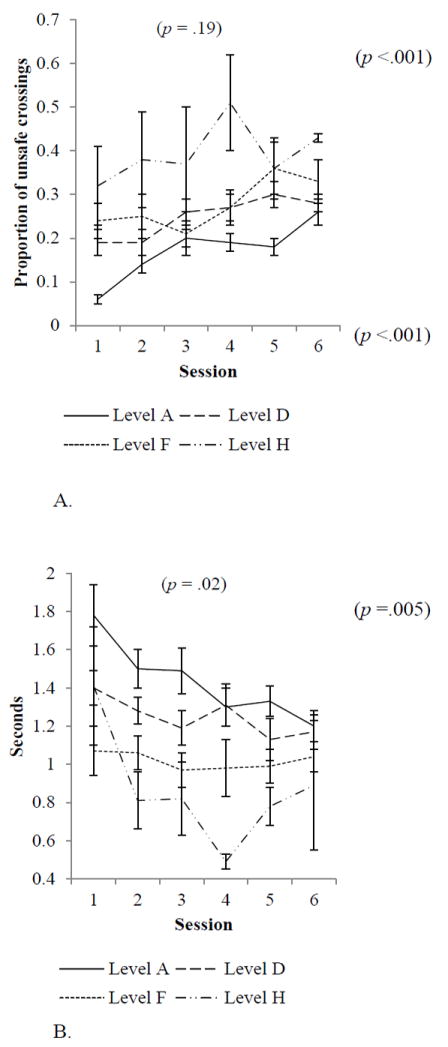
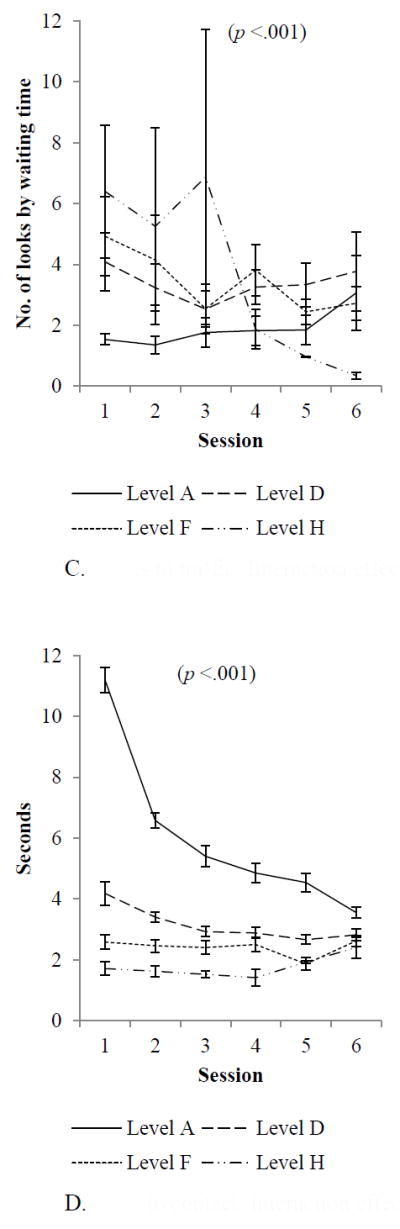
A. Unsafe crossings: Interaction effect between start level and session
B. Start delay: Interaction effect between start level and session
C. Looks to traffic: Interaction effect between start level and session
D. Time to contact: Interaction effect between start level and session
The other two models, predicting unsafe crossings and missed opportunities, did not have a significant start level by session interaction. Both start level and session predicted unsafe crossings in main effect tests, suggesting children with more difficult start levels had more unsafe crossings and that children had more unsafe crossings as they advanced to later sessions, likely because the traffic situation was getting more challenging. There were no significant main effects predicting missed opportunities.
DISCUSSION
Results from this study suggest children may learn pedestrian safety skills when exposed to repeated practice during training in virtual environments. This finding replicates previous results (Schwebel, McClure, et al. 2014; Schwebel et al. 2016) and offers optimism for future development and then dissemination of VR strategies to train children in pedestrian skills.
This study also suggests that the 270 crossings children completed across six training sessions were insufficient for most children to reach adult levels of pedestrian functioning. Matching other trials (Bart et al. 2008; McComas et al. 2002; Schwebel et al. 2016; Thomson et al. 2005), we found evidence that children were gaining efficiency and skill in their pedestrian behavior. In particular, children’s start delay – the time between the safe traffic gap appearing and entry into that gap – decreased significantly and reached near-adult levels by the end of the training. This change was particularly notable among children who started with poorer knowledge and easier levels of traffic and suggests growing sophistication in decision-making in pedestrian settings, such that children are able to perceive, judge, and decide a traffic gap is safe sooner. There also was evidence that children were attending to traffic in a manner similar to adults following the end of six training sessions and that they missed fewer safe opportunities to cross following training, although they still missed many more opportunities to cross than adults.
These results parallel closely those reported by Thomson and colleagues (2005), who used increasingly difficult animated simulations shown on a single computer monitor from an elevated, semi-aerial view to train 7-, 9-, and 11-year-old children in midblock street-crossings. Training in that study occurred over the course of four 30-40 minute sessions held weekly. Compared to a control group, children in the Thomson et al (2005) simulation demonstrated shorter start delays and fewer missed opportunities after training. They also selected smaller traffic gaps to cross within, a measure not included in the present study but that offers intriguing evidence concerning the present results. If children gain confidence in their pedestrian skills following training, they may be willing to take greater risks and choose smaller gaps to cross within. Many of these selections may be safe, but such selections also will lead to shorter TTC measures, as seen in the present study, and perhaps to more unsafe crossings when errors are made. Thus, the process of learning to be a safe pedestrian may actually increase risk for injury temporarily as children take more risks and choose smaller gaps to cross within.
In the present study, children’s raw safety – the number of unsafe crossings – remained much higher than adult levels at the post-training assessment. Building from the results of Thomson and colleagues (2005), one explanation for this finding is that children had begun to learn safer pedestrian behavior as a result of their training in the VR, but had not yet mastered the skills. This assertion is supported by the decrease in start delay found both in this study and others (Schwebel et al. 2016; Thomson et al. 2005). Future research should include more extensive training to determine whether it yields adult-level functioning in 7- and 8-year-old children.
There are alternative explanations for the finding that children do not seem to achieve adult functioning in pedestrian safety after 4-6 training sessions. One alternative is that most 7- and 8-year-old children simply lack the cognitive complexity to ever learn to cross streets at the level of adults. Evidence from our research program (Schwebel, McClure et al. 2014; Schwebel et al. 2016) and others (Thomson et al. 2005) suggests, however, that children do have the capacity to learn pedestrian behavior if given sufficient repeated practice at the task, and that occasional children achieve adult functioning after the training tested in previous trials. This evidence parallels results from youth athletic training, where success derives from repeated practice at a complex cognitive-perceptual task with moving objects (Buszard et al. 2014a, 2014b; Peper et al. 1994).
Another explanation for the results is that VR is not a suitable means to train children in pedestrian safety, and that training in streetside locations with actual traffic, laborious and expensive but probably effective (Schwebel, Barton, et al. 2014), is essential to facilitate learning. A third explanation stems from methodological issues in the present study. Perhaps children became bored with the VR training and assessments, and over time they simply chose tighter or more dangerous traffic gaps out of boredom rather than as a result of learning how to negotiate moving traffic. Perhaps the ‘excitement’ of playing what they perceived to be a game rather than an educational tool was lost over time, and children simply crossed the street aimlessly or riskily, recognizing there was no danger in the simulated decisions. Future research should incorporate alternative assessment tools.
Strengths, Limitations, and Future Directions
This study offers several strengths: it analyzed detailed data on children’s pedestrian behavior over the course of many simulated crossings offered as pedestrian safety training. It represents a diverse sample of children at a developmental stage with high risk of pedestrian injury. It also has limitations. The fact that children received increasingly more difficult traffic patterns as their skill improved over training complicates interpretation of results despite our attempt to control for the changes through covariates. Also limiting is the lack of data extending through more time; children were exposed only to 6 training sessions and it is unknown how their performance may have continued to improve with 3, 6, or 20 training sessions more. Some aspects of our methodology also created limitations. Like much behavioral research on child pedestrian safety, we used the “looks at traffic” variable as a proxy for attention, but we were unable to gather data on whether pedestrians actually attended to the traffic they saw rather than just visually perceiving it with visual looks to the left and right. We also relied only on assessment in the VR; future research should incorporate streetside assessments with actual traffic.
In summary, it appears that VR can be used effectively to teach 7- and 8-year-old children pedestrian safety skills, but the children need extensive practice to gain pedestrian skill equivalent to that of adults. Even 270 trials, as used in this study, were insufficient for most children to reach adult skill levels. Future research might prioritize studies that consider further the trajectory of children’s pedestrian safety learning and the number of trials needed to reach adult levels. Future research might also continue to parse apart various aspects of pedestrian behavior. Pedestrian behavior must not be conceptualized as a single construct, but rather as a large construct that can be broken apart into different components such as delays entering traffic, looks to traffic, walking speed within traffic, and so on. Finally, there are likely to be individual differences in children’s learning. Children with particular personality traits, cognitive skills, athletic/perceptual/motor abilities, or other individual differences may learn pedestrian skills more or less quickly, and identification of those traits may assist in intervention planning and development. As science becomes more sophisticated in its consideration of pedestrian behavior, our opportunity to train children optimally and prevent child pedestrian injuries will increase.
Supplementary Material
Acknowledgments
Thanks to Anna Johnston, Elizabeth O’Neal, Ksenia Shingarva, and the students of the UAB Youth Safety Lab for their extensive help with data collection, entry, and coding; Jodie Plumert and Kathy Christoffel for consulting advice; Aeron Gault and Tejas Thorat for IT support; and Joan Severson the Digital Artefacts team for VR development and support. The research was supported by Award Numbers R01HD058573 and R21HD078371 from the Eunice Kennedy Shriver National Institute of Child Health & Human Development. The content is solely the responsibility of the authors and does not necessarily represent the official views of the Eunice Kennedy Shriver National Institute of Child Health & Human Development or the National Institutes of Health.
References
- Barton BK. Integrating selective attention into developmental pedestrian safety research. Can Psychol. 2006;47:203–210. [Google Scholar]
- Buszard T, Farrow D, Reid M, Masters RSW. Modifying equipment in early skill development: A tennis perspective. Res Q Exerc Sport. 2014a;85:218–225. doi: 10.1080/02701367.2014.893054. [DOI] [PubMed] [Google Scholar]
- Buszard T, Farrow D, Reid M, Masters RSW. Scaling sporting equipment for children promotes implicit processes during performance. Conscious Cogn. 2014b;30:247–255. doi: 10.1016/j.concog.2014.07.004. [DOI] [PubMed] [Google Scholar]
- Chihak BJ, Plumert JM, Ziemer CJ, Babu S, Grechkin T, Cremer JF, Kearney JK. Syncrhonizing self and object movement: How child and adult cyclists intercept moving gaps in a virtual environment. J Exp Psychol. 2010;36:1535–1552. doi: 10.1037/a0020560. [DOI] [PMC free article] [PubMed] [Google Scholar]
- Gibson JJ. The ecological approach to visual perception. Hillsdale, NJ: Erlbaum; 1979. [Google Scholar]
- Grechkin T, Chihak BJ, Cremer JF, Kearney JK, Plumert JM. Perceiving and acting on complex affordances: How children and adults bicycle across two lanes of opposing traffic. J Exp Psychol. 2013;39:23–36. doi: 10.1037/a0029716. [DOI] [PMC free article] [PubMed] [Google Scholar]
- National Center for Injury Prevention and Control. WISQARS™ (Web-based Injury Statistics Query and Reporting System) Retrieved June 25, 2015, from http://www.cdc.gov/injury/wisqars/index.html.
- Peper L, Bootsma RJ, Mestre D, Bakker FC. Catching balls: How to get the hand to the right place at the right time. J Exp Psychol: Hum Percept Perform. 1994;20:591–612. doi: 10.1037//0096-1523.20.3.591. [DOI] [PubMed] [Google Scholar]
- Plumert JM, Kearney JK. Linking decisions and actions in dynamic environments: How child and adult cyclists cross roads with traffic. Ecological Psychol. 2014;26:125–133. doi: 10.1080/10407413.2014.874933. [DOI] [PMC free article] [PubMed] [Google Scholar]
- Plumert JM, Kearney JK, Cremer JF. Children’s perception of gap affordances: Bicycling across traffic-filled intersections in an immersive virtual environment. Child Dev. 2004;75:1243–1253. doi: 10.1111/j.1467-8624.2004.00736.x. [DOI] [PubMed] [Google Scholar]
- Schwebel DC, Stavrinos D, Byington KW, Davis T, O’Neal EE, de Jong D. Distraction and pedestrian safety: How talking on the phone, texting, and listening to music impact crossing the street. Acc Anal Prevent. 2012;45:266–271. doi: 10.1016/j.aap.2011.07.011. [DOI] [PMC free article] [PubMed] [Google Scholar]
- Schwebel DC, Barton BK, Shen J, Wells HL, Bogar H, Heath G, McCullough D. Systematic review and meta-analysis of behavioral interventions to improve child pedestrian safety. J Pediatr Psychol. 2014;39:826–845. doi: 10.1093/jpepsy/jsu024. [DOI] [PMC free article] [PubMed] [Google Scholar]
- Schwebel DC, Combs T, Rodriguez D, Severson J, Sisiopiku V. Community-based pedestrian safety training in virtual reality: A pragmatic trial. Acc Anal Prevent. 2016;86:9–15. doi: 10.1016/j.aap.2015.10.002. [DOI] [PubMed] [Google Scholar]
- Schwebel DC, Gaines J, Severson J. Validation of virtual reality as a tool to understand and prevent child pedestrian injury. Ac Anal Prevent. 2008;40:1394–1400. doi: 10.1016/j.aap.2008.03.005. [DOI] [PubMed] [Google Scholar]
- Schwebel DC, McClure LA, Severson J. Teaching children to cross streets safely: A randomized, controlled trial. Health Psychol. 2014;33:628–638. doi: 10.1037/hea0000032. [DOI] [PMC free article] [PubMed] [Google Scholar]
- Schwebel DC, Pitts DD, Stavrinos D. The influence of carrying a backpack on college student pedestrian safety. Acc Anal Prev. 2009;41:352–356. doi: 10.1016/j.aap.2009.01.002. [DOI] [PubMed] [Google Scholar]
- Stavrinos D, Byington KW, Schwebel DC. Distracted walking: Cell phones increase injury risk for college pedestrians. J Safety Res. 2011;42:101–107. doi: 10.1016/j.jsr.2011.01.004. [DOI] [PubMed] [Google Scholar]
- Thomson JA, Tolmie AK, Foot HC, Whelan KM, Sarvary P, Morrison S. Influence of virtual reality training on the roadside crossing judgments of child pedestrians. J Exp Psychol: Appl. 2005;11:175–186. doi: 10.1037/1076-898X.11.3.175. [DOI] [PubMed] [Google Scholar]
- WHO. Pedestrian safety: A road safety manual for decision-makers and practitioners. Geneva: WHO; 2013. [Google Scholar]
Associated Data
This section collects any data citations, data availability statements, or supplementary materials included in this article.