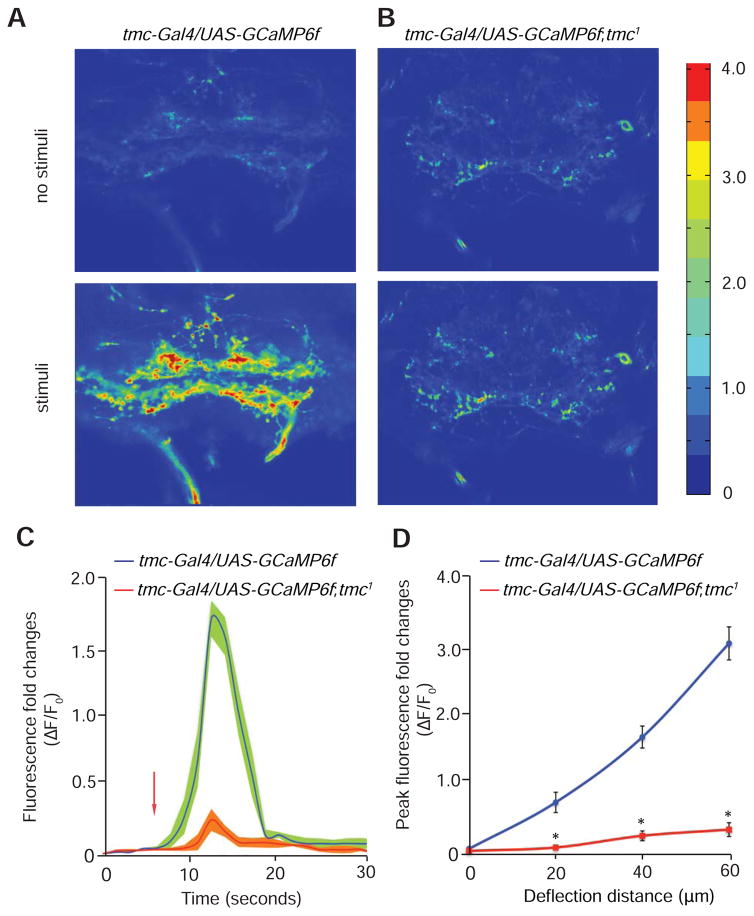
Figure 5. Ca2+ dynamics of tmc neurons in response to mechanical stimuli.
(A and B) Representative images showing the relative changes in Ca2+ levels in the SEZ with and without mechanical stimulation of the labellum. The Ca2+ dynamics were monitored using GCaMP6f. The color scale to the right of (H) shows ΔF/F.
(A) tmc-Gal4,UAS-GCaMP6f.
(B) tmc-Gal4,UAS-GCaMP6f;tmc1.
(C) The time course showing the Ca2+ dynamics in the SEZ of tmc-Gal4,UAS-GCaMP6f and tmc-Gal4,UAS-GCaMP6f;tmc1 flies. Shown are the fold changes in fluorescence intensity (ΔF/F0). The arrow indicates the onset of mechanical stimuli. n=5.
(D) The fold changes in peak fluorescence intensity (ΔF/F0) in response to different deflection distances for tmc-Gal4,UAS-GCaMP6f and tmc-Gal4,UAS-GCaMP6f;tmc1 flies. n=5.
The error bars indicate SEMs. *p<0.01. ANOVA tests with Scheffé’s post-hoc analysis.

